Abstract
Disorganization of collagen fibers is a sign of early-stage cartilage degeneration in osteoarthritis knees. Water molecules trapped within well-organized collagen fibrils would be sensitive to collagen alterations. Multi-component T2* mapping with ultrashort echo time (UTE) acquisitions is here proposed to probe short T2 relaxations in those trapped water molecules. Six human tibial plateau explants were scanned on a 3T MRI scanner using a home-developed UTE sequence with TEs optimized via Monte Carlo simulations. Time constants and component intensities of T2* decays were calculated at individual pixels using the nonnegative least squares algorithm. Four T2*-decay types were found: 99% of cartilage pixels having mono-, bi-, or non-exponential decay, and 1% showing tri-exponential decay. Short T2* was mainly in 1-6ms while long T2* was ~22ms. A map of decay types presented spatial distribution of these T2* decays. These results showed the technical feasibility of multi-component T2* mapping on human knee cartilage explants.
Keywords: T2* mapping, UTE imaging, Multi-component exponential fitting, cartilage degeneration, Osteoarthritis knee
INTRODUCTION
Articular cartilage degeneration in early-stage osteoarthritis (OA) is characterized with biochemical alterations in extracellular matrix (ECM) such as loosening of collagen network and depletion of proteoglycan (PG), in contrast to with morphologic abnormalities in advanced OA such as cartilage fibrillation and fragmentation. During OA development three main components of the ECM (i.e., water, collagen, and PG) have been known to experience alterations in different ways. Water content increases at early stage but decreases from moderate to advanced stages (1, 2). PG content, however, decreases consistently from early to advanced stages (1, 2). Highly-ordered collagen fibers become disorganized at early stage and severely disrupted at advanced stage (3, 4). Either PG content or collagen fiber network undergoes a continuously degenerative alteration from early to advanced stages and thus has potential to be an intrinsic marker for MRI detection more specific than bulk water content.
PG content has been targeted as a marker by the dGEMRIC (delayed gadolinium-enhanced magnetic resonance imaging of cartilage) and sodium imaging. The dGEMRIC detects loss of PG content via a negatively-charged contrast agent with high sensitivity, but requires injection and 60-90 minutes delay time to allow contrast particles to fully penetrate the tissue (5). Sodium imaging detects loss of PG content via decrease of tissue sodium concentration with high specificity, but requires special hardware and suffers from low resolution (6, 7).
Collagen network has been rarely exploited with MRI due to lack of efficient imaging approaches including diffusion-weighted imaging (DWI) and diffusion tensor imaging (DTI) (8, 9), even though collagen relaxation properties were well investigated with nuclear magnetic resonance (NMR) a decade ago. NMR relaxation studies on cartilage plugs, harvested from femoral condyles of fresh bovine knee joints, showed that there were two proton spin reservoirs of distinct transverse relaxations related to collagen (2): collagen (T2 ~ 0.02ms) and water trapped within collagen fibrils (T2 ~ 4ms), in addition to spin reservoirs related to bulk water (T2 ~ 20ms) and mobile PG (T2 ~ 1ms). Conventional T2 mapping performed on clinical MRI scanners captures relaxations only from one of the four spin reservoirs, the bulk water, due to limitation of minimum echo time (~10ms) used in data acquisition.
In this study we explored technical feasibility of multi-component T2* mapping of articular cartilage in clinical setting, as an effort to the ultimate goal of detecting early-stage OA through collagen network integrity reflected by effective transverse relaxation (T2*) of collagen fibrillar water. A home-developed sequence, AWSOS (acquisition-weighted stack of spirals) (10), was employed to acquire data at ultrashort echo time (TE<1ms). Specifically, this study aimed to address the following technical issues: 1) How many T2* components are detectable in human cartilage in a clinical setting? 2) In what ranges are those T2* relaxation times and intensities? 3) How to select an optimal set of TEs for detecting those T2* values? 4) What does the distribution of multi-component T2* relaxations over entire cartilage look like?
METHODS AND MATERIALS
Explants preparation
Human explants of tibial plateau were harvested from intact cadaveric specimens (n=5) and total knee replacement (n=1): age 58±28yrs in 18-82yrs, 3 males and 3 females, 3 healthy (asymptomatic) and 3 diseased (advanced OA) classified by polarized light microscopy (PLM) images. The collection of the explants was in accordance to protocols approved by the Committee for the Oversight of Research for the Dead (CORID) and the Institutional Review Board (IRB) of the University of Pittsburgh. A detailed description of the explants preparation was given in Ref. 11. The explants were thawed in a refrigerator 12 hours before MRI scans.
TE designs
The goal of designing echo times (TEs) for multi-component T2* mapping is to find a set of TEs that has sufficient range to cover possible T2* values in cartilage and has small size to minimize total scan time under a given signal-to-noise ratio (SNR). Monte Carlo simulation was used to design TEs (12). Eq. [1] was employed to generate signals of T2* decay, s(TE), at designed TEs with known T2* component intensities (in percentage), aj, and time constants (in millisecond), T2*j, plus a random noise, n(TE), of normal distribution N(0, σ2).
The number of T2* components was selected upon our priori information as detailed below. The SNR was defined by total signal intensity, A0, and standard deviation (SD), σ, of the noise, i.e., SNR = A0/σ. A non-linear fitting to the noisy signal was implemented using function exp1 or exp2 in Matlab (The MathWorks, Inc, Natick, MA). The fitting was repeated 500 times with independent noise trial. The mean and SD of the fitted T2* time or component intensity over these noise trials were considered as Monte Carlo simulation results. Single-component T2* decays were first simulated for simplicity and multi-component decays were then studied based on the experience acquired from the single-component simulations. Priori information about T2* in human cartilage was obtained on a small testing group of 110 cartilage pixels using the non-negative least squares (NNLS) algorithm (13). Those pixels were from superficial, intermediate and deep layers of two explants. T2* relaxation was found to have mono-, bi-, and tri-exponential decays (only ~1% of the pixels in tri-exp decay) and the short-T2* time was 0.5-15ms (mean=3.5ms) and the long-T2* was 10-80ms (mean=32ms). Monte Carlo simulations were thus focused on bi-component decays with short-T2* values of 1-5ms and a long-T2* value of 30ms.
MRI scans
MRI experiments on the explants were implemented on a clinical 3T scanner (Magnetom Trio Tim, Siemens Medical Solutions, Erlangen, Germany) with an 8-channel knee coil (Invivo Inc., Gainesville, FL). The explants were placed at the isocenter inside the magnet in such a way that the main magnetic field was parallel to the interface between tibia and cartilage. A home-developed, fast, 3D, UTE sequence, AWSOS (acquisition-weighted stack of spirals), was used for data acquisitions (10). This sequence is unique in its design (14), and applicable to both ex vivo and in vivo knee cartilage. Spiral imaging is well known to be sensitive to off-resonance that causes image blurring. We limited this effect under 10% by achieving a good shim (linewidth<20Hz) through localized interactive shimming and a strong fat saturation provided by the manufacturer (Siemens, VB15). In our experiments acquisition parameters were: FOV = 100mm, matrix size = 256, spatial resolution = 0.391 mm, slice number=40-50 at a thickness of 2 mm, spiral interleaves=64 at readout time Ts=5.28 ms, hard RF duration=0.4 ms, TR=100 ms, TE=0.5-40 ms at 11 steps, θ=30°, total scan time=4.3-5.3min for one TE image.
T2* mapping and data analysis
T2* mapping was performed on a pixel-by-pixel basis in cartilage regions. The NNLS algorithm was used for multi-component T2* fitting in which an extra large T2* value (e.g., 350ms) was included to count on base-line signal in the measured data. An interactive iteration was implemented under a condition of minimum number of T2* components. The precision of a component T2* time was set to 0.1ms during the iterations. Component intensity was normalized relative to total intensity of all components and presented in percentage (%). A T2* component was excluded from the fitting when its intensity was less than 5% due to low certainty. Data analysis on the multi-component T2* maps was performed at a global level over entire cartilages of individual explants for 1) finding distribution of pixel number of T2* components to uncover major numbers of T2*-decay components, 2) determining a cut-off value to separate short-T2* from the long-T2*, and 3) computing statistical quantities (mean, SD, and median) of short- and long-T2* relaxations for quantitative description of the cartilages.
RESULTS
TE designs
For single-component T2* decay, Monte Carlo simulations were performed with T2*=30ms, A0=1000, σ=3.5, SNR=105 at TE=30ms. Four groups of two TE values, with varying locations and spans around the target T2* value (=30ms), were examined (Tab. 1). It was found that Group #4 [TE = (20, 40) ms] was the best design among the four groups in terms of producing minimum standard deviation (SD=11.5%) of the estimated T2* value. Increasing the number of TEs led to a decrease of the SD of estimated T2* value. Three groups of multiple TE values ranging from 3- to 7-TEs were investigated (Tab. 1). The 3-TE group [TE = (15, 30, 60) ms] produced an SD value of 7.2% for the estimated T2* value. The 7-TE group [TE = (15, 20, 25, 30, 35, 40, 45) ms] produced an SD value of 0.2%. However, the 3-TE group may be an optimal design in practice under limitation of acquisition time. This group had TE values at 0.5-, 1.0-, and 2.0-folds of the target T2* value, and this feature was used as guideline in our TE designs for multi-component T2* decays.
Table 1.
| TE group (ms) | Mean (ms) | SD (ms) | SD (%) | |
|---|---|---|---|---|
| 2-TE | #1: (25, 35) | 31.16 | 7.27 | 23.3 |
| #2: (20, 30) | 31.34 | 6.23 | 19.9 | |
| #3: (30, 40) | 31.84 | 9.62 | 30.2 | |
| #4: (20, 40) | 30.24 | 3.49 | 11.5 | |
|
| ||||
| Multi- TE |
3-TE: (15, 30, 60) | 30.29 | 2.19 | 7.2 |
| 5-TE: (10, 20, 30, 40, 50) | 30.07 | 1.42 | 4.7 | |
| 7-TE: (15, 20, 25, 30, 35, 40, 45) | 30.2 | 0.05 | 0.2 | |
T2*=30m s, A0=1000, σ=3.5, SNR=105 @ TE=30ms, and noise-trials = 500.
T2*=30ms, A0=1000, σ=3.5, SNR=105 @ TE=30ms, and noise-trials = 500.
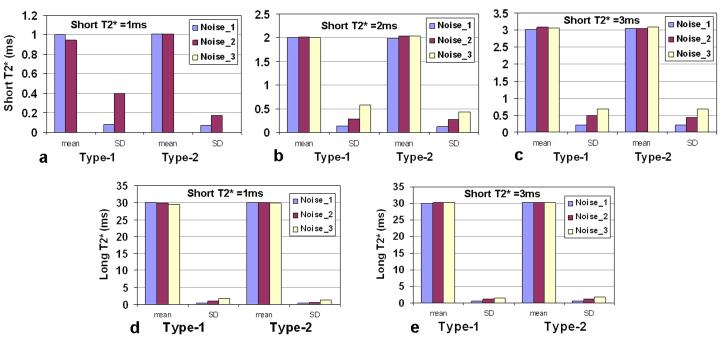
For bi-component T2* decay, Monte Carlo simulations were performed with long-T2* component = (30ms, 75%), short-T2* component = (1/2/3ms, 25%); and SNR (at TE=0ms) = 286 (noise_1), 143 (noise_2), or 95 (noise_3). In light of priori information about the range of short T2* value (0.5-10ms) in human knee cartilage obtained from the testing group of pixels, we focused on two most-likely types of TE design and examined them with Monte Carlo simulation: Type-1 (9-TE) = (0.5, 1.5, 3.0, 4.5, 7, 10, 20, 30, 40) ms and Type-2 (11-TE) = (0.5, 1, 2, 3, 4, 5, 7, 10, 20, 30, 40) ms. Type-2 was found producing smaller SD value for a short-T2* value of 1, 2, or 3ms than Type-1 at all the three noise levels (Fig. 1a-c). For the long-T2* value of 30ms, Type-2 was also better than Type-1 (Fig. 1d-e). Therefore, Type-2 was a better selection in the bi-component case and used in this study.
Fig. 1.
Monte Carlo simulations for bi-component T2* fitting: long T2*=(30ms, 75%), short T2* =(1/2/3ms, 25%); SNR (at TE=0ms) =286 (noise_1), 143 (noise_2) or 95 (noise_3); noise trials=500; Type-1 (9-TE) (ms) = (0.5, 1.5, 3.0, 4.5, 7, 10, 20, 30, 40), Type-2 (11-TE) (ms) = (0.5, 1, 2, 3, 4, 5, 7, 10, 20, 30, 40).
a-c) For short T2* at 1, 2, and 3ms, Type-2 (11-TE) produced smaller SD values than Type-1 (9-TE) when T2* became shorter from 3 to 1ms.
d-e) For a long T2* at 30ms, the SD values are less than 7% at all the three SNR levels for both Type-1 and Type-2. Note: in c) the mean and SD at noise_3 were excluded due to large SD value.
T2* mapping and data analysis
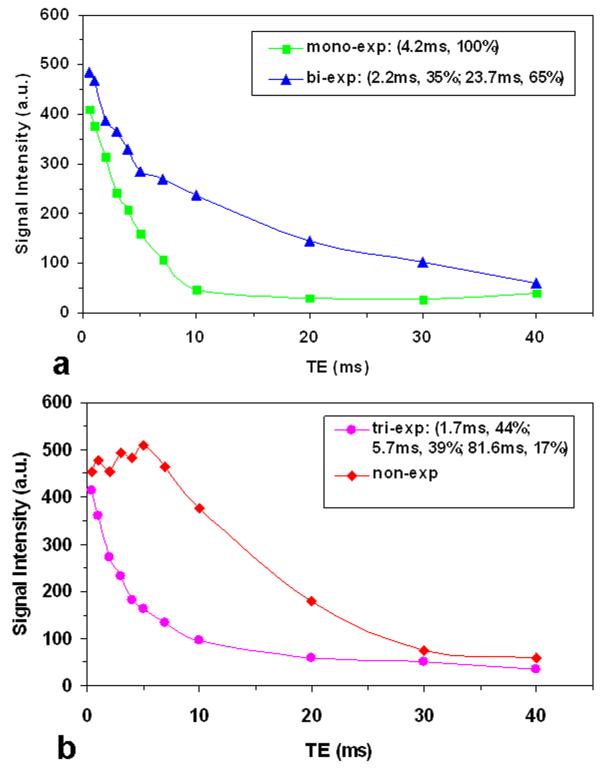
Across the six cartilage explants investigated we found four types of T2* decay curve: mono-, bi-, tri-, and non-exponential (Fig. 2). Majority of the cartilage pixels (99%) had a decay curve of mono-, bi-, or non-exponential and very small number of the pixels (~1%) had a tri-exponential decay. The non-exponential decay was characterized by a non-decay segment at short TEs (<6ms), followed by an exponential-decay segment (Fig. 2b). The pixels of non-exponential decay were excluded from our multi-component fitting. The pixels of mono- or bi- exponential decay were described together with a bi-component decay model, in which the mono-exponential decay was considered as a special case. Separate maps were then generated for the first T2* (or short-T2*) and second T2* (or long-T2*) components.
Fig. 2.
Four typical decay curves found in our cartilage images with UTE acquisitions: mono-, bi-, tri-, and non-exponential decays. These decay curves were differentiated primarily in the first 10ms and became mono-exp decay thereafter.
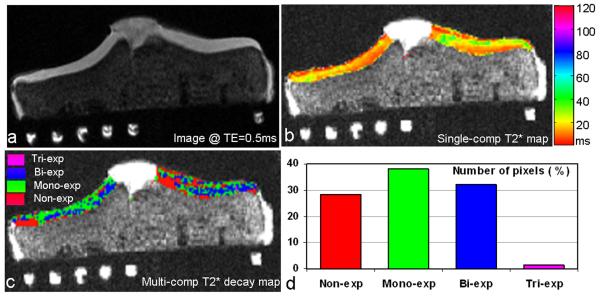
Figure 3 shows the multi-component T2* decay map in which decay types (e.g., mono-, bi-, tri-, and non-exp) were encoded with colors. Compared with the single-component T2* map in which T2* time was displayed in color, the T2* decay map presented much more detailed descriptions of cartilage variations by T2* decay type. However, it should be noted that the T2* decay map is a qualitative map used for tracking spatial extension of pixels with the same decay type, rather than for quantitative evaluation of cartilage degeneration.
Fig. 3.
Multi-component T2* mapping of a human tibial cartilage (asymptomatic, 18 yrs old, male): a) Cartilage image at TE=0.5ms (fat saturated, awsos sequence, resolution=0.39mm), b) Conventional T2* map of the cartilage (mono-exp fitting, 11-TE), c) Multi-component T2* decay map of the cartilage (multi-component exp fitting, 11-TE), and d) Distribution of pixel number over the four recognized types of T2* decays. The multi-component T2* decay map in c) unveiled more detailed spatial variations of T2* relaxation in the cartilage than the single-component T2* map in b). Almost all the cartilage pixels (99%) had decays of mono-, bi-, or non-exp type.
The number of pixels in an individual decay type in this cartilage was 28.3% in non-exponential, 38.3% in mono-exponential, 32.0% in bi-exponential or 1.4% in tri-exponential. The pixels were falling in three main decay types (i.e., non-, mono-, and bi-exponential), with comparable pixel numbers among the individual decay types (Fig. 3d). This feature was consistently observed in all the six explants investigated, although exact percentage of pixel number in an individual decay type altered from one explant to another. However, we did not find a correlation between cartilage degeneration and the percentage of pixel number.
No obvious distinction between short and long T2* time or component-intensity was discerned. Examination of the mono-component T2* times, however, revealed several different peaks within the short-T2* relaxation range. A cut-off T2* value, below which T2* times were considered ‘short’, were chosen from these peaks independently for each of the explants. The cut-off values were in a range of 3-11ms (8±3ms in mean±SD, median=8ms) across the six explants. Application of the cut-off value to the explants defined the separation of short- and long-T2* relaxations for the following quantitative evaluations.
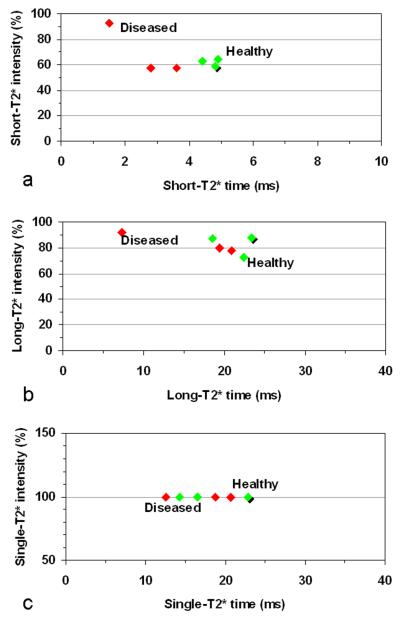
T2* values averaged over entire cartilage in each of the explants were shown in Figure 4. Averaged short-T2* values are 1.5-4.9ms, with a clear separation between the diseased (1.5-3.6ms) and healthy (4.4-4.9ms) cartilages (Fig. 4a). The averaged short-T2* values of the healthy cartilages are in a narrower range (0.5ms) than those of the diseased cartilages (2.1ms). Averaged long-T2* values are in a large range of 7.3-23.4ms, with a mixed distribution between the healthy and diseased cartilages (Fig. 4b). Averaged single-component-T2* values are 12.5-22.9ms and demonstrated substantial overlap in T2* value (Fig. 4c). These results showed that short-T2* relaxation may be more sensitive to cartilage degeneration than long-T2* or single-T2* relaxation. However, this observation was based on a very limited number (six) of cartilage explants and thus its statistical significance is unknown at this stage. A study on a larger number of cartilages is needed to achieve statistical significance.
Fig. 4.
A 2D plot of global averages of T2* relaxation time and intensity of the investigated cartilages with three asymptomatic/healthy (green, shadow at HTP-5) and three diseased (red): a) Short-T2* component from multi-component exponential fitting, b) Long-T2* component, and c) Single-component from conventional mono-exponential fitting. The short-T2* component differentiated the diseased cartilages from the asymptomatic ones, while the long-T2* component or single-component did not. The percent intensities are not added up to 100 because they are averages instead of values at individual pixels.
DISCUSSION
The results of this study demonstrated the technical feasibility of investigating human cartilage degeneration through the multi-component T2* mapping with ultrashort echo time acquisitions (McT2*mute). Four types of T2* decays were observed in all of the six cartilage explants (both normal and OA): mono-, bi-, tri-, and non-exponential (Fig. 2), with 99% of the cartilage pixels experiencing mono-, bi-, or non-exponential decay (Fig. 3). Bi-exponential decay is a reflection of both trapped and free water molecules in cartilages contributing to short- and long-T2* relaxations, respectively. The tri-exponential decay exhibited an additional short-T2* component (<2ms) which may be the result of fragmented (mobile) proteoglycan (PG) (2). The non-exponential decay happened at about one third of total cartilage pixels (Fig. 3d). This may be a problem for T2* fitting if those pixels are not identified and excluded from the fitting. On the other hand, the non-exponential decay may reflect new information about the interior of cartilage even though reasons for it remain unknown at this stage.
Also interesting is that only one third of pixels showed bi-exponential decay (Fig. 3d). That was due in part to the exclusion of low component intensity (<5%). Partial volume effect should not be a factor for it because of the high image resolution used and the spatial distribution of those pixels. The possible loss of part of water compartments in those cadaveric explants used in this study, compared with water in live cartilages, might be part of the reason. This is an open question and needs to be investigated in in vivo studies.
The short-T2* component had a T2* value mainly in a range of 1-6ms (Fig. 4a). We speculated that it was most likely from water molecules trapped within collagen fibrils, based on the NMR observations (T2 ~ 4ms) (2). Short-T2* component might be from collagen or proteoglycan itself, but that was not the case in this study because T2 value of collagen or proteoglycan is in microsecond (~30μs) (2) and could not be detected in this study with the min TE = 0.5ms. Mobile (fragmented) proteoglycan might contribute to short-T2* component due to its T2 value of ~1ms (2), but at low end of the short-T2* range. Short-T2* time may be reduced in presence of OA as suggested in Fig. 4a. This may be due to the loosening of collagen network which makes it easier for fibrils to release their trapped water molecules except strongly bounded water molecules (of shorter short-T2* time). The short-T2* time may also be affected by loss of PG content as shown in Reference 15. Collagen fibrils may change their structures and thus alter fibrillar water content when proteoglycan is missing. The magic angle effect is another well-known factor altering T2* time as demonstrated by excellent works in References 16-19. In this ex vivo study, however, magic angle effect did not influence the T2* values significantly due to special positioning of the explants used. However, it should be counted on in in vivo studies where positioning freedom is limited.
CONCLUSIONS
This study has demonstrated that the multi-component T2* mapping with ultrashort echo time acquisitions (McT2*mute) was technically feasible on human cartilage explants in clinical setting (3T MRI scanner). Under the min TE of 0.5ms, most of cartilage pixels were found to have bi-/mono-component T2* relaxations with short-T2* values of 1-6ms and long-T2* values of ~22ms at a wide range of component intensity (0-100%). The map of T2* decay types, a unique outcome from the multi-component T2* mapping, showed spatial distribution of those T2* components at high resolution. The echo times used in this study (i.e., eleven TEs in a range of 0.5-40ms) were shown reasonabile to cover those short- and long-T2* values in the cartilage explants. Therefore, the McT2*mute technique is applicable to human knee cartilage explants.
Acknowledgments
This work was supported in part by NIH R01 CA106840 and R01 AR052784-03S1.
REFERENCES
- 1.Blumenkrantz G, Majumdar S. Quantitative magnetic resonance imaging of articular cartilage in osteoarthritis. Eur Cell Mater. 2007;13:75–86. doi: 10.22203/ecm.v013a08. [DOI] [PubMed] [Google Scholar]
- 2.Lattanzio PJ, Marshall KW, Damyanovich AZ, Peemoeller H. Macromolecule and water magnetization exchange modeling in articular cartilage. Magn Reson Med. 2000;44:840–851. doi: 10.1002/1522-2594(200012)44:6<840::aid-mrm4>3.0.co;2-k. [DOI] [PubMed] [Google Scholar]
- 3.Lohmander LS. Markers of altered metabolism in osteoarthritis. J Rheumatol Suppl. 2004;70:28–35. [PubMed] [Google Scholar]
- 4.Gay S, Miller EJ. Semper bonis artibus. Gustav Fischer Verlag; Germany: 1978. Collagen in the physiology and pathology of connective tissue; p. 109. [Google Scholar]
- 5.Burstein D, Velyvis J, Scott KT, Stock KW, Kim YJ, Jaramillo D, Boutin RD, Gray ML. Protocol issues for delayed Gd(DTPA)(2-)-enhanced MRI (dGEMRIC) for clinical evaluation of articular cartilage. Magn Reson Med. 2001;45:36–41. doi: 10.1002/1522-2594(200101)45:1<36::aid-mrm1006>3.0.co;2-w. [DOI] [PubMed] [Google Scholar]
- 6.Paul PK, O’Byrne EM, Gupta RK, Jelicks LA. Detection of cartilage degradation with sodium NMR. Br J Rheumatol. 1991;30:318–318. doi: 10.1093/rheumatology/30.4.318. [DOI] [PubMed] [Google Scholar]
- 7.Shapiro EM, Borthakur A, Gougoutas A, Reddy R. 23Na MRI accurately measures fixed charge density in articular cartilage. Magn Reson Med. 2002;47:284–291. doi: 10.1002/mrm.10054. [DOI] [PMC free article] [PubMed] [Google Scholar]
- 8.Miller KL, Hargreaves BA, Gold GE, Pauly JM. Steady-state diffusion-weighted imaging of in vivo knee cartilage. Magn Reson Med. 2004;51:394–398. doi: 10.1002/mrm.10696. [DOI] [PubMed] [Google Scholar]
- 9.Filidoro L, Dietrich O, Weber J, Rauch E, Oerther T, Wick M, Reiser MF, Glaser C. High-resolution diffusion tensor imaging of human patellar cartilage: feasibility and preliminary findings. Magn Reson Med. 2005;53:993–998. doi: 10.1002/mrm.20469. [DOI] [PubMed] [Google Scholar]
- 10.Qian Y, Boada FE. Acquisition-weighted stack of spirals for fast high-resolution 3D UTE MR imaging. Magn Reson Med. 2008;60:135–145. doi: 10.1002/mrm.21620. [DOI] [PubMed] [Google Scholar]
- 11.Williams AA, Qian Y, Bear D, Boada FE, Chu CR. Ultra-Short TE-Enhanced T2* Mapping of Cartilage; Proceedings of the 17th Annual Meeting of ISMRM; Honolulu, Hawaii, USA. 2009; p. 3989. E-poster. [Google Scholar]
- 12.Rubinstein RY, Kroese DP. Simulation and the Monte Carlo Method. 2nd edition John Wiley & Sons; New York: 2008. p. 345. [Google Scholar]
- 13.Lawson CL, Hanson RJ. Solving least square problems. Prentice Hall; Englewood Cliffs, NJ: 1974. p. 340. [Google Scholar]
- 14.Qian Y, Boada FE. Method for producing a magnetic resonance image using an ultra-short echo time. USPTO Application #: 20080258727. 2008 U.S. Patent Application.
- 15.Mosher TJ, Chen Q, Smith MB. 1H magnetic resonance spectroscopy of nanomelic chicken cartilage: effect of aggrecan depletion on cartilage T2. Osteoarthritis Cartilage. 2003;11:709–715. doi: 10.1016/s1063-4584(03)00155-9. [DOI] [PubMed] [Google Scholar]
- 16.Fullerton GD, Rahal A. Collagen structure: The molecular source of the tendon magic angle effect. J Magn Rason Imaging. 2007;25:345–361. doi: 10.1002/jmri.20808. [DOI] [PubMed] [Google Scholar]
- 17.Mosher TJ, Dardzinski BJ. Cartilage MRI of T2 relaxation time mapping: overview and applications. Semin Musculoskeloskelet Tadiol. 2004;8:355–368. doi: 10.1055/s-2004-861764. [DOI] [PubMed] [Google Scholar]
- 18.Fullerton GD, Cameron IL, Ord VA. Orientation of tendons in the magnetic field and its effect on T2 relaxation times. Radiology. 1985;155:433–435. doi: 10.1148/radiology.155.2.3983395. [DOI] [PubMed] [Google Scholar]
- 19.Xia Y. Magic-angle effect in magnetic resonance imaging of cartilage: a review. Invest Radiol. 2000;35:602–621. doi: 10.1097/00004424-200010000-00007. [DOI] [PubMed] [Google Scholar]


