

Abstract
Background
GSK690693 is a small molecule ATP-competitive inhibitor of the pro-survival kinase Akt. Since Akt regulates multiple downstream targets including transcription factors, glycogen synthase 3, the pro-apoptotic protein Bad, as well as MDM2 and mTORC1, it was tested against the in vitro and in vivo panels of the Pediatric Preclinical Testing Program (PPTP).
Procedures
GSK690693 was tested in vitro at concentrations from 1 nM to 10 μM, and against the in vivo panel of xenografts at a dose of 30 mg/kg daily x 5 for 6 consecutive weeks. Three measures of in vivo antitumor activity were used: 1) an objective response measure modeled after the clinical setting; 2) a treated to control (T/C) tumor volume measure; and 3) a time to event measure based on the median event-free survival (EFS) of treated and control animals for each xenograft.
Results
GSK690693 inhibited cell growth in vitro with IC50 values between 6.5 nM and >10 μM. In vivo, GSK690693 significantly increased EFS in 11 of 34 (32%) solid tumor xenografts, most notably in all 6 osteosarcoma models, but not in any of the 8 ALL xenografts tested. No objective responses were observed and only one solid tumor met EFS T/C criteria for intermediate activity.
Conclusions
GSK690693 demonstrated broad activity in vitro, however our results against both the solid tumor and ALL PPTP in vivo panels demonstrate that, as single agent at the dose and schedule used, GSK690693 has only modest antitumor activity.
Keywords: Preclinical Testing, Developmental Therapeutics, Akt inhibitor
INTRODUCTION
Akt kinases (or protein kinase B, PKB) are three serine-threonine kinase isoforms at the center of a complex pathway that senses growth factor stimulation and mediates cell proliferation, metabolism and death (reviewed in [1,2]). Constitutive Akt activation has been reported in a number of cancer types, and its activity has been linked to both oncogenesis and poorer prognosis [3,4]. Akt can be constitutively activated by mutation, or more commonly as a consequence of abnormal upstream signaling by modulators including phosphatidylinositol-3-kinase (PI3K), or by loss or mutations in negative regulators such as the serine phosphatase PTEN [5]. Also, constitutively active Akt has been shown to reduce cell sensitivity to pro-apoptotic drugs [6,7]. All of these factors have pointed to Akt as a very attractive target for pharmacological intervention in cancer [8,9].
Two phosphorylation sites regulate the activity of Akt; phosphorylation at threonine residue 308 (pAktThr308) is a requirement while further phosphorylation at serine 473 (pAktSer473) greatly increases enzymatic activity [10]. These events are mediated by the kinase PDK1 after Akt is recruited to the plasma membrane, and depend on levels of PI3, which are in turn controlled by PTEN [11]. Akt kinase activity regulates multiple downstream targets including FOXO transcription factors, glycogen synthase 3 isoforms, the pro-apoptotic protein Bad, and mTORC1, as well as apoptosis inhibitors such as mdm2 and XIAP [4].
The PI3K/Akt signaling pathway plays an important role in several cancer types, including pediatric cancers [4]. Akt phosphorylation is detectable in a number of pediatric solid tumors, including neuroblastoma [12], rhabdomyosarcoma [13], and Ewing sarcoma [14]. In neuroblastoma clinical specimens, AKT was highly phosphorylated at Ser473 in 61.2% (71 of 116) and at Thr308 in 62.9% (73 of 116) of cases, with 66 (56.9%) cases positive at both sites [12]. Akt activation is a marker of poor prognosis in neuroblastoma [12]. in which both IGF-1R signaling [15,16] and BDNF/TrkB signaling [17–19] have been suggested as initiators of activation of PI3K and Akt. For rhabdomyosarcoma clinical specimens, pAktThr308 was elevated in 42% and 35% of alveolar and embryonal rhabdomyosarcoma cases, respectively, while pAktSer473 was increased in 43% of alveolar rhabdomyosarcoma and 55% of embryonal rhabdomyosarcoma. The latter phosphorylation was associated with lower overall survival (p< 0.001) and recurrence-free survival (p< 0.0009) [13]. Similarly, Akt activation has been demonstrated in several hematological malignancies [20].
GSK690693 is a small molecule inhibitor of the three isoforms of Akt, acting through ATP competition, with specificity limited to Akt (and to some extent the AGC kinase family) [21]. Its activity against different ALL cell lines and cancer models has been described elsewhere [22,23]. Currently a Phase I dose escalation clinical trial is underway for solid tumors and lymphoma patients [24]. GSK690693 was selected for systematic testing by the PPTP based on the relevance of both the target molecule and the PI3K/Akt pathway for cell survival and proliferation. This report describes testing of GSK690693 against the PPTP’s in vitro panel of cell lines and in vivo xenograft solid tumor and ALL panels.
MATERIALS AND METHODS
In Vitro Testing
In vitro testing was performed using DIMSCAN, a semiautomatic fluorescence-based digital image microscopy system that quantifies viable (using fluorescein diacetate [FDA]) cell numbers in tissue culture multiwell plates [25]. Cells were incubated in the presence of GSK690693 for 96 hours at concentrations from 1 nM to 10 μM and analyzed as previously described [26].
In Vivo Tumor Growth Inhibition Studies
CB17SC-M scid−/ − female mice (Taconic Farms, Germantown NY), were used to propagate subcutaneously implanted kidney/rhabdoid tumors, sarcomas (Ewing, osteosarcoma, rhabdomyosarcoma), neuroblastoma, and non-glioblastoma brain tumors, while BALB/c nu/nu mice were used for glioma models, as previously described [26–29]. Human leukemia cells were propagated by intravenous inoculation in female non-obese diabetic (NOD)/scid−/ − mice as described previously [30]. Female mice were used irrespective of the patient gender from which the original tumor was derived. All mice were maintained under barrier conditions and experiments were conducted using protocols and conditions approved by the institutional animal care and use committee of the appropriate consortium member. Ten mice (solid tumors) or eight mice (leukemias) were used in each control or treatment group. Tumor volumes (cm3) [solid tumor xenografts] or percentages of human CD45-positive [hCD45] cells [ALL xenografts] were determined as previously described [26] and responses were determined using three activity measures as previously described [26].
Determination of response
Responses were determined using three activity measures as previously described [26]. For individual mice, progressive disease (PD) was defined as < 50% regression from initial volume during the study period and > 25% increase in initial volume at the end of study period. Stable disease (SD) was defined as < 50% regression from initial volume during the study period and ≤ 25% increase in initial volume at the end of the study. Partial response (PR) was defined as a tumor volume regression ≥50% for at least one time point but with measurable tumor (≥ 0.10 cm3). Complete response (CR) was defined as a disappearance of measurable tumor mass (< 0.10 cm3) for at least one time point. A complete response was considered maintained (MCR) if the tumor volume was <0.10 cm3 at the end of the study period. For treatment groups only, if the tumor response was PD, then PD was further classified into PD1 or PD2 based on the tumor growth delay (TGD) value. TGD values were calculated based on the numbers of days to event. For each individual mouse that had PD and had an event in the treatment groups, a TGD value was calculated by dividing the time to event for that mouse by the median time to event in the respective control group. Median times to event were estimated based on the Kaplan-Meier event-free survival distribution. If a mouse had a TGD value ≤1.5, that mouse was considered PD1. If the TGD value was > 1.5, the mouse was considered PD2. Mice that had PD but did not have an event at the end of the study were coded as PD2.
Event-free survival
An event in the solid tumor xenograft models was defined as a quadrupling of tumor volume from the initial tumor volume. Event-free survival was defined as the time interval from initiation of study to the first event or to the end of the study period for tumors that did not quadruple in volume. The time to event was determined using interpolation based on the formula:
where tx is the interpolated day to event, t1 is the lower observation day bracketing the event, t2 is the upper observation day bracketing the event, V1 is the tumor volume on day t1 , V2 is the tumor volume on day t2 and Ve is the event threshold (4 times initial tumor volume for solid tumor xenografts).
Response and Event Definitions for Acute Lymphoblastic Leukemia (ALL) Xenograft Models
Individual mice were categorized as PD if their percentage of hCD45 cells never dropped below 1% and they had an event before the end of the study period. An event is defined as hCD45 cells above 25% in the peripheral blood with times to event calculated as above. Individual mice were classified as SD if their percentage of hCD45 cells never dropped below 1% and no event occurred before the end of the study. PR was assigned if the percentage of cells dropped below 1% for any one time point regardless of whether the percentage eventually reached 25%. A CR was assigned if the percentage of hCD45 cells dropped below 1% for 2 consecutive weeks of the study and regardless of whether the percentage reached 25% or not. A CR was considered maintained if the percentage of hCD45 was less than 1% for the last three measurements of the study. For treatment groups, PD was further classified into PD1 and PD2 according to the TGD value.
The time to event was determined using interpolation based on the formula:
where tx is the interpolated day to event, t1 is the lower observation day bracketing the event, t2 is the upper observation day bracketing the event, V1 is the hCD45 percentage on day t1, V2 is the tumor volume (or hCD45 percentage) on day t2 and Ve is the event threshold (25% for ALL xenografts).
Summary statistics and analysis methods
Overall Group Response
Each individual mouse was assigned a score from 0 to 10 based on their response: PD1=0, PD2=2, SD=4, PR=6, CR=8, and MCR=10, and the median for the group determined the overall response. Studies in which toxicity was greater than 25% or in which the control group was not at least SD, were considered inevaluable and were excluded from analysis. Treatment groups with PR, CR, or MCR are considered to have had an objective response. Agents inducing objective responses are considered highly active against the tested line, while agents inducing stable disease or PD2 are considered to have intermediate activity, and agents producing PD1 are considered to have a low level of activity against the tested line.
Tumor Volume T/C value
Relative tumor volumes (RTV) for control (C) and treatment (T) mice were calculated at day 21 or when all mice in the control and treated groups still had measurable tumor volumes (if less than 21 days). The mean relative tumor volumes for control and treatment mice for each study were then calculated and the T/C value was the mean RTV for the treatment group divided by the mean RTV for the control group. For the tumor volume T/C response measure, agents producing a T/C of ≤ 15% are considered highly active, those with a mean tumor volume T/C of ≤ 45% but > 15% are considered to have intermediate activity, and those with mean T/C values > 45% are considered to have low levels of activity [31].
EFS T/C value
An EFS T/C value was defined by the ratio of the median time to event of the treatment group and the median time to event of the respective control group. If the treatment group did not have a median time to event, then EFS T/C was defined as greater than the ratio of the last day of the study for the treatment group divided by the median time to event for the control group. For the EFS T/C measure, agents are considered highly active if they meet three criteria: a) an EFS T/C > 2; b) a significant difference in EFS distributions (p≤0.050), and c) a net reduction in median tumor volume for animals in the treated group at the end of treatment as compared to at treatment initiation. Agents meeting the first two criteria, but not having a net reduction in median tumor volume for treated animals at the end of the study are considered to have intermediate activity. Agents with an EFS T/C < 2 are considered to have low levels of activity. Xenografts in which the median EFS for the control line was greater than one-half of the study period or in which the median EFS for the control line did not exist are considered not evaluable for the EFS T/C measure of activity.
Statistical Methods
The exact log-rank test, as implemented using Proc StatXact for SASR, was used to compare event-free survival distributions between treatment and control groups. P-values were two-sided and were not adjusted for multiple comparisons given the exploratory nature of the studies.
Drugs and Formulation
GSK690693 was provided to the PPTP by Glaxo Smith Kline, through the Cancer Therapy Evaluation Program (NCI). GSK690693 was dissolved in 5% (w/v) mannitol in saline and administered once daily via intraperitoneal (IP) injection using a 5 days on 2 days off for 6 weeks schedule at 30 mg/kg. For secondary screening in ALL, an alternative formulation [5% (w/v) mannitol in acetate buffer] was used, and the drug was administered twice daily. GSK690693 was provided to each consortium investigator in coded vials for blinded testing.
Pharmacodynamic Studies
Blood glucose was determined over time using an AccuCheck glucometer (Roche). Phosphorylation of Akt, S6 and total proteins was determined by western blot analysis as previously described [13,32]. Primary antibodies used were against â-tubulin (Santa Cruz Biotechnology), ribosomal protein S6 (rpS6), phospho-rpS6 (Ser235/236), Akt, and phospho-Akt(Ser473) (Cell Signaling Technologies). Immunoreactive bands were visualized using SuperSignal Chemiluminescence substrate (Pierce) and Biomax MR and XAR film (Eastman Kodak Co.).
RESULTS
GSK690693 in Vitro Testing
GSK690693 demonstrated highly variable activity against the PPTP’s in vitro cell line panel. At one extreme were 5 cell lines having IC50 values greater than 10 μM (Table I), while at the other extreme were five cell lines with IC50 values of approximately 100 nM or lower and showing a high degree of cytotoxic effect as evidenced by an estimated 80% or greater decrease in viable cells from input after 96 hours exposure (Table I). The median IC50 for all PPTP cell lines was 1.2 μM, with the most sensitive being the T-cell ALL cell line COG-LL-317, which had an IC50 of 6.5 nM. The ALL panel showed the highest level of sensitivity (Figure 1A) with additional highly responsive cell lines including Kasumi-1 (an AML cell line with an ETO-AML1 translocation that is known to have a KIT activating point mutation [12]). For solid tumor cell lines the rhabdomyosarcoma cell line Rh41 was highly sensitive, (Figure 1B), whereas each of the neuroblastoma cell lines had an IC50 greater than 5 μM with three showing IC50 values exceeding 10 μM (Figure 1A). The profile of in vitro drug sensitivity of the resistant cell line NB-1643 is shown in Figure 1C.
Table I.
Activity of GSK690693 Against the PPTP in Vitro Panel
| CELL LINE | Histology | (T/C)Min%* | Relative I/O** | IC50 | Median IC50 Ratio |
|---|---|---|---|---|---|
| RD | Rhabdomyosarcoma | 61.2 | 0.57 | >1 x 10⁻⁵ | 0.1 |
| Rh41 | Rhabdomyosarcoma | 5.2 | −0.88 | 3.38x 10⁻⁸ | 36.1 |
| Rh18 | Rhabdomyosarcoma | 36.4 | −0.37 | 3.03 x 10⁻⁷ | 4.0 |
| Rh30 | Rhabdomyosarcoma | 39.7 | 0.26 | 4.81 x 10⁻⁶ | 0.3 |
| BT-12 | Rhabdoid | 71.5 | 0.65 | >1 x 10⁻⁵ | 0.1 |
| CHLA-266 | Rhabdoid | 32.9 | −0.22 | 1.22 x 10⁻⁶ | 1.0 |
| TC-71 | Ewing sarcoma | 16.5 | 0.13 | 2.52 x 10⁻⁶ | 0.5 |
| CHLA-9 | Ewing sarcoma | 27.3 | 0.00 | 5.91 x 10⁻⁷ | 2.1 |
| CHLA-10 | Ewing sarcoma | 16.3 | 0.05 | 1.02 x 10⁻⁷ | 12.0 |
| CHLA-258 | Ewing sarcoma | 24.1 | −0.49 | 1.05 x 10⁻⁶ | 1.2 |
| GBM2 | Ewing sarcoma | 45.7 | 0.28 | 9.15 x 10⁻⁶ | 0.1 |
| NB-1643 | Neuroblastoma | 26.8 | 0.19 | 5.40 x 10⁻⁶ | 0.2 |
| NB-Ebc1 | Neuroblastoma | 51.1 | 0.30 | >1 x 10⁻⁵ | 0.1 |
| CHLA-90 | Neuroblastoma | 66.2 | 0.50 | >1 x 10⁻⁵ | 0.1 |
| CHLA-136 | Neuroblastoma | 95.8 | 0.93 | >1 x 10⁻⁵ | 0.1 |
| NALM-6 | ALL | 12.5 | 0.07 | 2.65 x 10⁻⁷ | 4.6 |
| COG-LL-317 | ALL | 0.1 | −0.98 | 6.49 x 10⁻⁹ | 188.1 |
| RS4;11 | ALL | 0.7 | −0.96 | 1.47 x 10⁻⁷ | 8.3 |
| MOLT-4 | ALL | 1.4 | −0.92 | 4.00 x 10⁻⁸ | 30.5 |
| CCRF-CEM | ALL | 6.7 | −0.33 | 2.68 x 10⁻⁷ | 4.6 |
| Kasumi-1 | AML | 2.1 | −0.95 | 1.07 x 10⁻⁷ | 11.4 |
| Karpas-299 | ALCL | 15.5 | 0.06 | 2.93 x 10⁻⁶ | 0.4 |
| Ramos-RA1 | NHL | 35.1 | 0.33 | 7.35 x 10⁻⁶ | 0.2 |
(T/C)Min%= Lowest T/C value at any tested concentration of GSK690693;
Relatinve In/Out (I/O): For lines with T/CMin > input, equation is (T/CMin − input)/(100 – input). For lines with T/CMin < input, equation is (T/CMin − input)/(input). Relative I/O values close to 0 indicate cytostasis, close to 1 indicate no effect, and close to −1 indicate complete cytotoxicity.
Figure 1.
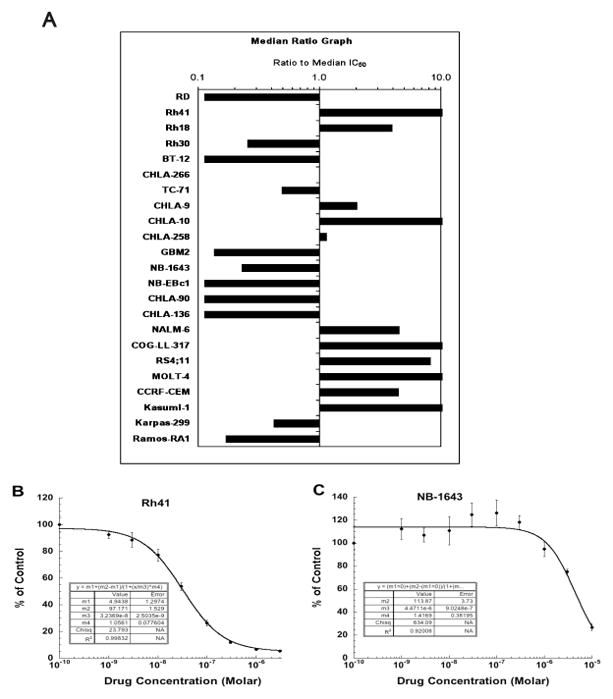
GSK690693 in vitro activity: (A) The median IC50 ratio graph shows the relative IC50 values for the cell lines of the PPTP panel. Each bar represents the ratio of the panel IC50 to the IC50 value of the indicated cell line. Bars to the right represent cell lines with higher sensitivity, while bars to the left indicate cell lines with lesser sensitivity. Representative dose response curves for Rh41 (B) and NB-1643 (C) cell lines.
Activity of GSK690693 Against the PPTP In Vivo Panel
Forty-two xenograft models were considered evaluable, with five xenografts excluded from reporting because of excessive toxicity. These five xenografts were from a cross section of panels, including the Wilms (KT-11), rhabdomyosarcoma, (Rh18), ependymoma (BT-36), and neuroblastoma (NB-SD and NB-1643) panels. Forty-six of 895 mice died during the study (5.1%), with 3 of 445 in the control arms (0.7%) and 43 of 450 in the GSK690693 treatment arms (9.6%). Complete details of testing are provided in Supplemental Table I, including total numbers of mice, number of mice that died (or were otherwise excluded), numbers of mice with events and average times to event, tumor growth delay, as well as numbers of responses and T/C values.
No objective responses were observed in any of the solid tumor panels, although GSK690693 induced significant differences in EFS distribution compared to controls in 12 of 34 evaluable solid tumor xenografts tested as shown in Table II. Significant differences in EFS distribution were observed for all 6 of the xenografts in the osteosarcoma panel and in one-half (2 of 4) of the xenografts from the glioblastoma panel. Significant differences in EFS distribution were also observed for xenografts in the rhabdomyosarcoma (1 of 6), neuroblastoma (1 of 4), rhabdoid (1 of 3) and ependymoma (1 of 1) panels. By contrast, none of the 8 evaluable ALL xenografts demonstrated significant differences in EFS distribution. Although there were significant differences in EFS distribution for selected solid tumor xenografts, the EFS T/C values were below the criteria for intermediate activity for the time to event measure of activity (EFS T/C > 2) in all but two evaluable lines: the rhabdoid tumor xenograft KT-12 and the osteosarcoma xenograft OS-33. Growth curves for these xenografts are shown in supplementary material (Figure 2).
Table II.
Activity for GSK690693 Against the PPTP in Vivo Panel
| Xenograft Line | Histology | P- value | EFS T/C | Median Final RTV | Tumor Volume T/C | P- value | T/C Activity | EFS Activity | Response Activity |
|---|---|---|---|---|---|---|---|---|---|
| BT-29 | Rhabdoid | 0.457 | 1 | >4 | 1.05 | 0.684 | Low | Low | Low |
| KT-14 | Rhabdoid | 0.24 | 1 | >4 | 0.78 | 0.315 | Low | Low | Low |
| KT-12 | Rhabdoid | 0.005 | > 3.8 | 3.4 | 0.65 | 0.077 | Low | Int | Int |
| KT-10 | Wilms | 0.265 | 1 | >4 | 0.93 | 0.684 | Low | Low | Low |
| KT-13 | Wilms | 0.924 | 1 | >4 | 0.95 | 0.971 | Low | Low | Low |
| SK-NEP-1 | Ewing | 0.819 | 0.9 | >4 | 1.05 | 0.497 | Low | Low | Low |
| EW5 | Ewing | 0.192 | 1.1 | >4 | 0.75 | 0.218 | Low | Low | Low |
| EW8 | Ewing | 0.123 | 1.6 | >4 | 0.76 | 0.035 | Low | Low | Int |
| TC-71 | Ewing | 0.183 | 0.8 | >4 | 1.29 | 0.156 | Low | Low | Low |
| CHLA258 | Ewing | 0.481 | 1 | >4 | 1.1 | 0.897 | Low | Low | Low |
| Rh10 | ALV RMS | 0.207 | 1.3 | >4 | 0.71 | 0.023 | Low | Low | Low |
| Rh28 | ALV RMS | <0.001 | 1.7 | >4 | 0.46 | <0.001 | Low | Low | Int |
| Rh30 | ALV RMS | 0.207 | 1.3 | >4 | 0.85 | 0.460 | Low | Low | Low |
| Rh30R | ALV RMS | 0.261 | 1 | >4 | 0.94 | 0.739 | Low | Low | Low |
| Rh41 | ALV RMS | 0.229 | 2 | >4 | 0.86 | 0.579 | Low | Low | Int |
| Rh65 | ALV RMS | 0.506 | 0.8 | >4 | 0.98 | 1.000 | Low | Low | Low |
| BT-28 | Medulloblastoma | 0.387 | 0.9 | >4 | 1.28 | 0.481 | Low | Low | Low |
| BT-45 | Medulloblastoma | 0.787 | 1.1 | >4 | 0.95 | 0.780 | Low | Low | Low |
| BT-50 | Medulloblastoma | 0.341 | > 1.0 | 3.6 | 1.01 | 0.631 | Low | NE | Int |
| BT-44 | Ependymoma | 0.049 | 1.5 | >4 | 0.71 | 0.011 | Low | Low | Low |
| GBM2 | Glioblastoma | 0.016 | 1.8 | >4 | 0.79 | 0.165 | Low | Low | Int |
| BT-39 | Glioblastoma | 0.237 | 1.1 | >4 | 0.94 | 0.218 | Low | Low | Low |
| D645 | Glioblastoma | <0.001 | 1.4 | >4 | 0.64 | 0.003 | Low | Low | Low |
| D456 | Glioblastoma | 0.077 | 1.2 | >4 | 0.84 | 0.089 | Low | Low | Low |
| NB-1771 | Neuroblastoma | <0.001 | 1.2 | >4 | 0.69 | 0.182 | Low | Low | Low |
| NB-1691 | Neuroblastoma | 0.672 | 1 | >4 | 1.18 | 0.815 | Low | Low | Low |
| NB-EBc1 | Neuroblastoma | 0.473 | 0.7 | >4 | 1.82 | 0.123 | Low | Low | Low |
| CHLA-79 | Neuroblastoma | 0.474 | 0.9 | >4 | 0.99 | 0.905 | Low | Low | Low |
| OS-1 | Osteosarcoma | <0.001 | > 1.4 | 2.8 | 0.65 | 0.015 | Low | NE | Int |
| OS-2 | Osteosarcoma | 0.006 | 1.5 | >4 | 0.6 | 0.002 | Low | Low | Low |
| OS-17 | Osteosarcoma | 0.028 | 1.3 | >4 | 0.71 | 0.029 | Low | Low | Low |
| OS-9 | Osteosarcoma | 0.014 | 1.4 | >4 | 0.68 | 0.011 | Low | Low | Low |
| OS-33 | Osteosarcoma | <0.001 | 2.7 | >4 | 0.21 | <0.001 | Int | Int | Int |
| OS-31 | Osteosarcoma | 0.002 | 1.2 | >4 | 0.82 | 0.002 | Low | Low | Low |
| ALL-2 | ALL B-precursor | 0.454 | 1.5 | >25 | . | Low | Int | ||
| ALL-3 | ALL B-precursor | 0.199 | 1.4 | >25 | . | Low | Low | ||
| ALL-4 | ALL B-precursor | 0.739 | 1.4 | >25 | . | Low | Low | ||
| ALL-7 | ALL B-precursor | 0.481 | 2.3 | >25 | . | Low | Int | ||
| ALL-8 | ALL T-cell | 0.935 | 1.2 | >25 | . | Low | Low | ||
| ALL-16 | ALL T-cell | 0.816 | 0.7 | >25 | . | Low | Low | ||
| ALL-17 | ALL B-precursor | 0.841 | 0.8 | >25 | . | Low | Low | ||
| ALL-19 | ALL B-precursor | 0.513 | 1.4 | >25 | . | Low | Low |
Figure 2.

Plots depicting tumor growth and survival of mice treated with GSK960693 versus controls. Median tumor volume over time (left) and Kaplan-Meier plot of EFS over time (right) for the xenografts OS-33 (A) and KT-12 (B). Gray lines indicate vehicle-treated control mice and black lines indicate GSK690693-treated mice.
For the tumor volume T/C activity measure, significant differences in tumor volume were observed for 11 xenografts, including all six xenografts in the osteosarcoma panel (Table II). Only one xenograft showed intermediate activity for this measure, the osteosarcoma xenograft OS-33 (T/C = 0.21). Of note, OS-33 was the only PPTP xenograft that also had a maintained complete response to rapamycin [33].
No objective responses were observed in any of the ALL models (Supplemental Figure 1). The best response was PD2 (progressive disease with growth delay), which was observed for two xenografts in the ALL panel, and eight xenografts in the solid tumor panel. The objective response measure results for both solid tumors and leukemia models are depicted in a ‘COMPARE’ format, based on the objective response scoring criteria centered around the midpoint score of 5 that represents stable disease (Figure 3).
Figure 3.

GSK690693 in vivo objective response activity: Left: The colored heat map depicts group response scores. A high level of activity is indicated by a score of 6 or more, intermediate activity by a score of ≥ 2 but < 6, and low activity by a score of < 2. Right: Representation of tumor sensitivity based on the difference of individual tumor lines from the midpoint response (stable disease). Bars to the right of the median represent lines that are more sensitive, and to the left are tumor models that are less sensitive. Red bars indicate lines with a significant difference in EFS distribution between treatment and control groups, while blue bars indicate lines for which the EFS distributions were not significantly different.
Secondary Testing of ALL Models
Taking into consideration the lack of efficacy of GSK690693 against the ALL xenograft panel reported above, an additional in vivo efficacy experiment was conducted using a different formulation of GSK690693 against ALL-19, since this xenograft exhibited the greatest degree of sensitivity of the entire ALL panel to the drug in vitro (data not shown). GSK690693 was prepared in 5% (w/v) mannitol-acetate buffer and administered by IP injection on a twice-daily schedule at 30 mg/kg. Mice engrafted with ALL-19 and treated with the new formulation of GSK690693 exhibited no leukemia delay and did not survive longer than untreated control mice (median survival of control mice 6.5 days compared with 5.5 days for GSK690693-treated mice, P=0.88). The median objective response measure for ALL-19 engrafted mice treated with the new formulation of GSK690693 was classified as progressive disease, which is identical to that obtained with the original formulation and administration schedule.
Pharmacodynamic Studies
The systemic on-target effects of GSK690693 following IP injection were assessed by blood glucose monitoring. GSK690693 was prepared in both the mannitol-saline and mannitol-acetate (containing no sodium chloride) solutions described above. Groups of three non-engrafted NOD/SCID mice were given IP injections of vehicle control, mannitol-saline or mannitol acetate formulations of GSK960693 and blood glucose levels were assessed over time. Blood glucose levels are reported to be at a basal level of 5.6 – 8.9 mM. Both formulations of GSK690693 increased blood glucose levels relative to the vehicle control (Figure 4). The mannitol-saline formulation induced a blood glucose peak of ~18 mM at 2 h after administration, which then decreased, whereas the mannitol-acetate formulation induced a comparable blood glucose peak of ~19 mM at 4 hours after administration.
Figure 4.
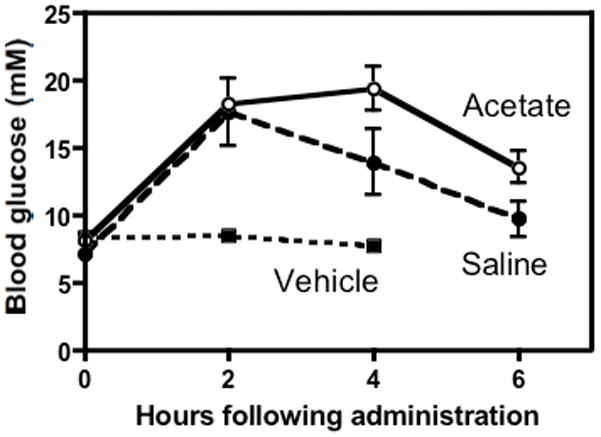
Blood glucose levels of NOD/SCID mice over time (n=3 per group) after a single injection of vehicle (back dashed line), 30 mg/kg GSK690693 in mannitol-saline (red line) or 30 mg/kg GSK690693 in mannitol-acetate (blue line).
Phosphorylation of Akt (Ser473) and phospho-S6 protein (Ser 235/6) was also examined in five osteosarcoma xenografts from mice treated with GSK690693. GSK690693 markedly increased the levels of Ser473 phosphorylation between 1 and 8 hours post administration of drug in all xenografts (Figure 5). However, by 24 hours the level of phospho-Akt had returned to baseline. In contrast there was relatively little effect of drug administration on S6 phosphorylation.
Figure 5.

Pharmacodynamic evaluation of Akt inhibition. Western blot analyses were performed as previously described with minor modifications [13]. Each lane represents an individual sample of the osteosarcoma xenograft identified above the lanes collected either prior to or at the specified times after treatment with GSK690693. β-tubulin was used as a loading control.
DISCUSSION
The results obtained in vitro with the cell line panel show heterogeneity of sensitivity, although IC50 values for only five of the cell lines were in the 100 nM range (or lower). There was a trend towards more effective cell kill in the ALL panel and more resistance among the neuroblastoma cell lines. These results are in contrast with those obtained in vivo, where only two xenograft lines achieved an intermediate level of activity and no objective responses were obtained. Further, two ALL xenografts showed very limited sensitivity to GSK690693, when tested in vitro with IC50 values >10 μM (data not shown). It is possible, therefore, that the cell lines tested in vitro had become growth factor independent (for instance PTEN deficient) and as a consequence dependent to the PI3K-PTEN-Akt pathway, and more sensitive to its inhibition. Alternatively, we speculate that compensatory kinase activity present in the in vivo setting, but not in vitro, could explain these results. The GSK690693 results are consistent with the observation that pharmacological targeting of single kinases frequently results in limited efficacy (reviewed in [34]), although this does not imply that the in vivo therapeutic window will be increased by simultaneously targeting multiple signaling pathways.
One implication of the pattern of induction of pAktSer473 observed following treatment with GSK690693 is that it may reflect a homeostatic mechanism that could reduce the antitumor effect of GSK690693 when used as a single agent. A second observation is that the time course of Akt phosphorylation (and downstream blood glucose levels) with the return to baseline by 24 hours suggests that an alternative dosing schedule may show greater activity as a single agent. However, when we tested the efficacy of this drug on a twice daily schedule against the xenograft ALL-19 no significant improvement in efficacy was achieved.
There are some similarities between the in vitro and in vivo responses of the PPTP’s preclinical models to GSK690693 and to rapamycin. Within several tumor panels, xenografts that showed the greatest response to rapamycin also tended to show the greatest response to GSK690693. For example, the OS-33 xenograft, which had the clearest in vivo response to GSK690693, was one of the most responsive xenografts to rapamycin [33]. However, the in vivo responses to rapamycin exceeded those observed for GSK690693, both for the solid tumor panels and for the ALL panel [33].
Rapid induction of pAktSer473 has been described following exposure to small molecule AKT inhibitors [35,36]. This induction of pAktSer473 occurs within minutes of exposure and is more rapid than the induction of phosphorylation that occurs following mTOR inhibition [35]. Phosphorylation at Ser473 requires continued PI3K and mTORC2 activity, but unlike rapalog-induced pAktSer473 does not appear to involve the mTORC1-S6K1 pathway that regulates IRS-1 stability [35]. Further evaluation is required to define the precise mechanism for this extremely rapid induction of pAktSer473 following AKT inhibition. However, because of the known activation of AKT as a consequence of mTOR inhibition, combining rapamycin with GSK690693 treatment could result in significant synergy. For example, combination of an Akt inhibitor with rapamycin completely suppressed hypoxia-induced increases in VEGF whereas single agents were less effective [32].
Given the activities observed in vitro for GSK690693 against ALL cell lines and those previously reported [22], the efficacy of the agent in vivo against the ALL xenografts is disappointing. There is no obvious explanation for the discrepant results between in vitro and in vivo testing for the ALL panels but these results reinforce the need for caution when extrapolating activities from in vitro testing on cell lines. Akt has been reported as a particularly relevant target in T-ALL [5,37] but we did not observe significant efficacy against the two T-lineage xenografts tested in vivo. The lack of activity observed for the ALL xenografts in vivo points to the difficult challenges that lay ahead of drug development efforts directed towards drugable kinase targets. However, whether the limited activity of this Akt inhibitor is intrinsic to this molecule, or representative of other inhibitors of this target remains to be tested.
In summary, the Akt inhibitor GSK690693 showed limited activity against the PPTP’s in vivo xenograft panels. For the solid tumor panels, the most consistent antitumor effects were noted for the osteosarcoma panel, although the magnitude of these effects was relatively small. The xenograft that showed the greatest response to GSK690693 (OS-33) had stable disease for several weeks prior to progression. This xenograft is the only osteosarcoma xenograft of the PPTP panel that has very low IGF-1R expression, and achieved a complete response to rapamycin as single agent [33]. Overall, these results indicate that the use of GSK690693 as a single agent in the treatment of pediatric malignancies is likely to be of limited value without additional optimization.
Supplementary Material
Figure S1. Plots depicting ALL engraftment and survival of mice treated with GSK960693 versus controls: hCD45 of individual NOD/SCID mice over time (left) and Kaplan-Meier plots of EFS over time (right) for the xenografts ALL-2 (A, B), ALL-3 (C, D), ALL-4 (E, F) and ALL-7 (G, H). Dotted black lines indicate vehicle-treated control mice and red lines indicate GSK690693-treated mice.
Acknowledgments
This work was supported by NO1-CM-42216, CA21765, and CA108786 from the National Cancer Institute and used MLN8237 supplied by Millennium Pharmaceuticals, Inc. In addition to the authors this study represents work contributed by the following: Sherry Ansher, Catherine A. Billups, Ingrid Boehm, Joshua Courtright, Mila Dolotin, Edward Favours, Henry S. Friedman, Debbie Payne-Turner, Charles Stopford, Chandra Tucker, Amy E. Watkins, Joe Zeidner, Ellen Zhang, and Jian Zhang. Children’s Cancer Institute Australia for Medical Research is affiliated with the University of New South Wales and Sydney Children’s Hospital.
Footnotes
Conflict of interest statement: The authors consider that there are no actual or perceived conflicts of interest.
References
- 1.Brazil DP, Hemmings BA. Ten years of protein kinase B signalling: a hard Akt to follow. Trends in Biochemical Sciences. 2001;26(11):657–664. doi: 10.1016/s0968-0004(01)01958-2. [DOI] [PubMed] [Google Scholar]
- 2.Manning BD, Cantley LC. AKT/PKB Signaling: Navigating Downstream. Cell. 2007;129(7):1261–1274. doi: 10.1016/j.cell.2007.06.009. [DOI] [PMC free article] [PubMed] [Google Scholar]
- 3.Bellacosa A, Kumar CC, Cristofano AD, et al. Advances in Cancer Research. Vol. 94. Academic Press; 2005. Activation of AKT Kinases in Cancer: Implications for Therapeutic Targeting; pp. 29–86. [DOI] [PubMed] [Google Scholar]
- 4.Osaki M, Oshimura M, Ito H. PI3K-Akt pathway: Its functions and alterations in human cancer. Apoptosis. 2004;9(6):667–676. doi: 10.1023/B:APPT.0000045801.15585.dd. [DOI] [PubMed] [Google Scholar]
- 5.Silva A, Yunes JAs, Cardoso BA, et al. PTEN posttranslational inactivation and hyperactivation of the PI3K/Akt pathway sustain primary T cell leukemia viability. The Journal of Clinical Investigation. 2008;118(11):3762–3774. doi: 10.1172/JCI34616. [DOI] [PMC free article] [PubMed] [Google Scholar]
- 6.Wendel H-G, Stanchina Ed, Fridman JS, et al. Survival signalling by Akt and eIF4E in oncogenesis and cancer therapy. Nature. 2004;428(6980):332–337. doi: 10.1038/nature02369. [DOI] [PubMed] [Google Scholar]
- 7.Kim D, Dan HC, Park S, et al. AKT/PKB signaling mechanisms in cancer and chemoresistance. Front Biosci. 2005;10:975–987. doi: 10.2741/1592. [DOI] [PubMed] [Google Scholar]
- 8.Liu P, Cheng H, Roberts TM, et al. Targeting the phosphoinositide 3-kinase pathway in cancer. Nat Rev Drug Discov. 2009;8(8):627–644. doi: 10.1038/nrd2926. [DOI] [PMC free article] [PubMed] [Google Scholar]
- 9.Powis G, Ihle N, Kirkpatrick DL. Practicalities of Drugging the Phosphatidylinositol-3-Kinase/Akt Cell Survival Signaling Pathway. Clinical Cancer Research. 2006;12(10):2964–2966. doi: 10.1158/1078-0432.CCR-06-0617. [DOI] [PubMed] [Google Scholar]
- 10.Yang J, Cron P, Thompson V, et al. Molecular Mechanism for the Regulation of Protein Kinase B/Akt by Hydrophobic Motif Phosphorylation. Molecular Cell. 2002;9(6):1227–1240. doi: 10.1016/s1097-2765(02)00550-6. [DOI] [PubMed] [Google Scholar]
- 11.Li J, Simpson L, Takahashi M, et al. The PTEN/MMAC1 Tumor Suppressor Induces Cell Death That Is Rescued by the AKT/Protein Kinase B Oncogene. Cancer Res. 1998;58(24):5667–5672. [PubMed] [Google Scholar]
- 12.Opel D, Poremba C, Simon T, et al. Activation of Akt Predicts Poor Outcome in Neuroblastoma. Cancer Res. 2007;67(2):735–745. doi: 10.1158/0008-5472.CAN-06-2201. [DOI] [PubMed] [Google Scholar]
- 13.Petricoin EF, III, Espina V, Araujo RP, et al. Phosphoprotein Pathway Mapping: Akt/Mammalian Target of Rapamycin Activation Is Negatively Associated with Childhood Rhabdomyosarcoma Survival. Cancer Res. 2007;67(7):3431–3440. doi: 10.1158/0008-5472.CAN-06-1344. [DOI] [PubMed] [Google Scholar]
- 14.Scotlandi K, Manara MC, Nicoletti G, et al. Antitumor Activity of the Insulin-Like Growth Factor-I Receptor Kinase Inhibitor NVP-AEW541 in Musculoskeletal Tumors. Cancer Res. 2005;65(9):3868–3876. doi: 10.1158/0008-5472.CAN-04-3192. [DOI] [PubMed] [Google Scholar]
- 15.Kim B, van Golen CM, Feldman EL. Insulin-Like Growth Factor I Induces Preferential Degradation of Insulin Receptor Substrate-2 through the Phosphatidylinositol 3-Kinase Pathway in Human Neuroblastoma Cells. Endocrinology. 2005;146(12):5350–5357. doi: 10.1210/en.2005-0356. [DOI] [PubMed] [Google Scholar]
- 16.Schwab TS, Madison BB, Grauman AR, et al. Insulin-like growth factor-I induces the phosphorylation and nuclear exclusion of forkhead transcription factors in human neuroblastoma cells. Apoptosis. 2005;10(4):831–840. doi: 10.1007/s10495-005-0429-y. [DOI] [PubMed] [Google Scholar]
- 17.Ho R, Eggert A, Hishiki T, et al. Resistance to Chemotherapy Mediated by TrkB in Neuroblastomas. Cancer Res. 2002;62(22):6462–6466. [PubMed] [Google Scholar]
- 18.Jaboin J, Kim CJ, Kaplan DR, et al. Brain-derived Neurotrophic Factor Activation of TrkB Protects Neuroblastoma Cells from Chemotherapy-induced Apoptosis via Phosphatidylinositol 3'-Kinase Pathway. Cancer Res. 2002;62(22):6756–6763. [PubMed] [Google Scholar]
- 19.Li Z, Jaboin J, Dennis PA, et al. Genetic and Pharmacologic Identification of Akt as a Mediator of Brain-Derived Neurotrophic Factor/TrkB Rescue of Neuroblastoma Cells from Chemotherapy-Induced Cell Death. Cancer Res. 2005;65(6):2070–2075. doi: 10.1158/0008-5472.CAN-04-3606. [DOI] [PubMed] [Google Scholar]
- 20.Witzig TE, Kaufmann SH. Inhibition of the phosphatidylinositol 3-kinase/mammalian target of rapamycin pathway in hematologic malignancies. Curr Treat Options Oncol. 2006;7(4):285–294. doi: 10.1007/s11864-006-0038-1. [DOI] [PubMed] [Google Scholar]
- 21.Rhodes N, Heerding DA, Duckett DR, et al. Characterization of an Akt Kinase Inhibitor with Potent Pharmacodynamic and Antitumor Activity. Cancer Res. 2008;68(7):2366–2374. doi: 10.1158/0008-5472.CAN-07-5783. [DOI] [PubMed] [Google Scholar]
- 22.Levy DS, Kahana JA, Kumar R. AKT inhibitor, GSK690693, induces growth inhibition and apoptosis in acute lymphoblastic leukemia cell lines. Blood. 2009;113(8):1723–1729. doi: 10.1182/blood-2008-02-137737. [DOI] [PubMed] [Google Scholar]
- 23.Altomare DA, Zhang L, Deng J, et al. GSK690693 Delays Tumor Onset and Progression in Genetically Defined Mouse Models Expressing Activated Akt. Clinical Cancer Research. 16(2):486–496. doi: 10.1158/1078-0432.CCR-09-1026. [DOI] [PMC free article] [PubMed] [Google Scholar]
- 24.Lo Russo P, Hurwitz H, Chiorean E. AKT inhibitor GSK690693: preliminary results from the first time in human study. Proc 99th Annu Meet Am Assoc Cancer Res. 2008:abstract LB-68. [Google Scholar]
- 25.Keshelava N, Frgala T, Krejsa J, et al. DIMSCAN: a microcomputer fluorescence-based cytotoxicity assay for preclinical testing of combination chemotherapy. Methods Mol Med. 2005;110:139–153. doi: 10.1385/1-59259-869-2:139. [DOI] [PubMed] [Google Scholar]
- 26.Houghton PJ, Morton CL, Tucker C, et al. The Pediatric Preclinical Testing Program: description of models and early testing results. Pediatr Blood Cancer. 2007;49(7):928–940. doi: 10.1002/pbc.21078. [DOI] [PubMed] [Google Scholar]
- 27.Friedman HS, Colvin OM, Skapek SX, et al. Experimental chemotherapy of human medulloblastoma cell lines and transplantable xenografts with bifunctional alkylating agents. Cancer Res. 1988;48(15):4189–4195. [PubMed] [Google Scholar]
- 28.Graham C, Tucker C, Creech J, et al. Evaluation of the antitumor efficacy, pharmacokinetics, and pharmacodynamics of the histone deacetylase inhibitor depsipeptide in childhood cancer models in vivo. Clin Cancer Res. 2006;12(1):223–234. doi: 10.1158/1078-0432.CCR-05-1225. [DOI] [PubMed] [Google Scholar]
- 29.Peterson JK, Tucker C, Favours E, et al. In vivo evaluation of ixabepilone (BMS247550), a novel epothilone B derivative, against pediatric cancer models. Clin Cancer Res. 2005;11(19 Pt 1):6950–6958. doi: 10.1158/1078-0432.CCR-05-0740. [DOI] [PubMed] [Google Scholar]
- 30.Liem NL, Papa RA, Milross CG, et al. Characterization of childhood acute lymphoblastic leukemia xenograft models for the preclinical evaluation of new therapies. Blood. 2004;103(10):3905–3914. doi: 10.1182/blood-2003-08-2911. [DOI] [PubMed] [Google Scholar]
- 31.Plowman JCR, Alley M, Sausville E, Schepartz S. US-NCI testing procedures. In: Feibig HHBA, editor. Relevance of tumor models for anticancer drug development. Basel: Karger; 1999. pp. 121–135. [Google Scholar]
- 32.Kurmasheva RT, Harwood FC, Houghton PJ. Differential regulation of vascular endothelial growth factor by Akt and mammalian target of rapamycin inhibitors in cell lines derived from childhood solid tumors. Mol Cancer Ther. 2007;6(5):1620–1628. doi: 10.1158/1535-7163.MCT-06-0646. [DOI] [PubMed] [Google Scholar]
- 33.Houghton PJ, Morton CL, Kolb EA, et al. Initial testing (stage 1) of the mTOR inhibitor rapamycin by the pediatric preclinical testing program. Pediatr Blood Cancer. 2008;50(4):799–805. doi: 10.1002/pbc.21296. [DOI] [PubMed] [Google Scholar]
- 34.Knight ZA, Lin H, Shokat KM. Targeting the cancer kinome through polypharmacology. Nat Rev Cancer. 2010;10(2):130–137. doi: 10.1038/nrc2787. [DOI] [PMC free article] [PubMed] [Google Scholar]
- 35.Han EK, Leverson JD, McGonigal T, et al. Akt inhibitor A-443654 induces rapid Akt Ser-473 phosphorylation independent of mTORC1 inhibition. Oncogene. 2007;26(38):5655–5661. doi: 10.1038/sj.onc.1210343. [DOI] [PubMed] [Google Scholar]
- 36.Luo Y, Shoemaker AR, Liu X, et al. Potent and selective inhibitors of Akt kinases slow the progress of tumors in vivo. Mol Cancer Ther. 2005;4(6):977–986. doi: 10.1158/1535-7163.MCT-05-0005. [DOI] [PubMed] [Google Scholar]
- 37.Gutierrez A, Sanda T, Grebliunaite R, et al. High frequency of PTEN, PI3K, and AKT abnormalities in T-cell acute lymphoblastic leukemia. Blood. 2009;114(3):647–650. doi: 10.1182/blood-2009-02-206722. [DOI] [PMC free article] [PubMed] [Google Scholar]
Associated Data
This section collects any data citations, data availability statements, or supplementary materials included in this article.
Supplementary Materials
Figure S1. Plots depicting ALL engraftment and survival of mice treated with GSK960693 versus controls: hCD45 of individual NOD/SCID mice over time (left) and Kaplan-Meier plots of EFS over time (right) for the xenografts ALL-2 (A, B), ALL-3 (C, D), ALL-4 (E, F) and ALL-7 (G, H). Dotted black lines indicate vehicle-treated control mice and red lines indicate GSK690693-treated mice.