

Abstract
Arterial spin labeling (ASL) provides noninvasive measurement of tissue blood flow, but sensitivity to motion has limited its application to imaging of myocardial blood flow (MBF). While different cardiac phases can be synchronized using ECG triggering, breath holding is generally required to minimize effects of respiratory motion during ASL scanning, which may be challenging in clinical populations. Here a free-breathing myocardial ASL technique with the potential for reliable clinical application is presented, by combining ASL with a navigator-gated, ECG-triggered TrueFISP readout sequence. Dynamic myocardial perfusion signals were measured at multiple delay times that allowed simultaneous fitting of MBF and arterial transit time (ATT). With the assist of a non-rigid motion correction program, the estimated mean MBF was 1.00±0.55mL/g/min with a mean transit time of approximately 400ms. The intraclass correlation coefficient of repeated scans was 0.89 with a mean within subject coefficient of variation (wsCV) of 22%. Perfusion response during mild to moderate stress was further measured. The capability for non-invasive, free-breathing assessment of MBF using ASL may offer an alternative approach to first-pass perfusion MRI for clinical evaluation of patients with coronary artery disease.
Keywords: Myocardial blood flow (MBF), Navigator-echo, Free-breathing, Non-rigid motion correction, Arterial spin labeling (ASL)
Introduction
Myocardial blood flow (MBF) or myocardial perfusion is an important index of ischemic heart disease. Clinical assessment of myocardial perfusion is routinely performed using positron emission tomography (PET) or single photon emission computed tomography (SPECT) (1). Both techniques are expensive and involve radiation exposure. First-pass perfusion MRI permits rapid measurement of MBF (2). However, the method requires gadolinium-based contrast agent which cannot be used in renal failure patients, and has limited repeatability. As a noninvasive and repeatable technique, arterial spin labeling (ASL) has recently been applied for assessing myocardial perfusion in both animal and human studies (3–5). ASL MBF measurement has been validated against the microsphere technique and first-pass perfusion imaging in rats (6, 7). Notably, ASL has shown promise in its application to humans with coronary artery disease (CAD) (8).
Existing ASL myocardial perfusion methods, nevertheless, have several limitations when adapted to clinical settings. ASL perfusion MRI relies on pairwise subtraction between images acquired with and without spin labeling, and is therefore highly sensitive to motion. While different cardiac phases can be synchronized using electrocardiography (ECG) triggering, breath holding is generally required to minimize effects of respiratory motion, which may be challenging for patients with CAD. Misregistration of images acquired during multiple breath holds due to variations of heart rate, breath-holding position, and/or patient motion is another potential source of error. Most studies have also employed turbo-FLASH with a low flip angle as the imaging sequence for quantifying ASL effects, resulting in a relatively low signal-to-noise ratio (SNR). Limited by these factors, myocardial ASL measurements were rarely carried out with multiple delay times that allow estimation of arterial transit time for accurate perfusion quantification.
A free-breathing myocardial ASL perfusion imaging sequence with adequate SNR and reliability is desirable for clinical evaluation of patients with CAD. Over the past several years, TrueFISP has emerged as the optimal pulse sequence for cardiovascular imaging due to its high imaging efficiency and the high T2/T1 ratio of the blood pool signal (9). In particular, a navigator-gated, ECG-triggered TrueFISP sequence has been developed to simultaneously synchronize respiratory and cardiac motion with cardiac imaging when the subject is breathing normally. The feasibility for such a free-breathing cardiac imaging technique has recently been demonstrated for coronary artery imaging (10, 11) and first-pass perfusion MRI (12). In addition, non-rigid image registration algorithms have been developed to further enhance the performance of free-breathing cardiac imaging, as manifested by reduced variance of edge positions (13, 14).
In the present study, a free-breathing myocardial ASL technique was developed with the potential for reliable clinical application, by combining ASL with a navigator-gated, ECG-triggered TrueFISP readout sequence. The dynamic curve of myocardial perfusion signals at multiple delay times was measured that allowed simultaneous estimation of MBF and arterial transit time. Repeated scans were further carried out in conjunction with a mild to moderate stress task to assess the reliability and sensitivity of the free-breathing myocardial ASL technique.
Methods
Pulse Sequence
This study was approved by Institutional Review Board and was Health Insurance Portability and AccountabilityAct compliant. Written informed consent was obtained from all subjects prior to the MR examination. Eleven healthy subjects (age 23–57yrs, mean=38.9yrs, 10 males) participated in this study on a Siemens 1.5T MR system (MAGNETOM Espree, Erlangen, Germany). As shown in Fig. 1 of the pulse sequence diagram, ASL is combined with a navigator-gated, ECG-triggered TrueFISP readout sequence. The flow-sensitive alternating inversion recovery (FAIR) technique (15) was implemented for spin tagging using alternating slice-selective and non-selective hyperbolic secant (HS) inversion pulses. A saturation pulse was applied prior to labeling pulses to minimize signal difference from potential heart rate variation. The navigator-echo was applied right before the TrueFISP readout. Central k-space lines were acquired at a delay time (TI) after the labeling pulse. The navigator-echo was formed by a spin-echo “pencil-beam” placed on the right diaphragm (along the foot-head direction) that allowed image readout during the end-expiration phase. The TrueFISP readout was preceded by a train of 10 dummy RF pulses with Kaiser Bessel window ramp flip angles (i.e. α/11, −2α/11, 3α/11 … −10α/21) to minimize transient signal oscillations (16). Image acquisition was carried out in cardiac phase with minimal motion (typically during mid-diastole) derived from four-chamber cine images. The trigger delay (TD) time between the ECG R-wave and the saturation pulse was set for each specific TI to synchronize image acquisition to the cardiac phase with minimal motion. In other words, only image acquisitions performed during the mid-diastolic cardiac phase as well as the end-expiration respiratory phase were prospectively accepted.
Figure 1.

Pulse sequence diagram of free-breathing myocardial ASL which combines ASL (FAIR in this study) with a navigator-gated, ECG-triggered TrueFISP readout sequence. Selective and nonselective inversion pulses are used for label and control acquisitions respectively. A saturation pulse is applied prior to labeling pulses to minimize the variations in heart beat. Navigator-echo is placed on the diaphragm that allows image readout during the end-expiration phase. Image acquisition is always during the mid-diastole cardiac phase.
MRI Scanning
Asingle slice of 8mm thickness along the short axis of the left ventricle (LV) was imaged 32 times (16 pair label/control) for a single TI. In each of the 11 subjects, myocardial ASL scans were performed at 4 or 5 TIs between 200 and 1700ms. The scan with 900ms TI was then repeated in 9 subjects to test its reliability. In 4 healthy subjects, the ASL scan with 900ms TI was also performed during mild to moderate stress, which was induced by squeezing foamy stress balls using both hands at approximately 0.5Hz. The scan time for a single TI was approximately 5min with approximately 50% navigator acceptance. Imaging parameters were: FOV=30cm, matrix=116×128, 3 segments, TR/TE=4/2 ms, flip angle=70°, 6/8 partial Fourier, rate-2 GRAPPA (Generalized auto-calibrating partially parallel acquisition). The selective inversion and saturation pulses were 3–4cm thick to avoid potential displacement of the imaging slice between label and readout. Residual motion was further corrected using a non-rigid motion correction (MoCo) program implemented as part of the inline image reconstruction (17). This intensity-based MoCo program maximized the local cross-correlation between the reference and target images through diffeomorphic regularization. The process was implemented in a multi-scale approach from coarse to fine resolution to improve the speed and robustness, and the images were warped using a sub-pixel spline interpolation. The cross-correlation is robust to linear variations in intensity that may change from region to region (18). Diffeomorphic mapping guarantees that the topology of the heart does not change under deformation, that is, the boundaries between the myocardium and ventricles is preserved on a global and voxel level. At the same time, diffeomorphic mapping is flexible enough to capture the fine details of shape change that occur during the cardiac cycle.
Data Analysis
During off-line post-processing, control and label images (both with and without non-rigid MoCo) were pair-wise subtracted and averaged using custom IDL (RSI, Boulder, CO, USA) software. Spikes (due to severe motion etc.) in the difference image series were identified as greater than 2 standard deviations (SD) from the mean and were excluded. The mean difference signals (dM) were measured from 3 hand-drawn regions-of-interest (ROIs): myocardium (4.7±0.5 cm3), ventricle blood pool (2.4±0.4 cm3) and a homogeneous background region in skeletal muscle (4.2±1.2 cm3). The dynamic myocardial dM signals at multiple TIs were simultaneously fitted for MBF and arterial transit time (ATT) in each subject based on the following kinetic model (19):
where Q is MBF, R1a (0.83s−1) and R1 are the longitudinal relaxation rate of blood and myocardium at 1.5T respectively, δR=R1 − R1a, M0 is the equalibium magnetization of myocardium, λ is the blood/tissue water partition coefficient (0.92ml/g), τ is ATT. In our experiment, M0 and R1 of myocardium were fitted from experimental data at multiple TIs according to a standard saturation recovery model.
The series of dM images acquired with 4 or 5 delay times in individual subjects were further aligned using the Advanced Normalization Tools (ANTS: http://www.picsl.upenn.edu/ANTS) software. An unbiased diffeomorphic average template representation of the time series was created for each subject (18). This average representation captures the expected shape and appearance over the whole time series and serves as a reference space to which each time point image is mapped, as described for the brain in (18). For each mapping, ANTS utilized a cross-correlation-based symmetric diffeomorphic transformation between the average template and the target time series images (20), similar to the non-rigid MoCo program. In addition, ANTS uses symmetric normalization which removes dependence on choice of reference or target image. ANTS also guarantees the mappings are invertible within the discrete domain. This extra regularization bounds the compression and expansion that exists in the derived mappings. Maps of myocardial ATT and MBF were obtained by fitting both parameters on a pixel-by-pixel basis in the myocardium ROI. For pixels that the iterative fitting algorithm failed to converge (approximately 5%), that pixel was replaced by the average value of surrounding pixels (“filling the hole”).
Statistical Analysis
Statistical analysis was performed using the STATA10.0 software (College Station, TX, USA). Test-retest repeatability of the measurements at the TI of 900ms was estimated using within-subject coefficient of variance (wsCV) and intraclass correlation coefficient (ICC). MBF measurements at baseline and during the stress test were compared using the nonparametric Wilcoxon signed rank test.
Results
Figure 2 displays the slice selective (SS) and nonselective (NS) TrueFISP images, difference perfusion weighted images (dM) acquired at 5 delays from a representative subject. As can be seen, all 5 images were acquired during similar mid-diastole cardiac phase despite a TI span from 200 to 1700ms. With prospective navigator-gating and ECG triggering, myocardium signals appear relatively uniform in dM images acquired both with and without motion correction. At prolonged delay times (1300–1700ms), the label and image acquisition were separated by more than a cardiac cycle, causing increased ghosting artifacts in dM images. Nevertheless, subtraction errors indicated by bright and dark bands (arrows) were to a certain degree suppressed when non-rigid MoCo was applied (bottom row of Fig. 2). The average dM signals of myocardium perfusion, ventricle blood and background muscle are displayed in Fig. 3. The dM signals were expressed as the fraction of the equilibrium myocardium signal (M0) fitted with the multi-delay data. As can be seen, the mean myocardial dM/M0 signal had a transit delay of approximately 400ms and peaked around 900–1300ms, whereas the blood pool signal peaked earlier (500–900ms). Without non-rigid MoCo, the measured myocardial perfusion signals showed elevation at long delays (1300–1700ms) compared to data processed with the non-rigid MoCo program.
Figure 2.

Slice selective (SS) and nonselective (NS) TrueFISP images, and difference perfusion weight images (PWI or dM) of a representative subject with 5 delays, ROIs of myocardium and ventricle blood are shown. The 3rd and 4th rows show PWIs acquired without and with non-rigid MoCo respectively. Arrows indicate bright and dark bands likely caused by subtraction errors due to motion.
Figure 3.

Mean fractional difference perfusion signal (dM/M0) measured in myocardium (with and without non-rigid MoCo respectively), in background muscle (A) and in ventricle blood (B), error bars indicate standard error of the mean (SEM). Note the relatively large error bar for 200ms TI was because data were collected only from 3 subjects.
Quantitative model fitting was performed in each subject. With non-rigid MoCo, the average fitted MBF was 1.00±0.55 mL/g/min (mean±SD), and the mean ATT was 363±111 ms. Without MoCo, the average fitted MBF was 1.42±0.74 mL/100g/min, and the mean ATT was 404±179 ms. As shown in Fig. 4, model fitting using Eq. [1] was relatively successful in each subject (r=0.84±0.17 and 0.81±0.18 for data acquired without and with MoCo respectively).
Figure 4.
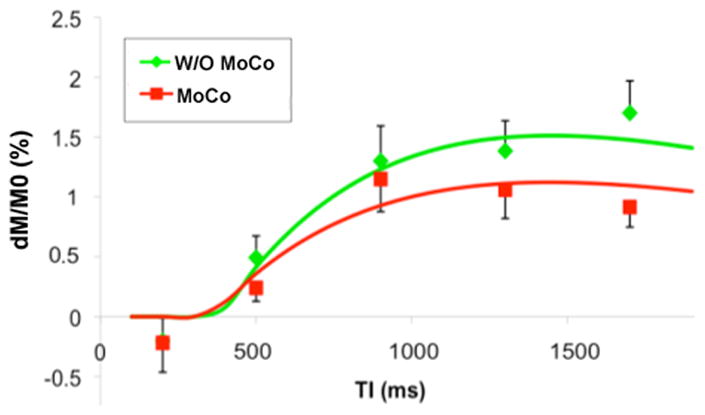
Model fitting results of myocardial perfusion data acquired with (r=0.94) and without non-rigid MoCo (r=0.98), error bars indicate standard error of the mean (SEM).
Test-retest results of repeated myocardial ASL scans with the TI of 900ms in 8 subjects are displayed in Fig. 5. One subject was excluded due to severe motion during the repeated scan (the dM/M0 signal in background was 2% while it was <0.2% in the rest scans). The results showed good (ICC=0.61) and excellent (ICC=0.89) reliability when data were processed without and with the non-rigid MoCo program respectively. The wsCV was 26.2% and 21.8% for data acquired without and with non-rigid MoCo respectively. The data suggest that non-rigid MoCo improved the reliability of mean MBF measurements. The fractional perfusion signals (dM/M0) at baseline and during mild to moderate stress in 4 subjects are listed in Table 2. Without non-rigid MoCo, dM/M0 increased 84% during stress (p=0.034 1-tailed Wilcoxon signed rank test) while the dM/M0 signal acquired with MoCo increased 62% (p=0.072) during stress.
Figure 5.
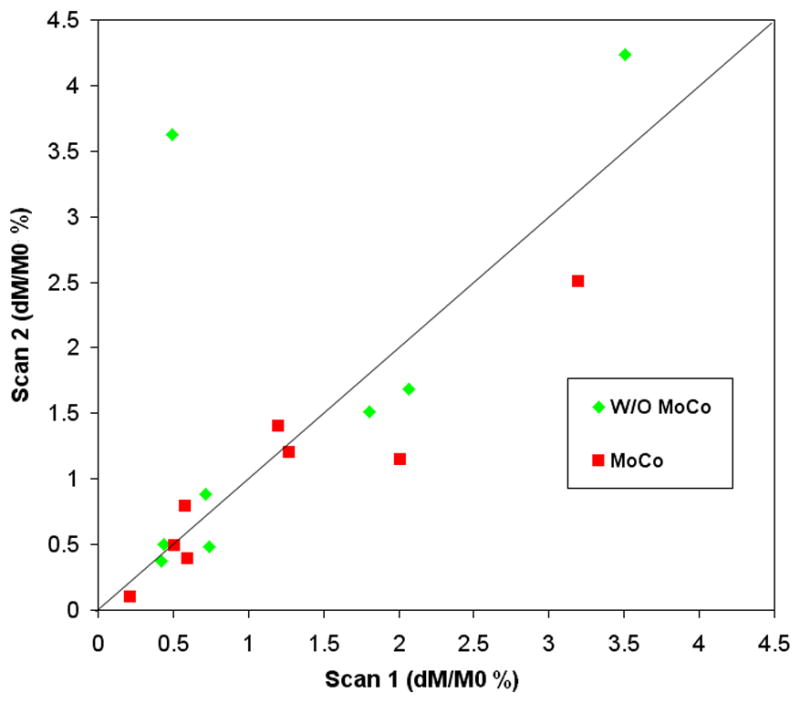
Scatter plot of test-retest results using repeated myocardial ASL scans at the TI of 900ms in 8 subjects.
Table 2.
Mean MBF values at rest and during mild to moderate stress in 4 healthy subjects.
| Subject | Rest | Stress | Rest | Stress |
|---|---|---|---|---|
| Age gender | dM/M0 (%) with MoCo | dM/M0 (%) W/O MoCo | ||
| 32 M | 1.81 | 2.10 | 1.27 | 1.58 |
| 44 M | 0.72 | 0.74 | 0.58 | 0.43 |
| 32 M | 2.06 | 5.59 | 2.01 | 4.11 |
| 48 M | 0.42 | 0.76 | 0.22 | 0.44 |
| Average | 1.25 | 2.30** | 1.02 | 1.64* |
| SD | 0.80 | 2.29 | 0.79 | 1.73 |
p = 0.034 1-tailed Wilcoxon signed rank test
p = 0.072
Sample images of myocardial ATT and MBF of a representative subject are shown in Fig. 6. Color scale ATT and MBF maps are overlaid upon the dM images that were aligned using symmetric diffeomorphic transformation. In this subject, the fitted mean ATT and MBF were 352±114ms and 1.18±0.62 mL/g/min within the myocardial ROI, respectively.
Figure 6.

Myocardial ATT and MBF maps of a representative subject (same as Fig. 2) by pixel-by-pixel fitting using data collected at 5 delay times (200–1700ms). The 5 delay dM images were aligned using the Advanced Normalization Tools software (ANTS).
Discussion
By combining pulsed ASL with a navigator-gated and ECG-triggered TrueFISP readout sequence, a free-breathing myocardial ASL technique was developed with the potential for reliable myocardial perfusion imaging under clinical settings. The measured dynamic curve of labeled blood signal showed an ATT of approximately 400ms in the myocardium, which to date has not been reported in literature. ATT is a critical parameter for accurate perfusion quantification using ASL. Past myocardial ASL studies have generally adopted a T1 mapping approach in which arterial transit effects were ignored (3–5, 8). As a result, MBF may be severely underestimated (e.g. 50–60% for a typical TI of 1s and ATT of 400ms). To this point of view, our study provided the first reference for the normal physiological range of ATT in myocardium, and for the use of appropriate delay time to minimize potential arterial transit effects.
PET (using 13N-ammonia or H215O as tracer) is considered the gold standard for human myocardial perfusion analysis. Reported resting MBF values in healthy adults include 0.95±0.28 (mean±SD) (21), 0.985±0.230 (22) and 0.84 ± 0.25 mL/g/min (23). Using first-pass perfusion MRI, Hsu, et al. (24) found resting MBF in healthy human subjects to be 1.02 ± 0.22 mL/g/min. Past myocardial ASL studies using breath hold reported normal perfusion values to be 0.990 ± 0.302 mL/g/min at 1.5 T, 1.058 ± 0.187 and 1.36 ± 0.40 mL/g/min at 3.0T (4, 25). Our MBF data (1.00±0.55 with MoCo and 1.42±0.74 mL/g/min without MoCo) are comparable to data obtained with PET, first-pass perfusion MRI and breath hold myocardial ASL. The test-retest repeatability (wsCV) of the free-breathing myocardial ASL technique is also comparable to that of PET scanning (wsCV=27%, (22)). In particular, the mean MBF values obtained with non-rigid MoCo match more favorably with reported values in literature than those obtained without MoCo. This result, in conjunction with improved reliability, suggests that the non-rigid MoCo program may improve both the accuracy and precision of ASL MBF measurement. As shown in Fig. 3, the MoCo program was mainly effective for prolonged delays (1300–1700ms) where the label and readout were separated by more than a cardiac cycle and were susceptible to motion artifacts.
Non-rigid registration of free-breathing cardiac images is a recent trend to improve the SNR and reliability of cardiovascular MRI (13). This technique can be applied on full FOV without user interaction, and can be carried out in conjunction with navigator-echo to reduce image variability across cardiac cycles. The drawback of non-rigid registration may include errors caused by potential through-plane motion. Nevertheless, through-plane motion is relatively small along the short axis of LV especially with prospective slice tracking or navigator techniques (RMS error of 0.6±0.4 mm for a 8mm slice according to ref(12)). Another potential error is the difference of image intensities between label and control acquisitions especially inside the ventricles, causing potential “bleeding” of labeled ventricle signal into myocardium. In the present study, this problem was constrained by the global cost function – which is locally adaptive to intensity changes – and the smoothness and invertibility of the deformation field which maintains anatomical boundaries across the time series. The measured MBF values in post MoCo images did not suggest “bleeding” of labeled ventricle signals. By aligning the multi-delay dM images using diffeomorphic registration, the feasibility for quantitative mapping of ATT and MBF on a pixel-by-pixel basis in individual subjects was further demonstrated, although there were still considerable variabilities across pixels within the myocardial ROI. It is worth noting that symmetric diffeomorphic registration has been rated in the top rank by a recent study evaluating 14 nonlinear deformation algorithms for brain registration (26). Initially developed for elastic brain registration, diffeomorphic and other deformable registration algorithms possess great potential for cardiac and body organ imaging. The free-breathing myocardial ASL technique can also be adapted for perfusion imaging of other body organs such as the kidney and liver.
MBF increase during mild stress induced by isometric handgrip (at 40% of maximum voluntary contraction (MVC)) has been reported to be roughly 35% (27). In the present study, the observed fractional perfusion signal changes (62% and 84% with and without MoCo) during hand squeezing task were larger than 35%. This discrepancy may be attributed to different task intensities between isometric handgrip at 40% MVC and the hand squeezing task at 0.5Hz employed in the present study. In addition, the fractional perfusion signal change would overestimate MBF change if the potential effect of shortened ATT were not taken into account. Assuming a reduction of ATT from approximately 400ms to 200ms during stress, the corrected MBF increase would be 44% and 56% with and without non-rigid MoCo in the present study, respectively. While reasonably matching literature values, this result again highlights the importance for incorporating ATT in the quantification of myocardial perfusion.
The present study has several limitations. MRI scans were performed at 1.5T with segmented acquisition. Further developments include implementation of free-breathing myocardial ASL at high magnetic fields (3T) to take advantage of prolonged blood T1. Parallel imaging with higher acceleration factors in conjunction with high density receiver arrays may be applied to allow single shot acquisitions to improve the temporal stability and reduce scan time. With improved imaging speed, 3D myocardial perfusion scan may become feasible which is essential for clinical application. Finally, further studies need to be carried out using animal models as well as clinical populations for rigorous validation of quantitative MBF and ATT measurements as well as the accuracy of non-rigid cardiac image registration algorithms.
Conclusion
In the present study, the feasibility for free-breathing myocardial perfusion imaging using ASL was demonstrated. Such capability may offer an alternative approach to contrast based first-pass perfusion MRI for clinical evaluation of patients with CAD.
Table 1.
Estimated myocardium T1, ATT and MBF values from multidelay data in 11 healthy subjects with and without non-rigid MoCo respectively.
| Subject | T1 (ms) | ATT (ms) | MBF (mL/g/min) | ATT (ms) | MBF (mL/g/min) |
|---|---|---|---|---|---|
| Age Gender | With MoCo | W/O MoCo | |||
| 46 M | 980 | 475 | 0.37 | 818 | 0.61 |
| 27 M | 1296 | 339 | 1.20 | 370 | 1.46 |
| 36 M | 928 | 229 | 1.13 | 354 | 1.16 |
| 57 M | 923 | 500 | 0.73 | 245 | 0.63 |
| 31 M | 921 | 475 | 1.50 | 500 | 1.83 |
| 48 M | 797 | 338 | 1.87 | 210 | 1.49 |
| 36 F | 1059 | 284 | 0.39 | 605 | 2.71 |
| 32 M | 896 | 264 | 0.30 | 385 | 0.93 |
| 44 M | 931 | 207 | 1.68 | 257 | 2.61 |
| 32 M | 817 | 372 | 0.63 | 301 | 0.63 |
| 48 M | 938 | 505 | 1.22 | 394 | 1.53 |
| Average | 954 | 363 | 1.00 | 404 | 1.42 |
| SD | 134 | 111 | 0.55 | 179 | 0.74 |
Acknowledgments
This work was supported by a C2P project between Siemens Healthcare and University of Pennsylvania. This work was also supported by NIH grants MH080892, RR002305, and an American Recovery and Reinvestment Act grant MH080892-S1. Dr. Detre is one of the inventors of ASL, and has received royalties of the patent.
References
- 1.Heller GV, Calnon D, Dorbala S. Recent advances in cardiac PET and PET/CT myocardial perfusion imaging. J Nucl Cardiol. 2009;16(6):962–969. doi: 10.1007/s12350-009-9142-5. [DOI] [PubMed] [Google Scholar]
- 2.Gerber BL, Raman SV, Nayak K, Epstein FH, Ferreira P, Axel L, Kraitchman DL. Myocardial first-pass perfusion cardiovascular magnetic resonance: history, theory, and current state of the art. J Cardiovasc Magn Reson. 2008;10(1):18. doi: 10.1186/1532-429X-10-18. [DOI] [PMC free article] [PubMed] [Google Scholar]
- 3.Zhang H, Shea SM, Park V, Li D, Woodard PK, Gropler RJ, Zheng J. Accurate myocardial T1 measurements: toward quantification of myocardial blood flow with arterial spin labeling. Magn Reson Med. 2005;53(5):1135–1142. doi: 10.1002/mrm.20461. [DOI] [PubMed] [Google Scholar]
- 4.Northrup BE, McCommis KS, Zhang H, Ray S, Woodard PK, Gropler RJ, Zheng J. Resting myocardial perfusion quantification with CMR arterial spin labeling at 1.5 T and 3.0 T. J Cardiovasc Magn Reson. 2008;10(1):53. doi: 10.1186/1532-429X-10-53. [DOI] [PMC free article] [PubMed] [Google Scholar]
- 5.McCommis KS, Zhang H, Herrero P, Gropler RJ, Zheng J. Feasibility study of myocardial perfusion and oxygenation by noncontrast MRI: comparison with PET study in a canine model. Magn Reson Imaging. 2008;26(1):11–19. doi: 10.1016/j.mri.2007.04.009. [DOI] [PMC free article] [PubMed] [Google Scholar]
- 6.Waller C, Kahler E, Hiller KH, Hu K, Nahrendorf M, Voll S, Haase A, Ertl G, Bauer WR. Myocardial perfusion and intracapillary blood volume in rats at rest and with coronary dilatation: MR imaging in vivo with use of a spin-labeling technique. Radiology. 2000;215(1):189–197. doi: 10.1148/radiology.215.1.r00ap07189. [DOI] [PubMed] [Google Scholar]
- 7.Waller C, Hiller KH, Kahler E, Hu K, Nahrendorf M, Voll S, Haase A, Ertl G, Bauer WR. Serial magnetic resonance imaging of microvascular remodeling in the infarcted rat heart. Circulation. 2001;103(11):1564–1569. doi: 10.1161/01.cir.103.11.1564. [DOI] [PubMed] [Google Scholar]
- 8.Wacker CM, Fidler F, Dueren C, Hirn S, Jakob PM, Ertl G, Haase A, Bauer WR. Quantitative assessment of myocardial perfusion with a spin-labeling technique: preliminary results in patients with coronary artery disease. J Magn Reson Imaging. 2003;18(5):555–560. doi: 10.1002/jmri.10386. [DOI] [PubMed] [Google Scholar]
- 9.Fuchs F, Laub G, Othomo K. TrueFISP--technical considerations and cardiovascular applications. Eur J Radiol. 2003;46(1):28–32. doi: 10.1016/s0720-048x(02)00330-3. [DOI] [PubMed] [Google Scholar]
- 10.Spuentrup E, Bornert P, Botnar RM, Groen JP, Manning WJ, Stuber M. Navigator-gated free-breathing three-dimensional balanced fast field echo (TrueFISP) coronary magnetic resonance angiography. Invest Radiol. 2002;37(11):637–642. doi: 10.1097/00004424-200211000-00008. [DOI] [PubMed] [Google Scholar]
- 11.Yang Q, Li K, Liu X, Bi X, Liu Z, An J, Zhang A, Jerecic R, Li D. Contrast-enhanced whole-heart coronary magnetic resonance angiography at 3.0-T: a comparative study with X-ray angiography in a single center. J Am Coll Cardiol. 2009;54(1):69–76. doi: 10.1016/j.jacc.2009.03.016. [DOI] [PMC free article] [PubMed] [Google Scholar]
- 12.Pedersen H, Kelle S, Ringgaard S, Schnackenburg B, Nagel E, Nehrke K, Kim WY. Quantification of myocardial perfusion using free-breathing MRI and prospective slice tracking. Magn Reson Med. 2009;61(3):734–8. doi: 10.1002/mrm.21880. [DOI] [PubMed] [Google Scholar]
- 13.Ledesma-Carbayo MJ, Kellman P, Hsu LY, Arai AE, McVeigh ER. Motion corrected free-breathing delayed-enhancement imaging of myocardial infarction using nonrigid registration. J Magn Reson Imaging. 2007;26(1):184–190. doi: 10.1002/jmri.20957. [DOI] [PubMed] [Google Scholar]
- 14.Kellman P, Larson AC, Hsu LY, Chung YC, Simonetti OP, McVeigh ER, Arai AE. Motion-corrected free-breathing delayed enhancement imaging of myocardial infarction. Magn Reson Med. 2005;53(1):194–200. doi: 10.1002/mrm.20333. [DOI] [PMC free article] [PubMed] [Google Scholar]
- 15.Kim SG. Quantification of relative cerebral blood flow change by flow-sensitive alternating inversion recovery (FAIR) technique: application to functional mapping. Magn Reson Med. 1995;34:293–301. doi: 10.1002/mrm.1910340303. [DOI] [PubMed] [Google Scholar]
- 16.Le Roux P. Simplified model and stabilization of SSFP sequences. J Magn Reson. 2003;163(1):23–37. doi: 10.1016/s1090-7807(03)00115-0. [DOI] [PubMed] [Google Scholar]
- 17.Chefd’hotel C, Hermosillo G, Faugeras O. Proceedings of the IEEE International Symposium on Biomedical Imaging (ISBI’2002); 2002. Washington, D.C.: 2002. Flows of Diffeomorphisms for Multimodal Image Registration. [Google Scholar]
- 18.Avants BB, Yushkevich P, Pluta J, Minkoff D, Korczykowski M, Detre J, Gee JC. The optimal template effect in hippocampus studies of diseased populations. Neuroimage. 2010;49:2457–2466. doi: 10.1016/j.neuroimage.2009.09.062. [DOI] [PMC free article] [PubMed] [Google Scholar]
- 19.Wang J, Alsop DC, Li L, Listerud J, Gonzalez-At JB, Schnall MD, Detre JA. Comparison of quantitative perfusion imaging using arterial spin labeling at 1.5 and 4.0. Tesla Magn Reson Med. 2002;48(2):242–254. doi: 10.1002/mrm.10211. [DOI] [PubMed] [Google Scholar]
- 20.Avants BB, Epstein CL, Grossman M, Gee JC. Symmetric diffeomorphic image registration with cross-correlation: evaluating automated labeling of elderly and neurodegenerative brain. Med Image Anal. 2008;12(1):26–41. doi: 10.1016/j.media.2007.06.004. [DOI] [PMC free article] [PubMed] [Google Scholar]
- 21.Rahimtoola SH. Hibernating myocardium has reduced blood flow at rest that increases with low-dose dobutamine. Circulation. 1996;94(12):3055–3061. doi: 10.1161/01.cir.94.12.3055. [DOI] [PubMed] [Google Scholar]
- 22.Chareonthaitawee P, Kaufmann PA, Rimoldi O, Camici PG. Heterogeneity of resting and hyperemic myocardial blood flow in healthy humans. Cardiovasc Res. 2001;50(1):151–161. doi: 10.1016/s0008-6363(01)00202-4. [DOI] [PubMed] [Google Scholar]
- 23.Schepis T, Gaemperli O, Treyer V, Valenta I, Burger C, Koepfli P, Namdar M, Adachi I, Alkadhi H, Kaufmann PA. Absolute quantification of myocardial blood flow with 13N-ammonia and 3-dimensional PET. J Nucl Med. 2007;48(11):1783–1789. doi: 10.2967/jnumed.107.044099. [DOI] [PubMed] [Google Scholar]
- 24.Hsu LY, Rhoads KL, Holly JE, Kellman P, Aletras AH, Arai AE. Quantitative myocardial perfusion analysis with a dual-bolus contrast-enhanced first-pass MRI technique in humans. J Magn Reson Imaging. 2006;23(3):315–322. doi: 10.1002/jmri.20502. [DOI] [PubMed] [Google Scholar]
- 25.Zun Z, Wong EC, Nayak KS. Assessment of myocardial blood flow (MBF) in humans using arterial spin labeling (ASL): feasibility and noise analysis. Magn Reson Med. 2009;62(4):975–983. doi: 10.1002/mrm.22088. [DOI] [PubMed] [Google Scholar]
- 26.Klein A, Andersson J, Ardekani BA, Ashburner J, Avants B, Chiang MC, Christensen GE, Collins DL, Gee J, Hellier P, Song JH, Jenkinson M, Lepage C, Rueckert D, Thompson P, Vercauteren T, Woods RP, Mann JJ, Parsey RV. Evaluation of nonlinear deformation algorithms applied to human brain MRI registration. Neuroimage. 2009;46(3):786–802. doi: 10.1016/j.neuroimage.2008.12.037. [DOI] [PMC free article] [PubMed] [Google Scholar]
- 27.Lowe DK, Rothbaum DA, McHenry PL, Corya BC, Knoebel SB. Myocardial blood flow response to isometric (handgrip) and treadmill exercise in coronary artery disease. Circulation. 1975;51(1):126–131. doi: 10.1161/01.cir.51.1.126. [DOI] [PubMed] [Google Scholar]