

Abstract
The movements of BKCa channels were investigated in live cells using quantum dots (QDs). The extracellular N-terminus was metabolically tagged with biotin, labeled with streptavidin-conjugated QDs and then monitored using real-time time-lapse imaging in COS-7 cells and cultured neurons. By tracking hundreds of channels, we were able to determine the characteristics of channel movements quantitatively. Channels in COS-7 cells exhibited a confined diffusion in an area of 1.915 μm2, with an initial diffusion coefficient of 0.033 μm2/s. In neurons, the channel movements were more heterogeneous and highly dependent on subcellular location. While the channels in soma diffused slowly without clear confinement, axodendritic channels showed more rapid and pseudo-one-dimensional movements. Intriguingly, the channel movement in somata was drastically increased by the neuronal β4 subunit, in contrast to the channels in the axodendritic area where the mobility were significantly decreased. Thus, our results demonstrate that the membrane mobility of BKCa channels can be greatly influenced by the expression system used, subunit composition, and subcellular location. This QD-based, single-molecule tracking technique can be utilized to investigate the cellular mechanisms that determine the mobility as well as the localization of various membrane proteins in live cells.
Introduction
Large-conductance Ca2+-activated K+ channels (BKCa channels, also known as BK or Maxi-K channels) are a family of potassium-selective ion channels that are activated synergistically by membrane depolarization and increased intracellular Ca2+ (1–3). These channels are expressed in many tissues and involved in various physiological processes, including neuronal excitability, neurotransmitter release, contraction of smooth muscles, frequency tuning of hair cells, and immunity (4–7). Functional BKCa channels are assembled as homotetramers of the pore-forming α-subunit, called Slowpoke (Slo, KCa1.1, or KCNMA1), or heterooctamers of α- and auxiliary β-subunits (8,9). The α-subunit contains seven transmembrane domains in its amino terminus responsible for voltage sensing and the selective permeation of K+ ions (10). The calcium-dependent activation of the channel is mediated by the large cytoplasmic domain at its carboxyl terminus (11). Four different types of β-subunits, β1–4 (or KCNMB1–4), are expressed differentially in various tissues (12) and they are known to regulate channel sensitivity to Ca2+ and voltage by coassembling with the α-subunit (13).
BKCa channels are widely expressed throughout the nervous system. The α-subunit, or Slo protein, was detected immunohistochemically in various regions and subregions of the murine brains. In the mouse hippocampal formation, for instance, BKCa channels were observed in several different substructures including the hippocampus proper, dentate gyrus, and subiculum (14). These channels are found in both axons and somatodendritic regions of various central neurons including hippocampal pyramidal neurons (15–17). BKCa channels accumulate in presynaptic regions and are involved in spike repolarization and the regulation of transmitter release (18). At the somatodendritic level, postsynaptic BKCa channels have been implicated in the modulation of action potential shape and frequency (16,19). Although BKCa channel are involved in diverse physiological and pathophysiological processes that may in part be dictated by their cellular and subcellular distribution (20), no reports to date have examined the movement of the channels in specific neurons either in tissue or in cultured conditions. It has been extremely difficult to label the channels specifically and to trace the protein molecules individually. The fluorescent proteins, for instance, were not suited for long-term imaging of single BKCa channels due to the weak emission and photoinstability. However, recent progress in quantum dot technology has allowed individual proteins to be labeled within cells and their motion followed in real time (21).
Quantum dots (QDs), also known as nanocrystals, are a special class of semiconductors ranging from 2 to 10 nanometers in diameter and composed of periodic groups of II–VI, III–V, or IV–VI materials. The small size, long-term photostability, and narrow emission spectra of QDs have many advantages in fluorescence imaging. Their specific colors, which vary by size, and remarkable resistance to photobleaching make QDs well suited for tracking single molecules in live-cell imaging and dynamics studies (21,22). Moreover, many different bioconjugated QDs, in which nanocrystals are modified with various functional biomolecules such as streptavidin, are now available for direct binding of the QDs to targets of interest (23).
In this study, we visualized single BKCa channels in live neurons by specific labeling with QDs and monitored their movements. By quantitatively analyzing the time-lapse images of QD-labeled channels, we were able to determine the factors influencing the dynamics of BKCa channels expressed in cultured neurons.
Materials and Methods
Expression of BKCa channels and labeling with quantum dots
The α-subunit of the rat BKCa channel, or rSlo (GenBank accession No. AF135265), was tagged with the acceptor peptide at its N-terminus for biotin labeling (24) and with or without a red fluorescent protein (RFP) at its C-terminus for fluorescence imaging. A truncation mutant of rSlo (rSlo-ΔC) was constructed to delete 102 amino acids from Phe1109 to the C-terminus based on a previous report (25). These modified rSlo cDNAs were subcloned into a mammalian expression vector, pcDNA3.1 (+) (Invitrogen, Carlsbad, CA). The rat β4 subunit, or rβ4 (GenBank accession No. AY028605), was tagged with enhanced green fluorescent protein at its C-terminus. All experiments were performed either on COS-7, African green monkey kidney fibroblast cells, or cultured rat primary hippocampal neurons.
For transient expression, cells were plated onto 18-mm coverslips (Marienfeld, Lauda-Königshofen, Germany) coated with 0.05 mg/mL poly-D-lysine (Sigma-Aldrich, St. Louis, MO). The plasmid harboring rSlo cDNA was cotransfected with a plasmid harboring pDisplay BirA-ER, the gene for Escherichia coli biotin ligase modified to be retained in the ER, at a 2:1 ratio into COS-7 cells using a commercial reagent, Polyfect (Qiagen, Valencia, CA), and at a 3:1 ratio into primary cultured hippocampal neurons at DIV5 using calcium-phosphate precipitation. The rSlo and rβ4 genes were cotransfected at a 1:5 molar ratio according to a previously published method (26). Seventy-two hours after transfection, cells on coverslips were washed carefully with phosphate-buffered saline (PBS) and incubated with 0.5 nM streptavidin-conjugated QD605 (Invitrogen) in PBS for 10 min at room temperature. Cells were then carefully washed with PBS three times.
Electrophysiological recordings and data analysis
All macroscopic current recordings were performed using the gigaOhm-seal patch-clamp method in an inside-out configuration. Patch pipettes were fabricated from borosilicate glass (WPI, Sarasota, FL) and fire-polished to a resistance of 4–5 MΩ. The channel currents were amplified using an Axopatch 200B amplifier (Axon Instruments, Foster City, CA), low-pass filtered at 1 or 2 kHz using a four-pole Bessel filter, and digitized using a Digidata 1200A apparatus (Axon Instruments). The macroscopic currents of expressed channels were activated by voltage-clamp pulses delivered from a holding potential of –100 mV to reach membrane potentials ranging from –80 to +200 mV in 10-mV increments. The pipette and extracellular solutions contained the following components, unless otherwise specified: 116 mM KOH, 4 mM KCl, 10 mM HEPES, and 5 mM EGTA at pH 7.2.
To determine the precise free concentration of intracellular Ca2+ ([Ca2+]i), the appropriate amount of total Ca2+ to be added to the intracellular solution was calculated using MaxChelator software (27) (http://www.standford.edu/∼cpatton/maxc.html). The pH was adjusted to 7.2 with 2-(n-morpholino)ethanesulfonic acid. In order to compare channel characteristics accurately, an identical set of intracellular solutions was used throughout the experiments. Commercial software packages, which included Clampex 8.0 (Axon Instruments) and Origin 6.1 (OriginLab, Northampton, MA), were used for acquisition and analysis of macroscopic recording data. All data are presented as mean ± SE, where n indicates the number of independent experiments.
Fluorescence microscopy and live-cell imaging
COS-7 cells and rat primary hippocampal neurons were kept in PBS throughout imaging. Cells were observed with an inverted microscope (Olympus IX-51; Olympus, Tokyo, Japan) connected to a charge-coupled device camera (Andor, Belfast, Northern Island) using a 60× objective oil lens and QD605 filters (SemRock, Rochester, NY). The images were captured using commercial software, MetaMorph (Universal Imaging, Downingtown, PA). The time-lapse images were collected at room temperature at 300-ms time intervals over for 15 s. For photoblinking experiments, images were acquired at room temperature at 50-ms time intervals over 50 s using the stream recording mode. The seven movies in the Supporting Material were made with stack files using MetaMorph and edited with Sony Vegas Pro 9.0 (Sony Creative Software, Madison, WI).
Analysis of channel dynamics
All images were analyzed using MetaMorph software. Images of BKCa channels labeled with QD605 were converted into stack movie files, and changes in the X-Y coordinates of dots were tracked over time using imaging software. Mean square displacement (MSD) values were obtained over 50 sequential frames, or every 300 ms, and plotted against time. MSD values of individual dots are defined by the equation
where xi and yi are positions on frame i, x1 and y1 are positions on the first frame, N is the total number of frames, Δt is the time between frames and distance between steps in time t, and nΔt is the time interval over which the MSD is calculated. The initial diffusion coefficient, Dinit, was obtained by fitting the initial slope of each MSD curve in the first 1.0 s of the plot (28) using the equation
When change in MSD is fitted versus time, a linear plot of MSD indicates random Brownian movement. A nonlinear plot of change in MSD over time reflects confined diffusion or directed diffusion. A decreasing slope indicates confined diffusion, while an increasing slope indicates directed diffusion.
For vector plots, the relative angle of movement and the distance between one position and the next were measured along the axodendritic axis. The origin of each vector in the plot was defined as the final position of the moving dot in the previous frame. The orientation of each vector was normalized at the origin to the direction of the axodendritic process in which the dot was moving and the direction toward the soma was set at 0°.
Results
Specific labeling of BKCa channels using quantum dots in live cells
To visualize individual BKCa channels in live cells, the α-subunit of the rat BKCa channel (rSlo) was modified in two ways. First, the extracellular N-terminus of rSlo was tagged with a 15-amino-acid sequence (GLNDIFEAQKIEWHE), called acceptor peptide (AP) (Fig. 1 A). Originating from the biotin carboxyl carrier protein subunit of bacterial acetyl-CoA carboxylase, the lysine residue (K, underlined) in this peptide can be effectively biotinylated by E. coli biotin ligase, BirA (29). Second, the C-terminal end of rSlo was fused with the red fluorescent protein (RFP) of a marine anemone, Discosoma striata, allowing transfected cells expressing the modified rSlo channels, AP-rSlo-RFP, to be visually discerned under a fluorescent microscope. To biotinylate the channel proteins metabolically within cells, AP-rSlo-RFP was coexpressed with a modified E. coli biotin ligase, BirA-ER (24). This biotin ligase contains KDEL, an ER retention sequence, at its C-terminal end and resides within the ER lumen (30). Thus, the lysine residue of N-terminal AP can be biotinylated within the ER lumen by BirA-ER. Upon localization to the plasma membrane, these biotin-conjugated BKCa channels expose their N-terminal biotins extracellularly and can be labeled with streptavidin-conjugated QDs (24).
Figure 1.

Specific labeling of functional BKCa channels expressed in COS-7 cells using QDs. (A) Schematic illustration of the rat BKCa channel α-subunit (or rSlo) used in this experiment. An acceptor peptide (AP) was tagged at the N-terminus of rSlo, and red fluorescent protein (RFP) was tagged at the C-terminus. (B) Specific labeling of AP-rSlo-RFP channels using QDs. COS-7 cells were transfected with BirA-ER and RFP (first row), AP-rSlo-RFP (second row), or AP-rSlo-RFP with BirA-ER (third row). In the fourth row, magnified views (3×) of the highlighted regions in the third row are shown. In the case of BirA-ER shown in the first row, a plasmid harboring RFP (pTag-RFP-C1; Evrogen, Moscow, Russia) was cotransfected in order to visualize the transfectants. Cells were labeled with streptavidin-conjugated QD605 (Invitrogen). Cells expressing either RFP or AP-rSlo-RFP are red (left column) and QD605 is blue (center column). Merged images are also shown (right column). Scale bar, 10 μm. (C) Electrophysiological characterization of rSlo, AP-rSlo-RFP, and QD-labeled AP-rSlo-RFP channels (QD:AP-rSlo-RFP). Representative current traces of rSlo, AP-rSlo-RFP, and QD-labeled AP-rSlo-RFP channels (QD:AP-rSlo-RFP) are shown. Ionic currents were evoked with 100-ms voltage steps from the holding potential of –100 mV to test potentials of 20, 50, and 80 mV. Intracellular Ca2+ concentration was buffered at 10 μM. The response of untransfected HEK293 cells to voltage pulses is also shown as a control.
The specificity of QD labeling of the modified BKCa channel expressed in COS-7 cells was initially evaluated. As shown in Fig. 1 B, COS-7 cells cotransfected with AP-rSlo-RFP and BirA-ER were heavily labeled by streptavidin-conjugated QDs (Fig. 1 B, third row). Moreover, individual fluorescent spots of QD-labeled rSlo channel were clearly discernable for tracking in live cells (Fig. 1 B, third row and enlarged picture shown in fourth row). In contrast, no significant labeling of QDs was observed in the cells transfected with BirA-ER together with RFP (first row) or AP-rSlo-RFP alone (second row), showing that the biotin ligases targeted into the ER lumen recognized the AP tag of AP-rSlo-RFP and specifically biotinylated the channel proteins. The C-terminal fusion of RFP did not seem to affect the surface expression of rSlo channels or their labeling by QDs significantly, because the level of QD labeling observed in cells cotransfected triply with AP-rSlo, free RFP, and BirA-ER was comparable to that of the cells cotransfected with AP-rSlo-RFP and BirA-ER (first and second rows in Fig. S1 in the Supporting Material). However, no specific QD labeling of cells cotransfected with an rSlo deletion mutant lacking the last 102 amino acids of the C-terminus (AP-rSlo-ΔC), free RFP, or BirA-ER was observed (third row in Fig. S1), consistent with a previous report showing that this region, which contains a putative actin-binding domain, was critical for the surface expression of Slo channels (25).
The functional activity of AP-rSlo-RFP channels was then examined before and after labeling with QDs (Fig. 1 C). The AP-rSlo-RFP channels were expressed robustly in COS-7 cells and activated by membrane voltages and intracellular Ca2+. It was evident, however, that the modifications at the N- and C-termini significantly altered the gating characteristics of the channel (Fig. S2). Compared with wild-type Slo, the half-activation voltage (V1/2) of AP-rSlo-RFP channels was shifted 30 mV toward the negative direction and the deactivation rate was decreased by 55% at 80 mV in the presence of 10 μM intracellular Ca2+. QD labeling was also found to affect the function of AP-rSlo-RFP channels. Upon addition of QDs, the V1/2 value of AP-rSlo-RFP channels shifted 44 mV toward the positive direction. Moreover, the QD-labeled AP-rSlo-RFP (QD:AP-rSlo-RFP) exhibited rapid deactivation, e.g., a 4.6-fold increase at 80 mV compared to AP-rSlo-RFP, and the deactivation rates in the positive voltage range were not significantly voltage-dependent.
Thus, these results indicated that the modified BKCa channel α-subunit, the AP-rSlo-RFP channel, was robustly expressed in COS-7 cells and could be labeled specifically with QDs as a Ca2+ and voltage-activated channel.
Stoichiometry of quantum-dot labeled BKCa channels
We wondered how many QDs actually contributed to the individual fluorescence spots observed in the images shown in Fig. 1. To estimate the stoichiometry of QDs, time-dependent changes in fluorescence intensity were monitored. The individual fluorescence signals turned on and off intermittently, a phenomenon known as photoblinking, and some spots emitted much brighter fluorescence then others (Fig. 2 A). Photoblinking is a property of QDs in which the light emission of QDs has on and off periods due to photoionization (31). By monitoring photoblinking behavior, the number of QDs contributing individual fluorescence spots could be quantified (32). In the case of free QD particles, the fluorescence intensities were measured at ∼40 arbitrary units (A.U.) and occasionally fell to basal levels (Fig. 2 B, black trace). When the intensities of 35 different fluorescence spots on COS-7 cells were monitored, two different types of fluorescence traces were obtained. Seventeen of them showed intensity levels of ∼40 A.U., which intermittently dropped to near 0 A.U. (Fig. 2 B, blue trace), similar to that of free QD. The intensities of the other 18 fluorescence spots fluctuated at ∼80 A.U., rapidly stepped down to 40 A.U., and then, sometimes, further down to the basal level (Fig. 2 B, red trace). By comparing the levels of photoblinking, the number of QDs contributing to individual fluorescence spots could be counted and the stoichiometry of QDs attached to single AP-rSlo-RFP channels inferred. Our results indicated that the individual fluorescence spots derived from the contribution of either one or two QDs, suggesting that each BKCa channel had been labeled by the aforementioned numbers of QDs. On average, 1.51 QDs per channel molecule (n = 35) were estimated. It is noteworthy that a fluorescence level corresponding to more than two QDs was never observed in our experiments.
Figure 2.
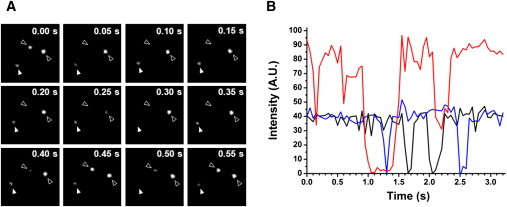
Stoichiometry of QDs on individual BKCa channels revealed by photoblinking. (A) Photoblinking of single QD-labeled AP-rSlo-RFP channels expressed in COS-7 cells. Time-lapse images of three different fluorescence spots are shown over 0.05-s intervals. Each symbol indicates identical spots blinking intermittently in all frames. Note that the fluorescence intensity of certain spots (open arrowheads) was significantly higher than that of others (solid arrowhead). (B) Representative traces for the fluorescence intensity of QD-labeled AP-rSlo-RFP channels (red and blue) and free QD (black). Fluorescence intensity is represented in arbitrary units (A.U.).
Membrane mobility of BKCa channels expressed in COS-7 cells
The movement of QD-labeled BKCa channels in COS-7 cells was then investigated using time-lapse imaging. Individual fluorescent particles were tracked at 300-ms time intervals over 15 s (Movie S1). The trajectories of five different QD-labeled AP-rSlo-RFP channels are shown in Fig. 3 A. Qualitatively, the movement of the channels expressed in COS-7 cells was homogeneous and rather restricted. The dynamics of individual channels were analyzed for two different criteria: a histogram of displacement at a fixed time-interval, and time-dependent displacement. In Fig. 3 B, the mean-squared displacements (MSDs) at 15 s are plotted for a total of 300 QD-labeled rSlo channels (open bars) and 100 QDs nonspecifically attached to the coverslip (hatched bar). We observed a single peak with a maximum value at 1.032 (R2 = 0.920 μm2) from the Gaussian curve fit, suggesting a single population of channel movement (Fig. 3 B). The diffusion characteristics of individual channels were also evaluated by plotting MSD as a function of time. In the plot, the QD-labeled rSlo channels expressed in COS-7 cells showed a sublinear relationship (Fig. 3 C). The initial-slope and the asymptote of the curve were estimated as 0.133 ± 0.005 μm2/s and 1.915 μm2, respectively. In two-dimensional diffusion, these two values are considered to represent the initial diffusion coefficient, Dinit, of 0.033 μm2/s and the confinement area for diffusion of 1.915 μm2 (or a circular area of 0.76 μm in radius), respectively.
Figure 3.

Dynamics of individual QD-labeled BKCa channels in live COS-7 cells. (A) Trajectories of five different QD-labeled AP-rSlo-RFP channels. QD-labeled channels were selected in the central (a–c) and peripheral regions (d and e) of cells. Scale bar, 10 μm. (Lower panel) Magnified view (3×) of individual trajectories. (B) Histogram of mean-squared displacement (MSD) of QD-labeled AP-rSlo-RFP at 15 s. The distribution of MSD values at 15 s is shown for QD-labeled AP-rSlo-RFP channels (open bars, n = 300). As the control, free QDs attached nonspecifically to the coverslip are shown (hatched bar, n = 100). (C) MSD versus time plot of QD-labeled AP-rSlo-RFP. Time-dependent changes in average MSD values are shown for QD-labeled AP-rSlo-RFP channels (open circles) and free QDs (diamonds). The time interval is 300 ms, and error bar represents mean ± SE.
Tracking of QD-labeled BKCa channels in cultured hippocampal neurons
In order to study the dynamics of BKCa channel in live neurons, AP-rSlo-RFP and BirA-ER were expressed in cultured rat hippocampal pyramidal cells. The specific labeling of QDs was also verified in the neurons (Fig. S3), and the movement of individual QD-labeled BKCa channels was monitored. The trajectories of five different QD-labeled channels tracked at 300-ms time intervals over 15 s are shown in Fig. 4 A. Unlike in COS-7 cells, the movement of AP-rSlo-RFP channels in neurons was significantly heterogeneous (Movie S2). While the channels located in the neuronal cell bodies (or somata) were rather static (Fig. 4 A, a and b), those in axodendritic areas were highly mobile (Fig. 4 A, c–e). Heterogeneous movements were also evident in the MSD histogram (Fig. 4 B). Whereas many channels showed slow movement peaking at 0.5 μm2/s, faster-moving channels were scattered at higher MSD values with discrete peaks at 2.0 and 5.5 μm2/s. From the trajectories of individual particles, we noticed that the QD-labeled AP-rSlo-RFP channels in axodendrites tended to move along the direction of each process. In order to appreciate this behavior of the channels, 46 consecutive movement vectors were illustrated for a single QD-labeled channel as an example (Fig. 4 C). The orientation of each vector was normalized to the direction of the dendrite at the vector origin. It was evident that most of the individual steps were along the direction of the neuronal process.
Figure 4.

Dynamics of individual QD-labeled BKCa channels in cultured hippocampal neurons. (A) Trajectories of five different QD-labeled BKCa channels. QD-labeled AP-rSlo-RFP channels were selected in the soma (a and b) and axodendritic area (c–e). Scale bar, 10 μm. Magnified view (3×) of individual trajectories (lower panel). (B) MSD histogram at 15 s. The distribution of displacement at 15 s is shown for QD-labeled AP-rSlo-RFP channels (open channel, n = 1000) and free QDs (hatched dark-shaded channel, n = 100). (C) Vector plot of QD-labeled AP-rSlo-RFP channels in axodendritic areas. Direction and distance are shown for 47 frames of a single representative QD-labeled AP-rSlo-RFP channel moving along a neuronal axodendrite. The orientation of each vector was normalized at the origin to the direction of the axodendritic process. The direction toward the soma was set at 0° and that toward the terminal region of the axodendrite was at 180°.
Because the dynamics of QD-labeled BKCa channels clearly differed between somata (Movie S3) and axodendrites (Movie S4), the distribution of MSD in these two areas was replotted separately (Fig. 5, A and B, upper panels). The QD-labeled rSlo channels in somata showed much slower mobility, with the MSD at 15 s rapidly decaying from the origin of the plot. In contrast, the channels located in axodendritic areas exhibited much faster and broader ranges of movement, with several different peaks between 0 and 15 μm2/s. From the plot of MSD versus time, the initial slopes of QD-labeled rSlo channels were estimated as 0.013 μm2/s for somata and 0.467 μm2/s in axodendritic areas. In the soma area, QD-labeled channels may experience two different types of diffusion environments, fast diffusion within 0.05 μm2, and much slower diffusion beyond 0.05 μm2 (Fig. 5 A, lower panel). Moreover, the MSD-versus-time relationship in the slower diffusion regime was fairly linear, at least up to 15 s, suggesting a free diffusion in this region of the neuron. For the channels in axodendritic areas, a partial confinement of diffusion was evident, as indicated by a clear sublinear relationship in the initial 2.5 s of MSD versus time (Fig. 5 B, lower panel). The asymptote of MSD values observed in the initial 2.5 s was estimated as 0.744 μm2. These channels also showed a near-linear relationship between 2.5 s and 11 s, or the area between 0.7 μm2/s to 4 μm2/s, and then reached another plateau beyond 11 s. Due to the dominant movement along the direction of neuronal processes, two-dimensional Dinit values from the initial slope of the MSD-versus-time plot were not assigned to QD-labeled channels in axodendritic areas. Although the QD-labeled AP-rSlo-RFP channels exhibited complex and heterogeneous behavior in both neuronal somata and axodendrites, we were able to conclude that movement occurred in axodendrites more heterogeneously and much more rapidly than in the neuronal cell bodies.
Figure 5.
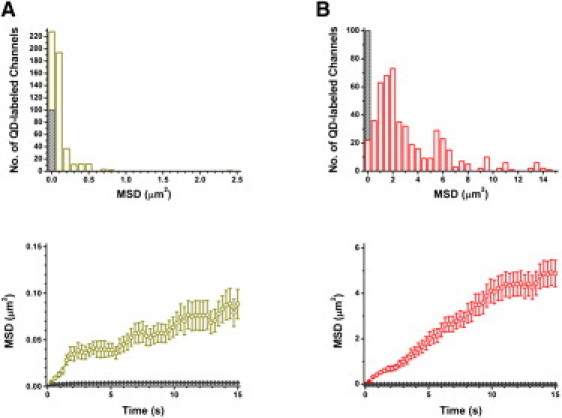
MSD histogram and time-dependent MSD plot of QD-labeled BKCa channels in neuronal somata and axodendrites. (A) MSD histogram at 15 s (upper panel) and time-dependent MSD plot (lower panel) of BKCa channels in somata. The distribution of MSD at 15 s is shown for QD-labeled AP-rSlo-RFP channels (open dark yellow, n = 500) and free QDs (hatched dark gray, n = 100) in soma areas. Time-dependent average MSD values are shown for QD-labeled AP-rSlo-RFP channels (open dark-yellow circles) and free QDs (dark gray diamonds). The time-interval between adjacent circles or diamonds is 300 ms. Error bars represent mean ± SE. (B) MSD histogram at 15 s (upper panel) and time-dependent MSD plot (lower panel) of BKCa channels in axodendrites. The distribution of MSD at 15 s is shown for QD-labeled AP-rSlo-RFP channels (open red, n = 500) and free QD (hatched dark-gray, n = 100) in axodendritic areas. Time-dependent average MSD values are shown for QD-labeled rSlo channels (open red circles) and free QD (dark-gray diamonds). The time-interval between adjacent circles or diamonds is 300 ms. Error bars represent mean ± SE.
Differential effects of β4 subunits on the mobility of channels expressed in somata and dendrites
Composed of two different subunits, BKCa channels can be assembled in vivo as either homotetramers comprised of only α-subunits or heterooctamers made up of α- and β-subunits. BKCa channels in central neurons can contain the β4 subunit, a neuron-specific auxiliary β-subunit. Thus, the effects of the β4 subunit on the membrane mobility of QD-labeled BKCa channels were investigated in both COS-7 cells and cultured hippocampal neurons. To ensure the coexpression of α- and β4 subunits in identical cells, the C-terminus of rat β4, rβ4, was tagged with green fluorescent protein (GFP) (Fig. S4). In addition, a fivefold molar excess of rβ4-GFP gene was used in transfection to provide enough β4 subunit for complex formation (26). The coassembly between AP-rSlo-RFP and rβ4-GFP in COS-7 cells were verified by confocal imaging and coimmunoprecipitation (Fig. S5).
The movement of individual QD-labeled BKCa channels coexpressed with β4 subunit was visualized in COS-7 cells (Movie S5) and hippocampal neurons (Movie S6 and Movie S7). The trajectories of five representative QD-labeled AP-rSlo-RFP/rβ4-GFP channels are shown in Fig. 6, A and B. Compared with homomeric α-channels, the mobility of QD-labeled α/β4 heteromeric BKCa channels was quite distinct both in COS-7 cells and neurons. In Fig. 7, the effects of the β4 subunit were quantitatively analyzed by comparing the distribution of displacement at 15 s (upper panels) and time-dependent displacement (lower panels). In COS-7 cells, β4 coexpression significantly decreased channel mobility, as evident in the shifts of the distribution to smaller MSD values (Fig. 7 A, upper panel). The MSD-versus-time plot indicated an initial slope of 0.007 μm2/s and asymptote of 0.375 μm2, corresponding to a 16.5-fold decrease in Dinit and a 5.1-fold reduction in the confinement area by the coassembly of the β4 subunit. The effects of β4 were even more dramatic and intriguing in neurons. While the movement of QD-labeled BKCa channels was decreased in axodendritic areas, the channels in somata became much more mobile with β4 coexpression (Fig. 7, B and C). The initial slopes of MSD-versus-time plots were estimated at 0.087 μm2/s in somata and 0.080 μm2/s in axodendrites. Thus, the mobility of BKCa channels was decreased 5.8-fold in axodendrites but increased 6.7-fold in somata by the coexpression of the β4 subunit. Because the mobility of the channels was oppositely affected in somata and axodendrites, the diffusion coefficients of α/β heteromeric BKCa channel became similar in these two areas.
Figure 6.
Dynamics of QD-labeled BKCa channels coassembled with α- and β-subunits in COS-7 cells and hippocampal neurons. (A) Trajectories of five different QD-labeled rSlo/rβ4 channels in COS-7 cells. QD-labeled AP-rSlo-RFP/rβ4-GFP channels were selected in the central (a–c) and peripheral regions (d and e) of cells. Scale bar, 10 μm. (Lower panel) Magnified view (3×) of individual trajectories. (B) Trajectories of five different QD-labeled rSlo/rβ4 channels. QD-labeled AP-rSlo-RFP/rβ4-GFP channels were selected in soma (a and b) and axodendritic areas (c–e). Scale bar, 10 μm. (Lower panel) Magnified view (3×) of individual trajectories.
Figure 7.

Effects of β4-subunits on the dynamics of QD-labeled BKCa channels in COS-7 cells and hippocampal neurons. (A) MSD histogram at 15 s (upper panel) and time-dependent MSD plot (lower panel) of BKCa channels in COS-7 cells. The distribution of MSD at 15 s is shown for QD-labeled AP-rSlo-RFP/rβ4-GFP channels (solid black, n = 300) and AP-rSlo-RFP channels (open black, n = 300). Time-dependent average MSD values are shown for QD-labeled AP-rSlo-RFP/rβ4-GFP channels (solid circle, n = 300) and AP-rSlo-RFP channels (open circle, n = 300). (B) MSD histogram at 15 s (upper panel) and time-dependent MSD plot (lower panel) of BKCa channels in somata of hippocampal neurons. The distribution of MSD at 15 s is shown for QD-labeled AP-rSlo-RFP/rβ4-GFP channels (solid dark yellow, n = 500) and AP-rSlo-RFP channels (open dark yellow, n = 500). Time-dependent average MSD values are shown for QD-labeled AP-rSlo-RFP/rβ4-GFP channels (solid circle, n = 500) and AP-rSlo-RFP channels (open circle, n = 500). (C) MSD histogram at 15 s (upper panel) and time-dependent MSD plot (lower panel) of BKCa channels in axodendrites of hippocampal neurons. The distribution of MSD at 15 s is shown for QD-labeled AP-rSlo-RFP/rβ4-GFP channels (solid red, n = 500) and AP-rSlo-RFP channels (open red, n = 500). Time-dependent average MSD values are shown for QD-labeled AP-rSlo-RFP/rβ4-GFP channels (solid circle, n = 500) and AP-rSlo-RFP channels (open circle, n = 500). The time-interval between two adjacent symbols is 300 ms. Error bars represent mean ± SE.
Discussion
As sensors for membrane voltage and intracellular Ca2+ that link cell excitability, signaling, and metabolism, BKCa channels are expressed widely in various tissues and involved in diverse physiological processes. Although their functional roles have been related to their specific localization to certain cellular and subcellular regions (20), the visualization of the individual BKCa channels and tracing of their movement in cells has not previously been possible.
In this study, single BKCa channels were visualized in live cells and their movement was monitored in real time. Utilizing the acceptor peptide for biotin tagged at the extracellular N-terminus of the channel and the ER-targeted bacterial biotin ligase, we were able to express biotin-conjugated BKCa channels on the cell surface and to achieve efficient and specific labeling of the channel with streptavidin-conjugated QDs. Compared to the metabolic labeling utilized in this study (24), the previously described method employing direct conjugation of exogenous biotin using the purified biotin ligase (23) tends to result in significantly higher levels of nonspecific QD-labeling in the cells tested (S. Won and CS. Park, unpublished observation). Using the photoblinking property of QDs, the stoichiometry of QDs labeling each BKCa channel was determined. Although up to four QDs can theoretically bind each channel, the channel was labeled by either one or two QDs. Considering the size of streptavidin-conjugated QDs used in this study, estimated at ∼20 nm in diameter, the BKCa channel may not provide sufficient space to accommodate more than two QDs. This idea is supported by a recent structural study using electron microscopy, in which the diameter of the homotetrameric BKCa channel was determined to be ∼20 nm (33), similar to the size of streptavidin-conjugated QD. These results also indicate that most, if not all, BKCa channels expressed in COS-7 cells are not clustered in groups but separated individually on the membrane surface.
In COS-7 cells, the movement of homomeric BKCa channel can be described as a confined diffusion with the diffusion coefficient (D) of 0.033 μm2/s and the confined area of 1.915 μm2 (Fig. 3 C). While this diffusion is substantially faster than that of highly confined membrane proteins, e.g., cystic fibrosis transmembrane conductance regulator expressed in COS-7 cells, with D = 0.004 μm2/s (34), it is comparable to that of QD-labeled aquaporin1 in COS-7 cells showing partially restricted diffusion with D = 0.084 μm2/s (35). A similar diffusion coefficient, 0.067 μm2/s, was also reported for another type of Ca2+-activated K+ channel, the IKCa channel, expressed in MDCK cells and labeled with antibody-conjugated QDs (36).
We then applied the specific labeling of QDs and single-particle tracking of the labeled BKCa channels in cultured neurons. The behavior of homomeric BKCa channels in cultured neurons was more complex than that in COS-7 cells.
First of all, channel mobility differed markedly between somata and axodendrites (Fig. 4 and Movie S2). The initial slope of MSD versus time was 36-fold greater in axodendritic areas than in somata (Fig. 5). In fact, the diffusion coefficient measured in somata was almost 11-fold lower than that in COS-7 cells; thus, the channels moved extremely slowly. It will be intriguing to find the cellular mechanism underlying the drastic increase in BKCa channel mobility upon entering neuronal processes from the cell body. We also wonder whether the large difference in mobility is specific for BKCa channels or a general phenomenon among different ion channels, because there is no report describing the movement of a population of channel proteins in an entire neuron.
Secondly, the trajectory of QD-labeled channels revealed that most of their movements followed the direction of axodendritic processes (Fig. 4 C). It is not clear whether this type of movement is due to the geometric constraint of neuronal processes or the role of cytoskeletal components in axodendritic transports. Nonetheless, the preferential movement along the process seems to render diffusion within this area pseudo-one-dimensional.
Thirdly, the movement of individual channels within the axodendritic area was highly heterogeneous. As shown in Fig. 5 B, the position of QD-labeled BKCa channels was fairly dispersed, with several peaks in the MSD histogram and at least three different diffusion regimes evident in the plot of MSD versus time. Considering the structural and functional heterogeneity of axodendritic arborization, individual BKCa channels may conceivably experience quite distinct and diverse microenvironments during diffusional movement in the area. Moreover, the QD-labeled BKCa channels in axons, expected to be a small population in our analysis, may behave significantly differently from those in dendrites. Despite the clear sublinear relationship observed in the MSD versus time plot, the heterogeneity and the pseudo-one-dimensional nature of movement preclude us from analyzing data from the neuronal axodendritic area based on the confined diffusion regime. In unraveling the behavioral complexity of the channels in neuronal cells, we may have to limit our observation to defined regions of the neuron, such as neuronal synapses, using a higher spatiotemporal resolution.
In the mammalian central nervous system, the majority of BKCa channels are assembled with two different subunits, α- and β4. Thus, we also investigated the effects of the neuronal β4 subunit on channel mobility. The molecular mass of the homotetrameric BKCa channel is estimated to be ∼515 kDa. Considering the molecular mass of β4, 24 kDa, the coassembly of four β4 would increase the molecular mass of channel complexes by 96 kDa without taking into account any glycosylation. Coexpression of β4 significantly reduced the mobility of QD-labeled BKCa channels in COS-7 cells and the axodendritic area of hippocampal neurons (Fig. 7, A and C). To our surprise, however, β4 coexpression dramatically increased the mobility of BKCa channels in the soma area. The initial diffusion coefficient was increased by 7.3-fold (Fig. 7 B). Although it is still unclear whether the β4 subunit can induce similar effects on the endogenous channels, our results suggest potential and unexplored roles of this auxiliary subunit in the transport and targeting of BKCa channels in neuronal cells. Moreover, the drastic influence of the β4 subunit on channel mobility provides us with an assay method to determine the domain(s) responsible for and the molecular mechanism underlying the effects of β4. It still remains to be examined whether there is any physiological relevance to the differential influence of β4 on channel mobility in different neuronal regions in vivo. Although only limited information is currently available regarding the dynamics of BKCa channels in neuronal cells, a recent study demonstrated that certain neurons may contain two different pools of BKCa channels: scattered and clustered (37). While scattered BKCa channels were distributed throughout the somatodendritic regions of cerebellar Purkinje cells, the clustered channels were restricted to the somata and the very proximal portion of dendrites. Na+ and Ca2+ spikes were also found to modulate differentially the two different channel pools. Thus, it would be intriguing to determine whether the distribution, dynamics, and physiological function of BKCa channels in specific neurons can be modulated by auxiliary subunits.
In summary, we were able to probe individual BKCa channels with QDs and monitored their movement in live cells. Our results demonstrate that the mobility of the BKCa channel can vary significantly depending on cell type, subcellular location, and subunit composition. The experimental technique introduced in this study can be utilized to unravel the cellular mechanisms that determine the mobility and localization of BKCa channels and other membrane proteins.
Acknowledgments
The authors are grateful to Dr. Alice Y. Ting (Massachusetts Institute of Technology, Cambridge, MA) for providing pDisplay BirA-ER, the members of the Laboratory of Molecular Neurobiology at Gwangju Institute of Science and Technology (GIST), Gwangju, South Korea for their valuable comments, and the Bio-Imaging Research Center at GIST for providing various imaging equipment.
This research was supported in part by the grants from the Bio-Imaging Research Center and the Cell Dynamics Research Center of GIST, and the National Research Foundation of Korea (grant No. E00025) to C.-S.P.
Supporting Material
References
- 1.Vergara C., Latorre R., Adelman J.P. Calcium-activated potassium channels. Curr. Opin. Neurobiol. 1998;8:321–329. doi: 10.1016/s0959-4388(98)80056-1. [DOI] [PubMed] [Google Scholar]
- 2.Latorre R., Brauchi S. Large conductance Ca2+-activated K+ (BK) channel: activation by Ca2+ and voltage. Biol. Res. 2006;39:385–401. doi: 10.4067/s0716-97602006000300003. [DOI] [PubMed] [Google Scholar]
- 3.Salkoff L., Butler A., Wei A. High-conductance potassium channels of the SLO family. Nat. Rev. Neurosci. 2006;7:921–931. doi: 10.1038/nrn1992. [DOI] [PubMed] [Google Scholar]
- 4.Nelson M.T., Cheng H., Lederer W.J. Relaxation of arterial smooth muscle by calcium sparks. Science. 1995;270:633–637. doi: 10.1126/science.270.5236.633. [DOI] [PubMed] [Google Scholar]
- 5.Yazejian B., DiGregorio D.A., Grinnell A.D. Direct measurements of presynaptic calcium and calcium-activated potassium currents regulating neurotransmitter release at cultured Xenopus nerve-muscle synapses. J. Neurosci. 1997;17:2990–3001. doi: 10.1523/JNEUROSCI.17-09-02990.1997. [DOI] [PMC free article] [PubMed] [Google Scholar]
- 6.Fettiplace R., Fuchs P.A. Mechanisms of hair cell tuning. Annu. Rev. Physiol. 1999;61:809–834. doi: 10.1146/annurev.physiol.61.1.809. [DOI] [PubMed] [Google Scholar]
- 7.Brenner R., Peréz G.J., Aldrich R.W. Vasoregulation by the β1 subunit of the calcium-activated potassium channel. Nature. 2000;407:870–876. doi: 10.1038/35038011. [DOI] [PubMed] [Google Scholar]
- 8.Knaus H.G., Folander K., Swanson R. Primary sequence and immunological characterization of β-subunit of high conductance Ca2+-activated K+ channel from smooth muscle. J. Biol. Chem. 1994;269:17274–17278. [PubMed] [Google Scholar]
- 9.McManus O.B., Helms L.M., Leonard R.J. Functional role of the β-subunit of high conductance calcium-activated potassium channels. Neuron. 1995;14:645–650. doi: 10.1016/0896-6273(95)90321-6. [DOI] [PubMed] [Google Scholar]
- 10.Catterall W.A. Structure and function of voltage-gated ion channels. Annu. Rev. Biochem. 1995;64:493–531. doi: 10.1146/annurev.bi.64.070195.002425. [DOI] [PubMed] [Google Scholar]
- 11.Jiang Y., Pico A., MacKinnon R. Structure of the RCK domain from the E. coli K+ channel and demonstration of its presence in the human BK channel. Neuron. 2001;29:593–601. doi: 10.1016/s0896-6273(01)00236-7. [DOI] [PubMed] [Google Scholar]
- 12.Wallner M., Meera P., Toro L. Characterization of and modulation by a β-subunit of a human maxi KCa channel cloned from myometrium. Receptors Channels. 1995;3:185–199. [PubMed] [Google Scholar]
- 13.Meera P., Wallner M., Toro L. A neuronal beta subunit (KCNMB4) makes the large conductance, voltage- and Ca2+-activated K+ channel resistant to charybdotoxin and iberiotoxin. Proc. Natl. Acad. Sci. USA. 2000;97:5562–5567. doi: 10.1073/pnas.100118597. [DOI] [PMC free article] [PubMed] [Google Scholar]
- 14.Sausbier U., Sausbier M., Ruth P. Ca2+ -activated K+ channels of the BK-type in the mouse brain. Histochem. Cell Biol. 2006;125:725–741. doi: 10.1007/s00418-005-0124-7. [DOI] [PubMed] [Google Scholar]
- 15.Edgerton J.R., Reinhart P.H. Distinct contributions of small and large conductance Ca2+-activated K+ channels to rat Purkinje neuron function. J. Physiol. 2003;548:53–69. doi: 10.1113/jphysiol.2002.027854. [DOI] [PMC free article] [PubMed] [Google Scholar]
- 16.Benhassine N., Berger T. Homogeneous distribution of large-conductance calcium-dependent potassium channels on soma and apical dendrite of rat neocortical layer 5 pyramidal neurons. Eur. J. Neurosci. 2005;21:914–926. doi: 10.1111/j.1460-9568.2005.03934.x. [DOI] [PubMed] [Google Scholar]
- 17.Sailer C.A., Kaufmann W.A., Knaus H.G. Immunolocalization of BK channels in hippocampal pyramidal neurons. Eur. J. Neurosci. 2006;24:442–454. doi: 10.1111/j.1460-9568.2006.04936.x. [DOI] [PubMed] [Google Scholar]
- 18.Hu H., Shao L.R., Storm J.F. Presynaptic Ca2+-activated K+ channels in glutamatergic hippocampal terminals and their role in spike repolarization and regulation of transmitter release. J. Neurosci. 2001;21:9585–9597. doi: 10.1523/JNEUROSCI.21-24-09585.2001. [DOI] [PMC free article] [PubMed] [Google Scholar]
- 19.Shao L.R., Halvorsrud R., Storm J.F. The role of BK-type Ca2+-dependent K+ channels in spike broadening during repetitive firing in rat hippocampal pyramidal cells. J. Physiol. 1999;521:135–146. doi: 10.1111/j.1469-7793.1999.00135.x. [DOI] [PMC free article] [PubMed] [Google Scholar]
- 20.Trimmer J.S., Rhodes K.J. Localization of voltage-gated ion channels in mammalian brain. Annu. Rev. Physiol. 2004;66:477–519. doi: 10.1146/annurev.physiol.66.032102.113328. [DOI] [PubMed] [Google Scholar]
- 21.Bruchez M., Jr., Moronne M., Alivisatos A.P. Semiconductor nanocrystals as fluorescent biological labels. Science. 1998;281:2013–2016. doi: 10.1126/science.281.5385.2013. [DOI] [PubMed] [Google Scholar]
- 22.Han M., Gao X., Nie S. Quantum-dot-tagged microbeads for multiplexed optical coding of biomolecules. Nat. Biotechnol. 2001;19:631–635. doi: 10.1038/90228. [DOI] [PubMed] [Google Scholar]
- 23.Howarth M., Takao K., Ting A.Y. Targeting quantum dots to surface proteins in living cells with biotin ligase. Proc. Natl. Acad. Sci. USA. 2005;102:7583–7588. doi: 10.1073/pnas.0503125102. [DOI] [PMC free article] [PubMed] [Google Scholar]
- 24.Howarth M., Ting A.Y. Imaging proteins in live mammalian cells with biotin ligase and monovalent streptavidin. Nat. Protoc. 2008;3:534–545. doi: 10.1038/nprot.2008.20. [DOI] [PMC free article] [PubMed] [Google Scholar]
- 25.Zou S., Jha S., Dryer S.E. A novel actin-binding domain on Slo1 calcium-activated potassium channels is necessary for their expression in the plasma membrane. Mol. Pharmacol. 2008;73:359–368. doi: 10.1124/mol.107.039743. [DOI] [PubMed] [Google Scholar]
- 26.Ha T.S., Heo M.S., Park C.S. Functional effects of auxiliary β4-subunit on rat large-conductance Ca2+-activated K+ channel. Biophys. J. 2004;86:2871–2882. doi: 10.1016/S0006-3495(04)74339-8. [DOI] [PMC free article] [PubMed] [Google Scholar]
- 27.Patton C., Thompson S., Epel D. Some precautions in using chelators to buffer metals in biological solutions. Cell Calcium. 2004;35:427–431. doi: 10.1016/j.ceca.2003.10.006. [DOI] [PubMed] [Google Scholar]
- 28.Kusumi A., Sako Y., Yamamoto M. Confined lateral diffusion of membrane receptors as studied by single particle tracking (nanovid microscopy). Effects of calcium-induced differentiation in cultured epithelial cells. Biophys. J. 1993;65:2021–2040. doi: 10.1016/S0006-3495(93)81253-0. [DOI] [PMC free article] [PubMed] [Google Scholar]
- 29.Beckett D., Kovaleva E., Schatz P.J. A minimal peptide substrate in biotin holoenzyme synthetase-catalyzed biotinylation. Protein Sci. 1999;8:921–929. doi: 10.1110/ps.8.4.921. [DOI] [PMC free article] [PubMed] [Google Scholar]
- 30.Barat B., Wu A.M. Metabolic biotinylation of recombinant antibody by biotin ligase retained in the endoplasmic reticulum. Biomol. Eng. 2007;24:283–291. doi: 10.1016/j.bioeng.2007.02.003. [DOI] [PMC free article] [PubMed] [Google Scholar]
- 31.Nirmal M., Dabbousi B.O., Brus L.E. Fluorescence intermittency in single cadmium selenide nanocrystals. Nature. 1996;383:802–804. [Google Scholar]
- 32.Månsson A., Sundberg M., Montelius L. In vitro sliding of actin filaments labeled with single quantum dots. Biochem. Biophys. Res. Commun. 2004;314:529–534. doi: 10.1016/j.bbrc.2003.12.133. [DOI] [PubMed] [Google Scholar]
- 33.Wang L., Sigworth F.J. Structure of the BK potassium channel in a lipid membrane from electron cryomicroscopy. Nature. 2009;461:292–295. doi: 10.1038/nature08291. [DOI] [PMC free article] [PubMed] [Google Scholar]
- 34.Jin S., Haggie P.M., Verkman A.S. Single-particle tracking of membrane protein diffusion in a potential: simulation, detection, and application to confined diffusion of CFTR Cl− channels. Biophys. J. 2007;93:1079–1088. doi: 10.1529/biophysj.106.102244. [DOI] [PMC free article] [PubMed] [Google Scholar]
- 35.Crane J.M., Verkman A.S. Long-range nonanomalous diffusion of quantum dot-labeled aquaporin-1 water channels in the cell plasma membrane. Biophys. J. 2008;94:702–713. doi: 10.1529/biophysj.107.115121. [DOI] [PMC free article] [PubMed] [Google Scholar]
- 36.Nechyporuk-Zloy V., Dieterich P., Schwab A. Dynamics of single potassium channel proteins in the plasma membrane of migrating cells. Am. J. Physiol. Cell Physiol. 2008;294:C1096–C1102. doi: 10.1152/ajpcell.00252.2007. [DOI] [PubMed] [Google Scholar]
- 37.Kaufmann W.A., Ferraguti F., Ottersen O.P. Large-conductance calcium-activated potassium channels in purkinje cell plasma membranes are clustered at sites of hypolemmal microdomains. J. Comp. Neurol. 2009;515:215–230. doi: 10.1002/cne.22066. [DOI] [PubMed] [Google Scholar]
Associated Data
This section collects any data citations, data availability statements, or supplementary materials included in this article.