

Abstract
The packing of eukaryotic DNA in the nucleus is decisive for its function; for instance, contact between remote genome sites constitutes a basic feature of gene regulation. Interactions among regulatory proteins, DNA binding, and transcription activation are facilitated by looping of the intervening chromatin. Such long-range interactions depend on the bending flexibility of chromatin, i.e., the ring-closure probability is a directly measurable indicator of polymer flexibility. The applicability of a wormlike chain model to naked DNA has been widely accepted. However, whether this model also suffices to describe the flexibility of eukaryotic interphase chromatin is still a matter of discussion. Here we compare both 5C data from a gene desert and data from fluorescence in situ hybridization with the results of a Monte Carlo simulation of chromatin fibers with and without histone depletion. We then estimate the ring-closure probabilities of simulated fibers with estimates from analytical calculations and show that the wormlike chain model grossly underestimates chromatin flexibility for sharp bends. Most importantly, we find that only fibers with random depletion of linker histones or nucleosomes can explain the probability of random chromatin contacts on small length scales that play an important role in gene regulation. It is possible that missing linker histones and nucleosomes are not just simple, unavoidable, randomly occurring defects, but instead play a regulatory role in gene expression.
Introduction
The eukaryotic genome is compacted into chromatin. In this structure, the DNA is wrapped at ∼200 basepair intervals around histone octamers, forming a string of beads that can be further compacted into a linear structure known as the chromatin fiber. How the nucleosomes are arranged to form this higher-order structure is still a matter of discussion (3–6). Different models have been proposed, including zigzag ribbon (or crossed-linker) models (7–11), helical solenoid models (12–14), and irregular structures (5). The solenoid models and the crossed-linker structures are the main competing classes of chromatin models for the nondepleted state. In the solenoid model, two consecutive nucleosomes linked by a stretch of DNA are located at the same side of the fiber, requiring the linker DNA to bend, whereas in the crossed-linker case they sit on opposite sides of the fiber and the DNA linker that connects them is straight. In the solenoid model, the nucleosome chain forms a helical structure with the axis of the core particles being perpendicular to the solenoidal axis. The crossed-linker pattern of the model with the straight linkers, peripherally arranged nucleosomes, and internal linker DNA allows dramatic changes in the compaction level to occur without major changes in the topology. The crystal structure of a tetranucleosome (without linker histones) was solved in 2005 (7) and supports the helical ribbon structure. A more recent approach (15) starts with the nucleosome arrangement and seeks to determine which kinds of chromatin structures are possible. (For a profound discussion of different chromatin models, see Schiessel (16).)
Nucleosomes are in a dynamic equilibrium with the chromatin fiber. They can dissolve entirely by unwrapping the DNA, leaving naked DNA stretches behind, and later they can form again. This leads to an average nucleosome occupation (i.e., the probability that a basepair will be covered by a nucleosome) of <75% (which corresponds to a entirely saturated chromatin fiber), an effect that has to be taken into account in structural models.
In addition to its structural role, this compaction is centrally important in the regulation of transcription. Access to DNA wrapped in a nucleosome is obstructed (17) for polymerase, regulatory, repair, and recombination complexes, yet nucleosomes also bind other proteins through interactions with their histone tail domains (18). The detailed locations of nucleosomes along the DNA may have important inhibitory or facilitatory roles in regulating gene expression (19,20). Several enzymes can reposition nucleosomes along the DNA (21) and thus influence chromatin structure.
The salt concentration (12) and the presence of linker histones (8,22) can change the degree of chromatin compaction. The linker histones H1 and H5 compact the chromatin chain from the beads-on-a-string structure into the 30 nm fiber. It binds to the in- and outgoing DNA strands and thus stabilizes the nucleosome. H1 depletion changes the chromatin structure profoundly (23).
Linker histones are not necessary for the formation of the 30 nm fiber (24), although they increase its compaction. Chromatin compaction also depends on the so-called nucleosome repeat length (NRL) (25). The NRL is defined as the length of the DNA stretch that is wrapped around a nucleosome plus the length of the linker DNA the nucleosome with its neighbor. Widom (25) performed many measurements on NRLs and discovered that the NRL distributions show a preferential quantization to a set of values related by integral multiples of the helical twist of DNA. Model calculations of possible chromatin structures as a function of NRL by a combination of static model building on the atomic scale and Monte Carlo simulations (26) were in agreement with those earlier studies.
In a comparison between two DNAs with 168 and 197 bp NRL, it was found that only the 197 bp NRL could form a 30 nm higher-order chromatin structure (24). This structure also showed a cooperative linker histone-dependent compaction. Chromatin strands with a repeat length of 167 bp displayed a limited linker histone-dependent compaction, which led to a topologically different thinner fiber.
The flexibility of the chromatin fiber has a profound influence on its biological function. To start transcription, the RNA polymerase II complex associated with general transcription factors has to assemble at the promoter. In particular, in eukaryotic cells the basal transcription rate is low unless regulatory proteins bind to distant sequences (enhancers), hundreds to thousands of basepairs away from the transcription start, and then contact the transcription complex. These long-range interactions between regulatory proteins and the transcription complex are mediated by bending of the intervening chromatin, which forms a loop.
Beyond simple looping, the overall folding topology of the genome is thought to play an important part in the coordination of transcription and other processes that act on DNA. Chromosome conformation capture (3C) technology allows one to analyze chromatin folding in the native cellular state by cross-linking parts of the genome that are close in space (27). The technique allows the identification of physical interactions between distant DNA segments and of chromatin loops that are formed as a consequence of these interactions—for example, between transcriptional regulatory elements and distant target genes (28–32).
Cross-linking techniques have become a standard research tool for studying the relationship between nuclear organization and transcription in the native cellular state. For instance, 3C has been used to show that regulatory DNA elements communicate with distant target genes through direct physical interactions that loop out the intervening chromatin fiber. Other technologies (33,34) based on the 3C principle have been designed to increase the throughput: 4C technology allows for an unbiased genome-wide screen for interactions with a locus of choice, and 5C technology permits parallel analysis of interactions between many selected DNA fragments.
Whereas 3C technology measures cross-linking probabilities, fluorescence in situ hybridization (FISH) provides direct information about the spatial distribution of chromosomes. Specific parts of the genome, ranging in size from a few kilobasepairs to 100 kbp, are fluorescently labeled. These labels can then be localized with a light microscope. Thus, a relationship between the mean-square distance and genomic separation of two or more markers can be established (2,35,36).
In general, the interaction probability of two loop-forming sites is a function of their distance and the flexibility of the chromatin fiber, expressed as the persistence length (37). For equal genomic distance, chromatin fibers with shorter persistence length will exhibit higher interaction probabilities. For a wormlike polymer chain with isotropic bending elasticity, the interaction probability is directly related to the persistence length and the genomic distance (38). However, for a complex structure such as the chromatin fiber, this simple description may not be sufficient. Therefore, in this work we used numerical simulations to calculate the looping probabilities for various chromatin chain models.
Even for simple DNA, it was recently suggested that tight bends are more probable than predicted from the wormlike chain (WLC) model (39). In that case, the interaction probability for DNA fragments shorter than the persistence length can be significantly elevated. Our calculations show that both for chromatin chains randomly depleted of histone H1 and for homogeneous chains at high bending angles, the looping probability may be substantially higher than for a presumed homogeneously elastic chain. In fact, it turns out that the 30 nm chromatin fiber can form sharp bends very easily. This means that the persistence length measured for small bending fluctuations close to thermodynamic equilibrium will give too low an estimate for the looping probability, and vice versa. Measurements of the interaction probability will lead to estimates of the persistence length that are significantly too low.
Here, we simulate conformations of chromatin fibers with the two-angle model originally proposed by Woodcock et al. (9) and later used in several chromatin models (40–43).
In a previous publication (44) we discussed how different depletion effects change the properties of chromatin fibers. We simulated chromatin fibers across a large range of H1 and nucleosome depletion probabilities, and found that fibers that match the experimental probabilities are very close to optimization in compaction. We also found that the concept of a regular 30 nm structure is not valid any more if one includes reasonable depletion rates. In this work, we use fixed depletion rates that equal average values estimated from experimental distributions (25,44) and focus entirely on chromatin looping probabilities. We compare the simulation results of chromatin fibers with and without histone depletion with 5C data (1) from a gene desert as well as data obtained by FISH (2). We compare experimental with theoretical loop formation probabilities and find that only fibers that are partially depleted of linker histones or entire nucleosomes can explain random chromatin contacts on the small length scales that play an important role in gene regulation. It is possible that missing linker histones and nucleosomes are not just simple, unavoidable, randomly occurring defects, but instead play an important regulatory role in gene expression.
Materials and Methods
The model of the chromatin chain is based on the two-angle model originally proposed by Woodcock et al. (9). In their model, the conformation of the chain is determined by two parameters: 1), the opening angle between the linker DNA arms; and 2), the twisting angle between adjacent nucleosomes (which is directly related to the linker DNA length through the DNA helical pitch). This model is extended by a more precise description of the local nucleosome geometry in the linker DNA region and by the presence or absence of histone H1, as described in previous publications (43–45). This extended model, termed the E2A model, can take two different depletion effects into account (Fig. 1): 1), linker histone depletion (i.e., missing linker histones that normally would fix the in- and outgoing DNA strand in front of the nucleosome); and 2), nucleosome depletion. In the latter case, not only the linker histone but also the whole nucleosome core particle (i.e., the histone octamer) is missing, leaving a stretch of naked DNA behind. This stretch of DNA can then be covered with proteins again. One mechanism that might lead to nucleosome depletion is nucleosome replacement by other DNA-binding proteins, such as transcription factors.
Figure 1.
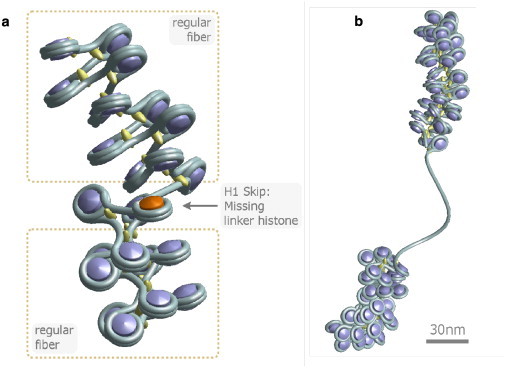
The two different types of histone depletion. (a) Linker histone depletion gives the fiber more flexibility locally. Normally the linker histone fixes the in- and outgoing DNA strand. If the histone is gone, the DNA arms can move freely with respect to excluded volume potentials. (b) In this case, not only the linker histone but also the whole nucleosome core particle is missing, and hence a long, blank stretch of naked DNA remains.
The linker histone H1 is positioned at the nucleosome dyad. Cryoelectron microscopy shows that the two linkers cross symmetrically in front of the linker histone (46). Thus, our model assumes a fixed length of each linker clamped by the presence of H1. All chromatin fiber components are modeled as segments interacting through bending and torsion potentials, as described previously (41). In simulations of tight chromatin bends, the model contained a slightly attractive potential between nucleosomes (41), whereas a cylindrical hard-core potential was used for the larger chains in the depletion studies (43). Chain conformations are generated by means of a Metropolis Monte Carlo procedure (47,48), and the averages presented here are based on at least 3 × 10⁶ chromatin conformations after a prerelaxation period.
In the following text, chromatin fibers without any depletion effects will be called regular fibers, and fibers with depletion effects will be called disturbed or irregular (Fig. 2). In the case of the E2A model, the linker histone skip rate was fixed to 6% (45) and the nucleosome skip rate was fixed to 8% (44) in accordance with experimental results (49).
Figure 2.
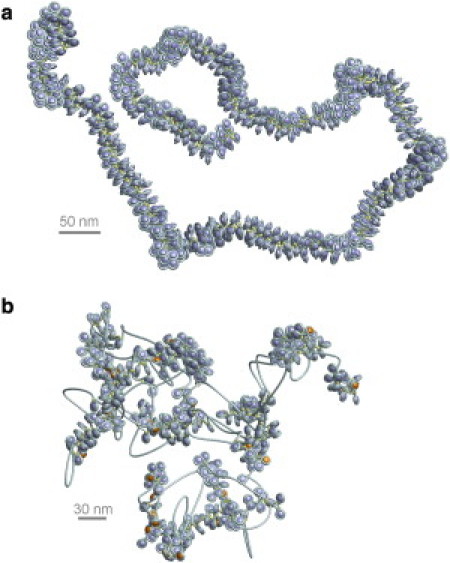
(a) A regular chromatin fiber without any depletion effects. (b) Disturbed chromatin fibers with linker histone depletion (orange nucleosomes) and nucleosome depletion. One can see that the disturbed chromatin fiber is much more irregular. The regular fiber has a persistence length of ∼280 nm, whereas the disturbed fiber is much more flexible, with a persistence length of only ∼140 nm. If reasonable histone skip rates are taken into account, the regular 30 nm chromatin fiber is replaced by a very irregular structure with a much higher loop frequency.
The fibers without depletion effects have lengths of 1.6 Mbp, 800 kbp, and 160 kbp (i.e., 8000 NRLs, 4000 NRLs, and 800 NRLs, respectively), and the fibers with depletion effects have contour lengths of 160 kbp and 80 kbp. In the case of fibers with depletion effects, smaller fiber lengths are sufficient to resolve the loop distributions, as demonstrated further below. Furthermore, they are harder to sample, and sometimes conditional probabilities are needed for the analyses presented here. Unfortunately, these analyses require huge sample sizes (e.g., to evaluate the conditional probability distribution of the loop end position over the set of all fibers with a loop that starts a given position along the fiber). It will be shown that the total length of a fiber does not change the loop statistics very much as long as it is far above the persistence length. The simulations for short loop formation were done on 100-nucleosome chains with a repeat of 168 bp.
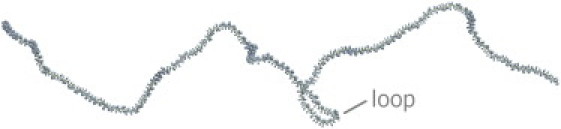
Fig. 3 shows a 1.6 Mbp chromatin conformation with a large 167 kbp long loop. Another loop conformation in a regular chromatin fiber can be found in Fig. 4.
Figure 3.
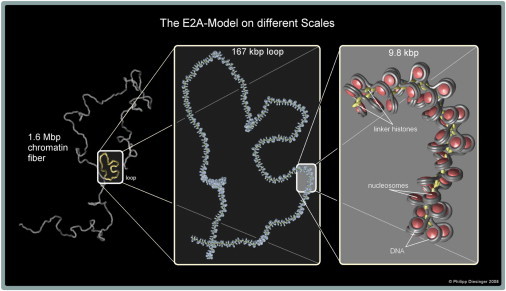
Loop conformation in a chromatin fiber modeled by the E2A model. Two fiber parts must (by definition of the interaction radius rmax) come closer together than 35 nm to form a loop. Chromatin loops on small scales play a very important role in gene regulation because enhancer/silencer and promoter regions of the DNA have to be in close proximity to actually work. The length of these loops is typically on the order of a few kilobasepairs, although there are some exceptions; therefore, the loop shown in this figure is a large one with a length of 167 kbp.
Figure 4.
Example of a regular chromatin conformation with a small loop. The chain has a total length of 160 kbp. The loop length is ≈10 kbp.
Most of the probabilities presented in this work are given under the condition that the chromatin fiber has at least one loop, and hence are denoted as conditional probabilities in the following. All unlooped fibers are left out in these cases.
Results
In a previous work, Bystricky et al. (2) reconciled high-resolution FISH data from intervals of 14–100 kbp along single chromatids with measurements of whole chromosome arms (122–623 kbp in length), monitored in intact cells through the targeted binding of bacterial repressors fused to GFP derivatives. The results are interpreted with a flexible polymer model and suggest that interphase chromatin exists in a compact, higher-order conformation with a persistence length of 170–220 nm and a mass density of ≈110–150 bp/nm. These values are equivalent to 7–10 nucleosomes per 11 nm within a 30-nm-like fiber structure.
To analyze chromatin compaction ratios in interphase nuclei, investigators have generally applied FISH using differentially derivatized probes. Bystricky et al. (2) determined end-to-end distances for a range of genomic intervals by using unique techniques for high-resolution FISH (50,51) and live GFP-fusion imaging based on repressor binding to chromosomally integrated, nonamplified lac or tet operator arrays (52). This process combined with immunofluorescence allowed them to examine chromatin folding over small distances in intact yeast cells. They also compared arm length measurements with distances separating different repressor array insertions. The WLC model then allowed them to determine both the persistence length and the mass density of chromatin from these end-to-end distance values.
Our simulations show that the regular chromatin fibers have a diameter of ∼33 nm and a persistence length of 280 nm, whereas the disturbed fibers have a persistence length of only 140 nm and thus are much more flexible (44). Nevertheless, one must take care in applying the concept of persistence length to fibers with H1 and nucleosome depletion. Although the persistence length is still on the order of 100 nm, fiber parts can come very close together due to the nucleosome depletion, although they are only a few NRLs apart along the fiber axis, i.e., they are still in a region where one would expect the fiber to be too stiff to bend if the persistence length were used as a measure of stiffness. Moreover, chromatin fibers in the cell nucleus that are larger than a few hundred kilobasepairs are no longer unconstrained and start to feel the presence of the biological environment.
We sampled the large chains without depletion effects to exclude the possibility that the differences of the loop distributions would disappear if we changed the fiber length.
Fig. 5 shows the scaling of the spatial versus the genomic nucleosome separation together with experimental results from two-color FISH measurements (2). The figure does not contain any fits, but shows absolutely determined values for the regular and disturbed chromatin fibers. It is clear that the graph for the disturbed fibers matches the experimental data much better than the graph of the regular ones, albeit not perfectly. The remaining difference results from the fact that in the experiment chromatin melts were examined, whereas in our simulations only one chromatin fiber was generated at a time (i.e., we examined a very dilute chromatin solution). Flory (53) showed that polymers in melts behave as if their monomers have zero volume (Gaussian statistics). Hence, the actual distance graph for chromatin melts would definitely lie below the curves presented in Fig. 5. Furthermore, the chromatin fibers in the experiment experience the confinement of the cell nucleus, whereas those in the computer simulation do not. These effects would further decrease the graph of the disturbed chromatin fibers toward the experimental data. The graphs of Fig. 5 provide at least a suitable upper bound for the actual behavior of chromatin in the cell nucleus.
Figure 5.
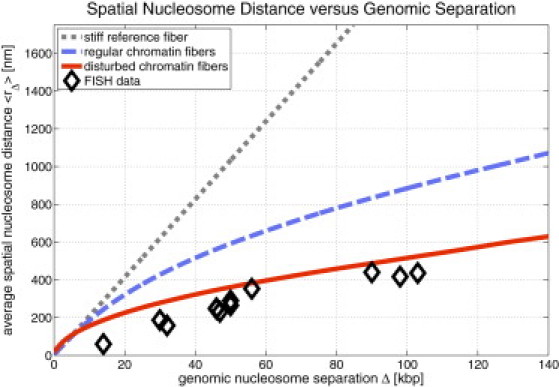
Comparison of the scaling of spatial versus genomic nucleosome separation. The data show results from two-color FISH experiments (2). One can see that the disturbed chromatin fibers are much closer to the experimentally determined points. The remaining differences come from the fact that in the simulations only one chromatin fiber was simulated at a time (dilute chromatin), whereas the experiments were done in a crowded environment that furthermore had the confinement of the cell nucleus.
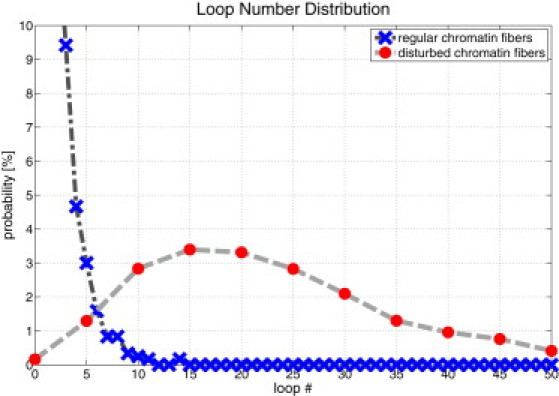
Fig. 6 shows a comparison of the loop number probability distribution for regular and disturbed chromatin fibers. One can clearly see that regular fibers have much fewer loops (0.31 on average) than the disturbed fibers (with an average of 25.5 loops per fiber). Furthermore, these (normalized) distributions are independent of fiber length (see Fig. S9) because three-dimensional random walks are recurrent and thus the probability to actually form a loop decreases very rapidly with increasing loop length.
Figure 6.
Probability distribution of the loop number within regular and disturbed chromatin fibers. The distributions are independent of the fiber length because the self-avoiding walk is recurrent in three-dimensional space (cf. Supporting Material). Disturbed chromatin fibers show many more loops compared to regular chromatin fibers. The regular fibers have an average loop number of 0.31 and the disturbed chromatin fibers have an average loop number of 25.5.
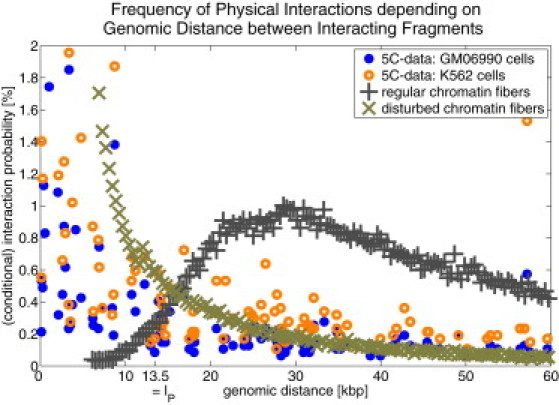
As pointed out above, the mere loop number is not sufficient to describe the loop statistics. The distribution of the loop length is highly important as well. It is displayed in Fig. 7 for regular and disturbed chromatin fibers together with 5C data for random chromatin contacts (1). The loop length distribution of the regular fibers shows a completely different shape than the experimentally determined distribution. They show no loops at all at the important small scale in the kilobasepair regime, and therefore their genes would probably be less expressed, since promoter/enhancer contacts are formed less easily. This kind of chromatin might resemble the transcriptionally inactive heterochromatin.
Figure 7.
Comparison of the loop length distributions of regular and disturbed chromatin fibers with experimental data from 5C experiments on a gene desert (1). The regular chromatin fibers show a completely different loop distribution because they are too stiff to have loops on small length scales. The persistence length of these fibers is 280 nm, which corresponds to a length along the contour of 13.5 kbp. One can clearly see that this is the region where the looping starts in the regular fibers. The disturbed chromatin fibers show a qualitatively similar-shaped graph compared to the 5C data. In contrast to the regular fibers, they have loops on the small scales that are very important for gene regulation.
In contrast to the regular chromatin fibers, the disturbed ones show a qualitatively completely different loop length distribution that much more strongly resembles the experimentally found values. The disturbed chromatin fibers indeed show the chromatin contacts on the kilobasepair scale that are so important for gene regulation in genetically active euchromatin.
The distribution for fibers without depletion effects resembles the loop distribution of an ordinary (self-avoiding) random walk. Small loops are unlikely because the fiber is too stiff to bend on the short length scales. The persistence length of 280 nm corresponds to a fiber contour length of ≈13.5 kbp. One can see that this is approximately the region where the loop probability starts to grow. Large loops are unlikely, too, since the random walk is transient in three dimensions.
The loop distribution of the chromatin fibers with depletion effects looks completely different, and small loops are very likely in this case. The depletion effects give the fiber much more flexibility and thus facilitate loop formation on the kilobasepair scale. In particular, nucleosome depletion allows the fibers to bend even on small length scales.
The fiber length does not have a recognizable effect on the loop distribution on this small length scale (cf. Figs. S9 and S10). The difference between the 160 kbp fiber without depletion effects and the corresponding 10-fold larger fiber stems from the normalization, since the fiber length limits the maximal loop length. Furthermore, one has to keep in mind that there is a cutoff for the minimal loop length at ∼5.9 kbp.
Finally, simulations of short (100-nucleosome) chromatin fibers with and without linker histones show that the probability for formation of short loops deviates significantly from that for a WLC. For a semiflexible chain with homogeneous elasticity, the loop formation probability has a maximum for a chain length of ∼3.3 Lp (Fig. 8). For the simulated chromatin fibers, it is clear that the broad maximum is at a much smaller contour length (about two persistence lengths; the strong increase in j at short distances is an artifact, since an end-to-end distance of <20 nm is taken as an interaction). Thus, chromatin chains have an intrinsic tendency to form tight bends with a higher probability than predicted from the theory for a homogeneous elastic chain. This can be seen as analogous to the behavior of B-DNA, for which it was recently shown that short fragments bend more easily into circles than predicted from WLC theory (54), and that the bending potential deviates from a Hookean spring potential for very tight bends (39).
Figure 8.
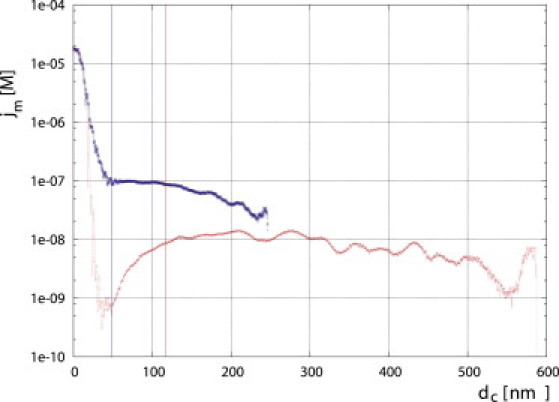
Loop closure probability (j-factor) as a function of the contour length for a 30 nm chromatin fiber with (blue x) and without (red +) linker histones. The red and blue vertical lines correspond to the persistence length of the fibers as calculated from the mean-squared end-to-end distance.
Conclusions
We have shown that histone depletions can have functional roles in gene regulation and are not only fiber defects. Histone depletion may even be crucial for gene regulation mechanisms, such as enhancer and silencer regions. Methylation, acetylation, phosphorylation, and other histone modifications facilitate these histone depletion effects, as well as DNA methylation, and thus contribute indirectly to gene regulation. On the other hand, methylation decreases linker histone and nucleosome depletion, and therefore leads to regular chromatin fibers, which (like the heterochromatin) are probably more inactive.
The simulation data of the chromatin fibers with depletion effects match the experimental FISH data (2) and the 5C data (1) much better than the simulation data of the regular fibers. Furthermore, only the loop length distribution of the disturbed chromatin fibers can explain the shape of the experimental loop length distribution. Together with the fact that even ordered chromatin fibers can bend easily into very tight loops, this is a strong indication that chromatin fibers in vivo may be far from perfectly ordered 30 nm fibers.
Acknowledgments
We thank Job Dekker for many fruitful discussions.
Footnotes
Philipp Diesinger's present address is Laboratory for Computational Cell Biology & Biophysics, Department of Biological Engineering, Massachusetts Institute of Technology, 77 Massachusetts Avenue, Cambridge, MA 02139.
Supporting Material
References
- 1.Dostie J., Richmond T.A., Dekker J. Chromosome conformation capture carbon copy (5C): a massively parallel solution for mapping interactions between genomic elements. Genome Res. 2006;16:1299–1309. doi: 10.1101/gr.5571506. [DOI] [PMC free article] [PubMed] [Google Scholar]
- 2.Bystricky K., Heun P., Gasser S.M. Long-range compaction and flexibility of interphase chromatin in budding yeast analyzed by high-resolution imaging techniques. Proc. Natl. Acad. Sci. USA. 2004;101:16495–16500. doi: 10.1073/pnas.0402766101. [DOI] [PMC free article] [PubMed] [Google Scholar]
- 3.Chakravarthy S., Park Y.J., Luger K. Structure and dynamic properties of nucleosome core particles. FEBS Lett. 2005;579:895–898. doi: 10.1016/j.febslet.2004.11.030. [DOI] [PubMed] [Google Scholar]
- 4.van Holde K. Springer-Verlag; New York: 1989. Chromatin. [Google Scholar]
- 5.van Holde K., Zlatanova J. Chromatin higher order structure: chasing a mirage? J. Biol. Chem. 1995;270:8373–8376. doi: 10.1074/jbc.270.15.8373. [DOI] [PubMed] [Google Scholar]
- 6.van Holde K., Zlatanova J. What determines the folding of the chromatin fiber? Proc. Natl. Acad. Sci. USA. 1996;93:10548–10555. doi: 10.1073/pnas.93.20.10548. [DOI] [PMC free article] [PubMed] [Google Scholar]
- 7.Schalch T., Duda S., Richmond T.J. X-ray structure of a tetranucleosome and its implications for the chromatin fibre. Nature. 2005;436:138–141. doi: 10.1038/nature03686. [DOI] [PubMed] [Google Scholar]
- 8.Bednar J., Horowitz R., Woodcock C. Nucleosomes, linker DNA, and linker histone form a unique structural motif that directs the higher-order folding and compaction of chromatin. Proc. Natl. Acad. Sci. USA. 1998;95:14173–14178. doi: 10.1073/pnas.95.24.14173. [DOI] [PMC free article] [PubMed] [Google Scholar]
- 9.Woodcock C.L., Grigoryev S.A., Whitaker N. A chromatin folding model that incorporates linker variability generates fibers resembling the native structures. Proc. Natl. Acad. Sci. USA. 1993;90:9021–9025. doi: 10.1073/pnas.90.19.9021. [DOI] [PMC free article] [PubMed] [Google Scholar]
- 10.Schiessel H., Gelbart W.M., Bruinsma R. DNA folding: structural and mechanical properties of the two-angle model for chromatin. Biophys. J. 2001;80:1940–1956. doi: 10.1016/S0006-3495(01)76164-4. [DOI] [PMC free article] [PubMed] [Google Scholar]
- 11.Dorigo B., Schalch T., Richmond T.J. Nucleosome arrays reveal the two-start organization of the chromatin fiber. Science. 2004;306:1571–1573. doi: 10.1126/science.1103124. [DOI] [PubMed] [Google Scholar]
- 12.Thoma F., Koller T., Klug A. Involvement of histone H1 in the organization of the nucleosome and of the salt-dependent superstructures of chromatin. J. Cell Biol. 1979;83:403–427. doi: 10.1083/jcb.83.2.403. [DOI] [PMC free article] [PubMed] [Google Scholar]
- 13.Finch J.T., Klug A. Solenoidal model for superstructure in chromatin. Proc. Natl. Acad. Sci. USA. 1976;73:1897–1901. doi: 10.1073/pnas.73.6.1897. [DOI] [PMC free article] [PubMed] [Google Scholar]
- 14.Widom J., Klug A. Structure of the 300A chromatin filament: X-ray diffraction from oriented samples. Cell. 1985;43:207–213. doi: 10.1016/0092-8674(85)90025-x. [DOI] [PubMed] [Google Scholar]
- 15.Depken M., Schiessel H. Nucleosome shape dictates chromatin fiber structure. Biophys. J. 2009;96:777–784. doi: 10.1016/j.bpj.2008.09.055. [DOI] [PMC free article] [PubMed] [Google Scholar]
- 16.Schiessel H. Topical review: the physics of chromatin. J. Phys. Condens. Matter. 2003;15:R699–R774. doi: 10.1088/0953-8984/27/6/060301. [DOI] [PubMed] [Google Scholar]
- 17.Richmond T.J., Davey C.A. The structure of DNA in the nucleosome core. Nature. 2003;423:145–150. doi: 10.1038/nature01595. [DOI] [PubMed] [Google Scholar]
- 18.Jenuwein T., Allis C.D. Translating the histone code. Science. 2001;293:1074–1080. doi: 10.1126/science.1063127. [DOI] [PubMed] [Google Scholar]
- 19.Kornberg R.D., Lorch Y. Twenty-five years of the nucleosome, fundamental particle of the eukaryote chromosome. Cell. 1999;98:285–294. doi: 10.1016/s0092-8674(00)81958-3. [DOI] [PubMed] [Google Scholar]
- 20.Wyrick J.J., Holstege F.C., Young R.A. Chromosomal landscape of nucleosome-dependent gene expression and silencing in yeast. Nature. 1999;402:418–421. doi: 10.1038/46567. [DOI] [PubMed] [Google Scholar]
- 21.Lia G., Praly E., Owen-Hughes T. Direct observation of DNA distortion by the RSC complex. Mol. Cell. 2006;21:417–425. doi: 10.1016/j.molcel.2005.12.013. [DOI] [PMC free article] [PubMed] [Google Scholar]
- 22.Widom J. Physicochemical studies of the folding of the 100 A nucleosome filament into the 300 A filament. Cation dependence. J. Mol. Biol. 1986;190:411–424. doi: 10.1016/0022-2836(86)90012-4. [DOI] [PubMed] [Google Scholar]
- 23.Fan Y., Nikitina T., Skoultchi A.I. Histone H1 depletion in mammals alters global chromatin structure but causes specific changes in gene regulation. Cell. 2005;123:1199–1212. doi: 10.1016/j.cell.2005.10.028. [DOI] [PubMed] [Google Scholar]
- 24.Routh A., Sandin S., Rhodes D. Nucleosome repeat length and linker histone stoichiometry determine chromatin fiber structure. Proc. Natl. Acad. Sci. USA. 2008;105:8872–8877. doi: 10.1073/pnas.0802336105. [DOI] [PMC free article] [PubMed] [Google Scholar]
- 25.Widom J. A relationship between the helical twist of DNA and the ordered positioning of nucleosomes in all eukaryotic cells. Proc. Natl. Acad. Sci. USA. 1992;89:1095–1099. doi: 10.1073/pnas.89.3.1095. [DOI] [PMC free article] [PubMed] [Google Scholar]
- 26.Aumann F., Shnel J., Diekmann S. Rigid assembly and Monte Carlo models of stable and unstable chromatin structures: the effect of nucleosomal spacing. Theor. Chem. Acc. 2010;125:217–231. [Google Scholar]
- 27.Dekker J. A closer look at long-range chromosomal interactions. Trends Biochem. Sci. 2003;28:277–280. doi: 10.1016/S0968-0004(03)00089-6. [DOI] [PubMed] [Google Scholar]
- 28.Liu Z., Garrard W.T. Long-range interactions between three transcriptional enhancers, active Vκ gene promoters, and a 3′ boundary sequence spanning 46 kilobases. Mol. Cell. Biol. 2005;25:3220–3231. doi: 10.1128/MCB.25.8.3220-3231.2005. [DOI] [PMC free article] [PubMed] [Google Scholar]
- 29.Murrell A., Heeson S., Reik W. Interaction between differentially methylated regions partitions the imprinted genes Igf2 and H19 into parent-specific chromatin loops. Nat. Genet. 2004;36:889–893. doi: 10.1038/ng1402. [DOI] [PubMed] [Google Scholar]
- 30.Palstra R.J., Tolhuis B., de Laat W. The β-globin nuclear compartment in development and erythroid differentiation. Nat. Genet. 2003;35:190–194. doi: 10.1038/ng1244. [DOI] [PubMed] [Google Scholar]
- 31.Spilianakis C.G., Flavell R.A. Long-range intrachromosomal interactions in the T helper type 2 cytokine locus. Nat. Immunol. 2004;5:1017–1027. doi: 10.1038/ni1115. [DOI] [PubMed] [Google Scholar]
- 32.Tolhuis B., Palstra R.J., de Laat W. Looping and interaction between hypersensitive sites in the active β-globin locus. Mol. Cell. 2002;10:1453–1465. doi: 10.1016/s1097-2765(02)00781-5. [DOI] [PubMed] [Google Scholar]
- 33.Dekker J. The three ‘C’ s of chromosome conformation capture: controls, controls, controls. Nat. Methods. 2006;3:17–21. doi: 10.1038/nmeth823. [DOI] [PubMed] [Google Scholar]
- 34.Simonis M., Kooren J., de Laat W. An evaluation of 3C-based methods to capture DNA interactions. Nat. Methods. 2007;4:895–901. doi: 10.1038/nmeth1114. [DOI] [PubMed] [Google Scholar]
- 35.Mateos-Langerak J., Bohn M., Goetze S. Spatially confined folding of chromatin in the interphase nucleus. Proc. Natl. Acad. Sci. USA. 2009;106:3812–3817. doi: 10.1073/pnas.0809501106. [DOI] [PMC free article] [PubMed] [Google Scholar]
- 36.Yokota H., van den Engh G., Trask B.J. Evidence for the organization of chromatin in megabase pair-sized loops arranged along a random walk path in the human G0/G1 interphase nucleus. J. Cell Biol. 1995;130:1239–1249. doi: 10.1083/jcb.130.6.1239. [DOI] [PMC free article] [PubMed] [Google Scholar]
- 37.Grosberg A., Khokhlov A. AIP Press; New York: 1994. Statistical Physics of Macromolecules. [Google Scholar]
- 38.Rippe K., von Hippel P.H., Langowski J. Action at a distance: DNA-looping and initiation of transcription. Trends Biochem. Sci. 1995;20:500–506. doi: 10.1016/s0968-0004(00)89117-3. [DOI] [PubMed] [Google Scholar]
- 39.Wiggins P.A., van der Heijden T., Nelson P.C. High flexibility of DNA on short length scales probed by atomic force microscopy. Nat. Nanotechnol. 2006;1:137–141. doi: 10.1038/nnano.2006.63. [DOI] [PubMed] [Google Scholar]
- 40.Wedemann G., Langowski J. Computer simulation of the 30-nanometer chromatin fiber. Biophys. J. 2002;82:2847–2859. doi: 10.1016/S0006-3495(02)75627-0. [DOI] [PMC free article] [PubMed] [Google Scholar]
- 41.Aumann F., Lankas F., Langowski J. Monte Carlo simulation of chromatin stretching. Phys. Rev. E Stat. Nonlin. Soft Matter Phys. 2006;73:041927. doi: 10.1103/PhysRevE.73.041927. [DOI] [PubMed] [Google Scholar]
- 42.Kepper N., Foethke D., Rippe K. Nucleosome geometry and internucleosomal interactions control the chromatin fiber conformation. Biophys. J. 2008;95:3692–3705. doi: 10.1529/biophysj.107.121079. [DOI] [PMC free article] [PubMed] [Google Scholar]
- 43.Diesinger P.M., Heermann D.W. Two-angle model and phase diagram for chromatin. Phys. Rev. E Stat. Nonlin. Soft Matter Phys. 2006;74:031904. doi: 10.1103/PhysRevE.74.031904. [DOI] [PubMed] [Google Scholar]
- 44.Diesinger P.M., Heermann D.W. Depletion effects massively change chromatin properties and influence genome folding. Biophys. J. 2009;97:2146–2153. doi: 10.1016/j.bpj.2009.06.057. [DOI] [PMC free article] [PubMed] [Google Scholar]
- 45.Diesinger P.M., Heermann D.W. The influence of the cylindrical shape of the nucleosomes and H1 defects on properties of chromatin. Biophys. J. 2008;94:4165–4172. doi: 10.1529/biophysj.107.113902. [DOI] [PMC free article] [PubMed] [Google Scholar]
- 46.Bednar J., Horowitz R.A., Woodcock C.L. Chromatin conformation and salt-induced compaction: three-dimensional structural information from cryoelectron microscopy. J. Cell Biol. 1995;131:1365–1376. doi: 10.1083/jcb.131.6.1365. [DOI] [PMC free article] [PubMed] [Google Scholar]
- 47.Metropolis N., Rosenbluth A., Teller E. Equations of state calculations by fast computing machines. J. Chem. Phys. 1953;21:1087–1092. [Google Scholar]
- 48.Binder K., Heermann D. Springer; New York: 2002. Monte Carlo Simulations in Statistical Physics. [Google Scholar]
- 49.Segal, E. 2008. Average nucleosome occupancy for the whole yeast genome.
- 50.Gotta M., Laroche T., Gasser S.M. The clustering of telomeres and colocalization with Rap1, Sir3, and Sir4 proteins in wild-type Saccharomyces cerevisiae. J. Cell Biol. 1996;134:1349–1363. doi: 10.1083/jcb.134.6.1349. [DOI] [PMC free article] [PubMed] [Google Scholar]
- 51.Heun P., Laroche T., Gasser S.M. The positioning and dynamics of origins of replication in the budding yeast nucleus. J. Cell Biol. 2001;152:385–400. doi: 10.1083/jcb.152.2.385. [DOI] [PMC free article] [PubMed] [Google Scholar]
- 52.Straight A.F., Belmont A.S., Murray A.W. GFP tagging of budding yeast chromosomes reveals that protein-protein interactions can mediate sister chromatid cohesion. Curr. Biol. 1996;6:1599–1608. doi: 10.1016/s0960-9822(02)70783-5. [DOI] [PubMed] [Google Scholar]
- 53.Flory P. Cornell University Press; Ithaca, NY: 1953. Principles of Polymer Chemistry. [Google Scholar]
- 54.Cloutier T.E., Widom J. Spontaneous sharp bending of double-stranded DNA. Mol. Cell. 2004;14:355–362. doi: 10.1016/s1097-2765(04)00210-2. [DOI] [PubMed] [Google Scholar]
Associated Data
This section collects any data citations, data availability statements, or supplementary materials included in this article.