

Abstract
Many fundamental cellular and extracellular processes in the body are mediated by enzymes. At the single molecule level, enzyme activity is influenced by mechanical forces. However, the effects of mechanical forces on the kinetics of enzymatic reactions in complex tissues with intact extracellular matrix (ECM) have not been identified. Here we report that physiologically relevant macroscopic mechanical forces modify enzyme activity at the molecular level in the ECM of the lung parenchyma. Porcine pancreatic elastase (PPE), which binds to and digests elastin, was fluorescently conjugated (f-PPE) and fluorescent recovery after photobleach was used to evaluate the binding kinetics of f-PPE in the alveolar walls of normal mouse lungs. Fluorescent recovery after photobleach indicated that the dissociation rate constant (koff) for f-PPE was significantly larger in stretched than in relaxed alveolar walls with a linear relation between koff and macroscopic strain. Using a network model of the parenchyma, a linear relation was also found between koff and microscopic strain on elastin fibers. Further, the binding pattern of f-PPE suggested that binding sites on elastin unfold with strain. The increased overall reaction rate also resulted in stronger structural breakdown at the level of alveolar walls, as well as accelerated decay of stiffness and decreased failure stress of the ECM at the macroscopic scale. These results suggest an important role for the coupling between mechanical forces and enzyme activity in ECM breakdown and remodeling in development, and during diseases such as pulmonary emphysema or vascular aneurysm. Our findings may also have broader implications because in vivo, enzyme activity in nearly all cellular and extracellular processes takes place in the presence of mechanical forces.
Introduction
Many fundamental cellular and extracellular processes in the body are mediated by enzymes (1) in nonhomogenous environments continuously perturbed by factors such as mechanical forces. In contrast, most studies characterize enzyme activity in homogeneous dilute solutions (2–4). At the single molecule level, enzyme activity is influenced by mechanical forces (5–7). However, the effects of mechanical forces on the kinetics of enzymatic reactions in complex tissues with intact extracellular matrix (ECM) have not been identified.
One of the most important load-bearing components of the ECM in many tissues is elastin, because it provides the ECM with appropriate elasticity (8). Enzymatic degradation of elastin compromises the mechanical function of vessel walls (9) and lung parenchyma (10). In most tissues, the ECM is also under a tensile stress (prestress), and hence mechanical forces act simultaneously with enzymatic activity. The tension on fibrils should exert a higher force on individual molecular bonds, which may alter local chemical reaction rates. Here we tested this hypothesis by measuring the mechanical properties of lung tissue strips during porcine pancreatic elastase (PPE)-induced digestion in the presence of prestress. To investigate the underlying mechanism, the binding kinetics of fluorescently labeled PPE (f-PPE) was determined using fluorescent recovery after photobleach (FRAP).
Materials and Methods
The animal protocol was approved by the Animal Care and Use Committee of Boston University.
Tissue preparation
Healthy male C57Bl/6 mice weighing 24–26 grams were anesthetized with injection of 70 mg/kg of pentobarbital sodium. Lungs were perfused with phosphate-buffered saline (PBS) through the right ventricle, then excised and sliced into strips with approximate dimensions of 6 × 4 × 1 mm.
Stretching apparatus
Uniaxial quasistatic stress-strain curves were obtained as previously described (11,12). Briefly, a computer-controlled lever arm (model 300B; Aurora Scientific, Ontario, Canada) that also serves as a force transducer, and a more sensitive force transducer (model 403A; Aurora Scientific), were attached to an acrylic base housing a 22 mL tissue bath that was maintained at a temperature of 37°C. Small, thin metal plates (5 mm × 5 mm) were glued to each end of the strip, 5 mm apart with cyanoacrylate. The strip was attached to steel wires connected to the force transducer and lever-arm via the metal plates and remained submerged in the bath. Displacement signals were led through a digital-to-analog converter and low-pass filtered at 10 Hz before being sent to the lever arm. The force response was low-pass filtered at 10 Hz and sampled at a rate of 30 Hz. The alignment and accuracy of the system was tested by measuring the mechanical properties of a steel spring of known stiffness.
Tissue mechanics
The tissue strip was preconditioned by applying three triangular displacement signals peaking at 40% macroscopic strain (ɛm) at a rate of 0.75%/s. After a 5-min equilibration period, a baseline stress-strain curve was obtained. Depending on the condition, elastase (0.006 μg/μL, EC134; Elastin Products, Owensville, MI) was added to the bath and mechanical loading (0% or 40% static strain) was applied. Using a triangular displacement signal delivered in 30 s, stress-strain measurements were taken at regular intervals for 1 h. At the end of the 1 h protocol, a failure test was carried out by stretching the sample to complete failure. The force during this test was measured with the insensitive transducer built into the lever arm system. Stress and strain were calculated as the force divided by the initial cross-sectional area and the displacement divided by the initial length of the strip, respectively. The stress-strain curves were fit with a fourth-order polynomial and the slope at 25% strain was used as an estimate of the incremental modulus, Y, of the sample. If plastic deformation occurred due for example to microrupture during the 60-min protocol, it could have resulted in an increase in the initial length of the samples. Measurements in three samples, however, suggested that any increase in initial length was <5% and was taken into account by shifting the strain axis such that force development started just above zero strain.
Structure
After the 1 h testing, tissue structure was imaged using a laser scanning confocal microscope at 20× (FV-1000; Olympus, Melville, NY). No labeling was necessary because native collagen and elastin are autofluorescent between 500 and 600 nm which was excited by a 488-nm argon laser. Using ImageJ software (National Institutes of Health, Bethesda, MD), alveolar morphology was quantified by calculating the equivalent diameter (Deq) and the aspect ratio as an index of shape distortion of individual airspaces. Deq was obtained by measuring the area of an airspace and determining the diameter of a circle having the same area as the airspace. The aspect ratio was obtained by first fitting an ellipse to the outline of the airspace and calculating the ratio of the major and minor axes of the ellipse. An index significantly larger than 1 indicates distortion of the airspace from a circular shape.
Samples evaluated both mechanically and structurally included four groups: controls without stretch (control); samples stretched without enzyme (stretched control); samples digested with PPE without stretch (PPE); and samples stretched in the presence of PPE (stretched PPE). Because there were no differences between the control and stretched control groups, the data were combined under control.
Fluorescent porcine pancreatic elastase
A Dylight labeling kit (Pierce, Rockford, IL) was used to create fluorescently labeled PPE (f-PPE) for visualization of PPE at 633 nm with the laser scanning confocal microscope. Briefly, 0.5 mL of 1 mg/mL elastase in PBS was added to the Dylight Reagent containing a 633 nm fluorophore and vortexed gently. The mixture was incubated for 120 min at room temperature, protected from light. The labeling reaction was placed in a spin column with purification resin and centrifuged to collect f-PPE only. A bicinchoninic acid protein concentration assay (Pierce) was performed to determine the final concentration of the f-PPE.
Preparation of elastin hydrogels
Elastin hydrogels were prepared from purified elastin (ES60; Elastin Products) by a cross-linking reaction using β-[Tris (hydroxymethyl) phosphino] proprionic acid (THPP) (Pierce). An aliquot of 75 μL of 200 μg/μL THPP in sodium phosphate-buffered saline (PBS, Pierce) was mixed by vigorous pipetting with 450 μL of 40 or 20 μg/μL of ES60 in PBS at pH 7.5 at 4°C. The mixture was then incubated at 37°C for 1 h. The fully cross-linked hydrogels were quenched in distilled, deionized water at 4°C overnight to remove unreacted THPP, salts, and free phosphates and then the hydrogels were stored at 4°C in their swollen state in PBS until confocal microscopy.
Binding kinetics
The binding of f-PPE to elastin was monitored by fluorescent recovery after photobleaching (FRAP) (13). Lung tissue strip samples were immersed in PBS in a glass bottom dish which was placed atop the confocal microscope objective. f-PPE was then added to the bath, bringing its final concentration to 0.006 μg/μL. In the stretched groups, the initial length of the sample was measured using precision calipers. The strip was then strained uniaxially to 40% or 80% strain by using a small metal frame and fixed at both ends with cyanoacrylate glue. The tissue was incubated at room temperature with the f-PPE for 45 min to reach equilibrium before the FRAP experiment was started. The FRAP experiments were conducted on unstretched (n = 7) and stretched samples (n = 11).
During FRAP, the fluorescent emission of a small circular region on a specific alveolar wall was measured after equilibration with f-PPE. Next, an intense pulse (3 s) of photobleaching light was directed to this region eliminating both autofluorescence of tissue and fluorescence of f-PPE. At the end of the photobleaching defined as time 0, the recovery of fluorescence associated with new f-PPE diffusing into the photobleached region and binding to elastin was measured until the fluorescent intensity did not change in time. In the unstretched tissue, FRAP was performed on randomly selected walls. In the stretched condition, walls parallel to the direction of macroscopic strain were specifically chosen as target regions. At 40% strain, FRAP was also carried out along walls perpendicular to the macroscopic strain. A video (Movie S1) of a FRAP measurement is included in the Supporting Material.
Data analysis was undertaken using MATLAB (The MathWorks, Natick, MA). Several normalizing and adjustment procedures were implemented before fitting the FRAP recovery curves with a model. First, due to stress relaxation, alveolar walls did not always remain stationary. This caused motion artifacts which were eliminated by calculating the two-dimensional cross-correlation between the first image and all subsequent images in the autofluorescent channel during recovery. The lung tissue is hollow; it includes air spaces filled with fluid, the fluid phase as well as alveolar septal wall tissue, the solid phase. Because reaction only occurs in the solid phase, the fluid phase was removed by making a mask of the tissue region by thresholding so that the actual recovery signal included only the bleached tissue. Additionally, the entire imaging region was used to calculate the average fluorescent intensity as a measure of the decay in fluorescence due to acquisition bleaching. Finally, the intensity was normalized so that its value just before photobleaching was unity.
We used a diffusion-uncoupled FRAP model originally defined by Bulinski et al. (14) to estimate the binding kinetics of f-PPE on lung tissue. Briefly, the binding parameters were determined by fitting the fluorescent recovery signal after photobleaching, FRAP(t), with a single exponential (14),
where a and b are parameters and the time constant is inversely related to the dissociation rate koff of the unbinding reaction.
We also measured the fluorescence intensity on alveolar walls that were parallel or perpendicular to the direction of strain. After reaching equilibrium, the tissue strips were stretched to the desired strain, 40% or 80%, and promptly imaged. Multiple stacked images at successive Z positions were collected. The confocal settings including Z-step size were matched to the microscope objective to optimize optical sectioning.
Modeling
Hexagonal network model
A previous hexagonal network model of the lung tissue (12) was used to predict the mean and variability of microstrain (ɛμ) on alveolar walls as a function of macrostrain ɛm. The model was a prestressed network of nonlinear springs arranged in a hexagonal lattice. The relation between force (f) and displacement (dx) of the springs in this network was given by
where k0 is the linear spring constant and k1 is the nonlinear spring constant. The aspect ratio of the hexagonal cells in this network is 1, which is equal to the aspect ratio of the alveolar airspaces in the unstretched lung tissue. Before applying a uniaxial stretch, the top and bottom boundaries of the network were set free so that when the network was stretched horizontally, the boundaries were allowed to move inward. Additionally, angular springs that resist bending of individual springs were added to the network so that the total energy E of the network was
where the indices s and a run over the springs and angles in the network, r is the torsional spring constant, and dθ is the change in angle between two neighboring springs.
The network was stretched uniaxially from ɛm = 0 to 0.4 and then to 0.8. At each ɛm, the equilibrium configuration of the network was determined by minimizing the total energy of the network. As the network was stretched, the individual springs began to align with the direction of stretch; this alignment was opposed by the angular springs trying to maintain the original angle between the springs. The overall alignment of springs at a given ɛm can be quantified by measuring the aspect ratio of the hexagonal cells. In the absence of angular springs (r = 0), the springs can align easily in the direction of stretch, giving rise to higher aspect ratios compared to a network which has angular springs (r > 0). The parameters k0 and k1 were set to 1 and 10, respectively, based on previous modeling of lung tissue (12). The value of r = 0.2 was found by adjusting it until the aspect ratio of the hexagonal cells matched the aspect ratio of the alveolar airspaces both at ɛm = 0.4 and 0.8.
At each strain level, we separated springs that were within two-hop distance of the boundary (boundary springs), and those further than two-hop distance from the boundary were considered to be interior springs. Individual strains for boundary springs that were within 20° of the direction of macroscopic strain were recorded. These values were then used to calculate the mean and standard deviation of the ɛμ as a function of ɛm. The absolute values of the spring constants k0 and k1 can be obtained by scaling the stress in the model to the stress in the tissue. It was shown in Cavalcante et al. (12) that the corresponding scaling factor for normal alveolar wall is 4 × 10⁻³ and consequently the absolute values of k0 and k1 are 4 × 10⁻³ N/m and 4 × 10⁻² N/m2.
FRAP model
We considered the following binding-unbinding reaction,
where the free enzymes E bind to empty binding sites B at a rate kon to form complexes EB and subsequently unbind at a rate koff. In addition to the reaction, the free enzymes E can diffuse through the fluid filled airspaces and tissue with a diffusion constant D. Due to lack of data on the diffusion of elastase in the tissue, we assume that the diffusion constant in the tissue and in airspaces is identical. However, the substrate and the bound complex are assumed immobile. The set of reaction-diffusion equations governing the process is given by
| (1) |
where E, B, and EB are the concentrations of the free enzymes, empty binding sites, and complexes, respectively.
Equilibrium occurs when all spatial diffusion processes and local reaction processes reach a steady state. Thus, all time and space derivatives of the concentration variables are 0. The corresponding variables will be denoted by underline. At equilibrium, the concentration of free enzyme is constant throughout the tissue and airspaces, because we assumed that D in the tissue and in the airspaces is identical. In the tissue, the concentration of free binding sites is B and that of bound complexes is EB. Thus, Eq. 1 yields
| (2) |
We assume that V0 is the volume of airspaces and V1 is the volume of tissue. The concentration of binding sites is 0 in the airspaces and B0 in the tissue. Thus,
| (3) |
where ET is the total amount of enzyme in the system. We can thus solve Eqs. 2 and 3 to obtain
| (4) |
where
We note that η, β, and κ have dimensions of concentration whereas λ is dimensionless. The variables η and β are scaled versions of ET and B0. If B0 increases with stretch, so does β. The variable κ on the other hand is the ratio of the binding rates which increases with koff and decreases with kon. The total fluorescence observed from regions of tissue is the sum of the fluorescence due to the free enzymes and the fluorescence due to the bound enzymes, and is given by E+EB. Numerical simulations were used to study the effect of β and κ on the total observed fluorescence at equilibrium.
Statistical analysis
Alveolar dimensions and FRAP parameters were compared using one-way ANOVA. Two-way repeated measure ANOVA was used to analyze time-course experiments. Pairwise comparisons were analyzed through the Student-Newman-Keuls method. Variances were compared via F-tests. Statistical significance was defined as p < 0.05.
Results and Discussion
Fig. 1 A shows the effect of 1 h PPE digestion on the stress-strain curve both in the presence and absence of prestress generated by 40% static uniaxial macroscopic strain, ɛm = 0.4. PPE alone decreased the slope of the curve which was significantly more pronounced during digestion under stretch. The Young's modulus, Y, of the strips normalized by its baseline value (Yn) was obtained as a function of time. The control groups with and without stretch showed no time dependence and were not statistically significantly different (see the Supporting Material). This suggests that passive stress relaxation did not contribute to our data, and hence a single control group was formed including all strips that were not exposed to PPE.
Figure 1.
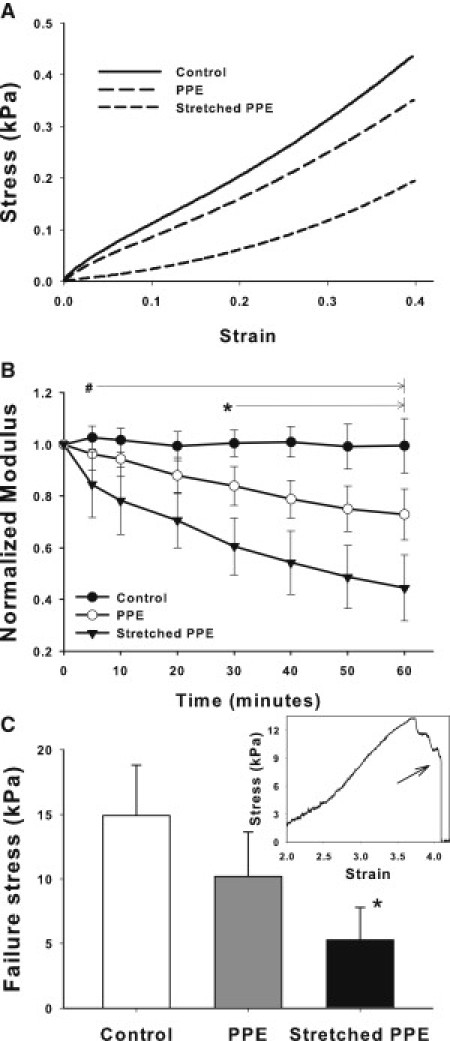
(A) Representative stress-strain curves obtained in normal mouse lung tissue before treatment (control) and after 1 hour of porcine pancreatic elastase (PPE) digestion in the absence or presence of static 40% uniaxial stretch. (B) Means and SDs of the normalized modulus Yn as a function of time for control, PPE, and stretched PPE conditions. # denotes a statistically significant difference between the stretched PPE group and the other conditions. ∗ denotes a statistically significant difference between the PPE and the control groups. (C) Failure stress measured at the end of 1 h protocol for the three groups. ∗ denotes a statistically significant difference between the stretched PPE and the control groups. The inset shows an example failure stress-strain curve and the arrow indicates the failure stress.
The Yn showed a marked decrease in the PPE group compared to control (Fig. 1 B). The stretched PPE group showed a rapid decrease in Yn, and by the end of 1 h, Yn dropped by 56% as opposed to ∼27% in the PPE group, resulting in a significant interaction between treatment and time (p < 0.001). The mechanical integrity of the ECM characterized by the failure stress was significantly compromised in the stretched PPE group compared to the other groups (Fig. 1 C).
Images of the structure were obtained by following the 1 h protocol. In the control group, the alveoli were nearly round (Fig. 2), with equivalent diameters (Deq) of 24.56 ± 6.42 μm. Compared to control, degradation by PPE alone increased Deq to 34.1 ± 12.8 μm (p < 0.05) whereas PPE combined with stretch further increased Deq to 39.46 ± 16.99 μm (p < 0.05). The latter groups also had a higher variance of Deq than the other groups (p < 0.01). The aspect ratio characterizing the deviation from a circle increased from 1.31 ± 0.21 (control) and 1.24 ± 0.18 (PPE) to 1.58 ± 0.48 in the stretched PPE group (p < 0.05). Because the images were taken in the unstretched state, the distortion of the alveolar structure implies that mechanical failure of alveolar walls in the tissue induced permanent shape changes.
Figure 2.
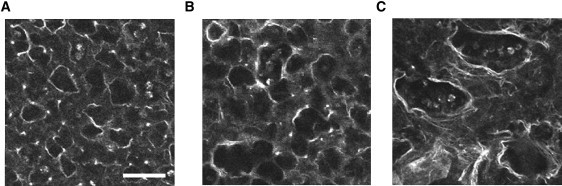
Autofluorescent images showing alveolar structure at 1 h taken in the unstretched condition of the tissue strips. The left, middle, and right panels show images in the control, the PPE digested, and the PPE digested in the presence of 40% static uniaxial strain, respectively. Note the significantly increased aspect ratio after digestion under stretch. Scale bar denotes 50 μm.
To elucidate the interaction between mechanical forces and enzyme activity, f-PPE was applied to lung strips to visualize binding and study its kinetics using FRAP. For ɛm = 0, the f-PPE labeled alveolar walls retained near-circular geometries (Fig. 3 A, top row). When the tissue was held at ɛm = 0.4 or ɛm = 0.8, the alveolar wall network reoriented, with walls parallel to the direction of uniaxial strain becoming stretched whereas walls perpendicular to macroscopic strain remained relaxed. Fig. 3 A (bottom row) demonstrates a typical FRAP experiment in a circular region. After equilibration (left), the wall exhibits a nearly uniform red f-PPE signal. At time 0, the region was bleached (middle), resulting in no fluorescence. Later, the fluorescence recovered (right), as unbleached f-PPE diffused into the region and replaced the bleached enzymes. The recovery in the bleached region displayed a faster rise when FRAP was repeated at ɛm = 0.4 (Fig. 3 B).
Figure 3.
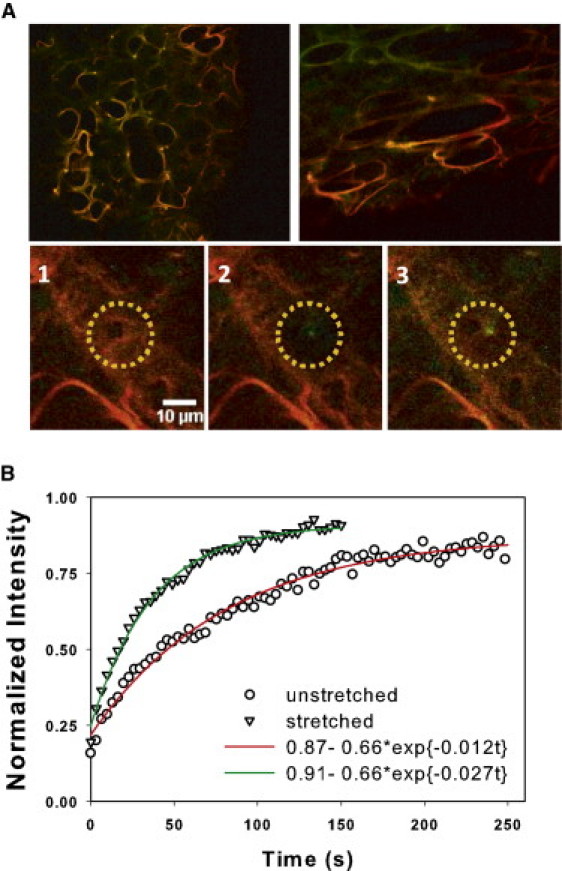
(A) Top row shows a control sample (left) after equilibration and a stretched sample (right) before full equilibration with f-PPE. For the stretched sample, strain is in the horizontal direction. (Green) Autofluorescence; (red) f-PPE signal. (Bottom row) Three images of a region before FRAP (left), after photobleaching (middle), and after near full recovery (right). (B) Example of normalized FRAP curves from a relaxed (circles) and a stretched (triangles) alveolar wall. The fluorescent intensity was normalized to 1 at time 0 corresponding to the average intensity of the bleached region (yellow circle) on the left panel in A. (Solid lines) Single exponential model fits.
A single exponential fit was used to estimate the dissociation rate koff. The values of koff in unstretched tissue and along parallel fibers in stretched tissue at ɛm = 0.4 and ɛm = 0.8 were significantly different from each other (p < 0.001), with koff displaying a near-linear dependence on ɛm (Fig. 4): koff = 0.023ɛm + 0.017 with r2 = 0.973. At ɛm = 0.4, FRAP was also carried out on walls perpendicular to the macroscopic strain. No significant difference in koff was found between the unstretched and perpendicular walls at ɛm = 0.4, but there was a difference between parallel and perpendicular walls at ɛm = 0.4 (p < 0.03). Additionally, the variance of koff was higher along parallel than perpendicular walls (p < 0.01). At ɛm = 0.8, segment lengths along perpendicular walls were too short to carry out FRAP.
Figure 4.
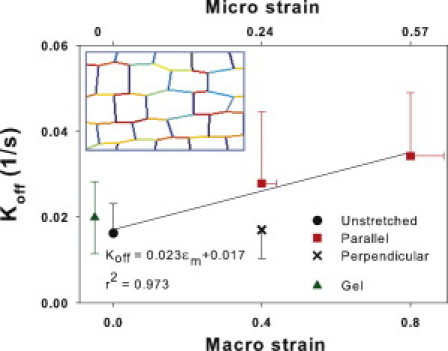
Means and SDs of estimated dissociation rates, koff, as a function of uniaxial macroscopic strain ɛm (bottom x axis) in unstretched samples (solid circle) and at ɛm of 0.4 and 0.8 (squares) measured on walls that had a direction parallel to macroscopic strain. At em = 0.4, koff was also measured along walls that were perpendicular to the macroscopic strain (cross). Inset shows a region of a nonlinear elastic network at em = 0.4 that was used to predict the average microscopic strain ɛμ (top horizontal axis) on the walls parallel to macroscopic strain. The shades (colors in the Supporting Material) represent local microscopic strain darker (red) denoting higher strains. Note the large variability among horizontal segments. The SD of ɛμ is plotted as horizontal error bars. The solid line shows the linear regression. The mean and SD of koff measured in pure elastin hydrogel is also shown (triangle).
To relate koff to the microscopic strain ɛμ on fibers, we used a network model of the parenchyma (12), optimized such that the aspect ratio of the network cells matched that of the alveoli up to ɛm = 0.8. Fig. 5 demonstrates that to a good approximation, a linear relationship holds between micro and macro strains: ɛμ = 0.72 ɛm − 0.0159 with r2 = 0.99. The small nonzero intercept is a result of the slight curvature seen in the data. Using this relation, we can also express koff as a function of ɛμ (see Fig. 4, top horizontal axis). Interestingly, this relationship also remained approximately linear: koff = 0.031 ɛμ + 0.018 with r2 = 0.936, implying a stronger increase of koff with ɛμ than ɛm due to the fact that folding also contributes to the latter. In addition, the network also predicted a significant increase in variability in local microscopic strain on parallel fibers (p < 0.001), which resulted in the increased variability of koff at higher ɛm.
Figure 5.
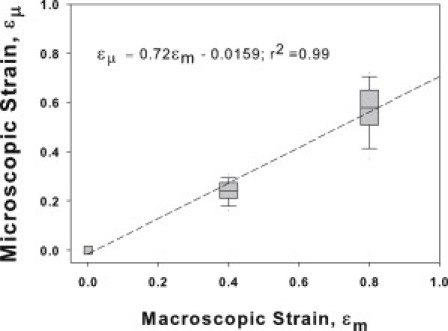
Microscopic strain as a function of uniaxial macroscopic strain in the hexagonal network model of the lung tissue. (Line) Linear regression.
Previous studies have used labeled elastase in binding experiments with no loss in enzyme activity (15). To determine the effect of docking the fluorophore (∼1.066 kDa) onto the enzyme (∼25.9 kDa), an activity assay indicated 18% loss of activity (p < 0.03), whereas mechanical measurements showed a 9.1% smaller stiffness (p < 0.001) in tissues digested with f-PPE compared to PPE (see the Supporting Material). The mechanical assays were also repeated at room temperature using f-PPE. Although f-PPE still induced a substantial decrease in Yn to 0.59 ± 0.11 by 60 min, this drop was less than during PPE at 37°C (0.44 ± 0.13; p < 0.05).
The single exponential fit to the FRAP curves assumes that enzyme diffusion is much faster than the reaction rates. We examined the validity of this assumption in several ways.
First, in a subset of FRAP recordings, we split the bleach spot into an outer ring and an inner circle with equal areas and found that koff was similar in the two regions. We then repeated the analysis by splitting the bleach spot into four equal quadrants and again found that koff was similar in all four regions. These analyses suggest that diffusion has little effect on the FRAP curves.
Second, if diffusion was important, the recovery curve should deviate from a single exponential (13). To quantify the goodness of fits, we evaluated the residuals, which showed no bias—suggesting no systematic deviation from the exponential recovery.
Third, we used a full diffusion-reaction system to mimic FRAP on a single fiber (see the Supporting Material). Briefly, we set up a model system consisting of a rectangular fiber embedded in a circular airspace. The enzyme diffusion was similar in the airspace and along the fiber, whereas reaction took place only on the fiber. We also assumed that the binding site density on the fiber is large compared to the initial enzyme density which decouples the evolution of the bleached and unbleached enzymes and renders the equations linear. After equilibration, a small bleach spot was created in the middle of the fiber. The diffusion and reaction in the whole region was solved and the FRAP curve was obtained as the sum of free and bound enzymes in the bleach spot as a function of time. We found that the theoretical koff could be estimated within 10% as long as the reaction time (1/koff + 1/kon) was at least an order-of-magnitude larger than the diffusion time where kon is the binding on rate. Thus, we conclude that for f-PPE in lung tissue, FRAP is diffusion-uncoupled and the estimation of koff is reliable.
Another key assumption in FRAP is that the binding sites are part of an immobile structure with a constant concentration B0. Although this may be reasonable when FRAP is applied in cells (16), f-PPE also catalyses binding sites. For human leukocyte elastase, as the catalysis proceeds, new binding sites become accessible (17). If digestion opened up significantly more binding sites than it destroyed, the fluorescent intensity should increase until the entire fiber becomes fragmented. Because this was not observed, we conclude that B0 was relatively constant during the time of FRAP (∼2 min). To test the influence of other ECM molecules on koff, we measured koff in pure elastin hydrogel and found it to be in good agreement with that of the lung tissue at ɛm = 0 (Fig. 4, green triangle). This suggests that koff in the lung tissue is determined primarily by lung elastin.
As Fig. 3 A (top row) suggests, the intensity of f-PPE was anisotropic. In a subset of images, we analyzed both the autofluorescence and f-PPE signals from the same region at ɛm = 0.4. Although there was no anisotropy in autofluorescence, the f-PPE-labeled walls parallel to strain displayed a larger normalized intensity (1.37 ± 0.32) than walls perpendicular to strain (1.00 ± 0.33; p = 0.002). Next, limiting the analysis to the walls parallel to macroscopic strain, we found a linear relation between normalized intensity and both ɛm and ɛμ (Fig. 6 A), implying a stretch-induced increase in f-PPE bound to elastin.
Figure 6.
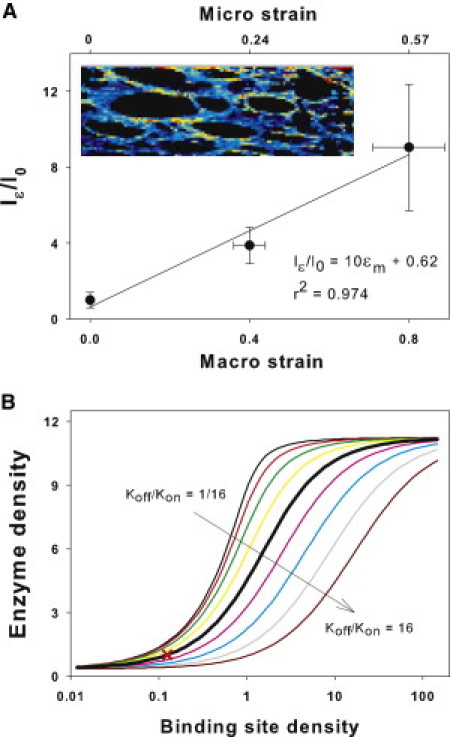
(A) Fluorescent intensity on alveolar walls parallel to macroscopic strain (Iɛ) normalized to mean intensity in the unstretched samples (I0) as a function of macroscopic and microscopic strains, as described in Fig. 3's legend. (Inset) Zoom into an alveolar region with brighter shades (shown in colors in the Supporting Material) representing high f-PPE intensity normalized by the autofluorescent intensity. The shades (colors) demonstrate a strong anisotropy as well as heterogeneity in labeling along parallel wall segments. (B) Sensitivity of model-based total enzyme concentration on a fiber, as a surrogate for fluorescent intensity, to variations in binding site density B0 for a range of binding on rates kon based on Eq. 4. (Thick black line) Baseline model for which B0 = 1/8 corresponds to unit enzyme concentration (cross).
To investigate whether the increased binding was due to an increase in B0 or kon, we examined the sensitivity of total enzyme concentration, bound and unbound, as a surrogate of fluorescence, to changes in B0 and kon by modifying a published FRAP model and solving for the equilibrium conditions (see Eqs. 1–4). The eightfold increase in fluorescence observed experimentally (Fig. 6 A) can be achieved by increasing B0 alone (Fig. 6 B). However, taking into account the stretch dependence of koff from Fig. 3, kon would need to increase >500 times to achieve an eightfold increase in fluorescence and this could be obtained only in the narrow range about B0 = 1. Further, we explored this experimentally as follows. In three tissue strips after equilibration with f-PPE at ɛm = 0, ɛm was quickly raised to 0.4, which resulted in an immediate fourfold increase in fluorescence as in Fig. 6 A. Next, ɛm was quickly returned to 0 while imaging was continued for 10 min. If we assume that the sudden stretch induced an increase in kon without a change in B0, then upon relaxing the tissue, the fluorescence should have returned to the same level as before stretch over a timescale of 1/koff ≈ 1 min. However, fluorescence decreased only to 93% of its value at ɛm = 0.4. This can be explained if the binding sites together with the bound f-PPE became trapped upon releasing the stretch, and hence, the enzymes were unable to leave the elastin fiber. These results are consistent with the notion that physiologically relevant stretching of the ECM unfolds binding sites along individual elastin fibers in lung tissue.
The possibility arises that the increased rate of stiffness decline in the stretched samples (Fig. 1 B) is a result of the stretch-induced decrease in thickness and increase in surface area of the tissue strips. Due to the strong binding of elastase to elastin, f-PPE concentrated onto alveolar walls within a few alveolar radii from the surface of the strip (Fig. 3 A, top row). This suggests that the elastase did not diffuse deep into the tissue. Hence, the digestion was not influenced by the thickness of the tissue. The increase in surface area occurs in two ways. Because the tissue is hollow, there is significant shape change of the alveoli as well as stretching of the wall tissue. If we assume that tissue stretching did not expose new binding sites and did not change koff, then the binding-site density on the surface would decrease due to an increase in surface area. Consequently, the rate of stiffness decline would be expected to be less steep than in the unstretched samples, which is not what the experimental data revealed.
Regardless of the molecular mechanism, stretch-induced increase in koff and binding- site density has severe consequences on microscopic structure and macroscopic function. Because cleavage of elastin produces an irreversible structural damage, the stretch creates progressively increasing anisotropy and heterogeneity (Fig. 2). The heterogeneity of structure cannot be explained by digestion alone; rather, some fibers eventually break under the effect of mechanical forces (18). Consequently, when a fiber fails, the load on the surrounding fibers will increase, which in turn makes them more susceptible to binding and accelerated destruction.
These results suggest that local enzyme activity is regulated by how the complex ECM transmits macroscopic forces to the level of molecular bonds. The interaction of mechanical forces and enzyme activity can provide new insight into the pathogenesis and progression of various diseases involving proteolytic activity. For example, elastase injury is a key contributor to the pathogenesis of emphysema (19,20) and this study suggests that the mechanical forces of breathing can play a role at the early stages of the disease by accelerating local enzymatic destruction of the alveolar walls. Our findings may also have broader implications because, in vivo, enzymatic reactions in nearly all cellular and extracellular processes take place in the presence of mechanical forces.
Acknowledgments
The authors acknowledge support from the National Institutes of Health under grant No. HL-090757.
Supporting Material
References
- 1.Alberts B. Garland Science; New York: 2008. Molecular Biology of the Cell. [Google Scholar]
- 2.Ayala Y.M., Di Cera E. A simple method for the determination of individual rate constants for substrate hydrolysis by serine proteases. Protein Sci. 2000;9:1589–1593. doi: 10.1110/ps.9.8.1589. [DOI] [PMC free article] [PubMed] [Google Scholar]
- 3.Joubert F., Fales H.M., Balaban R.S. NADH enzyme-dependent fluorescence recovery after photobleaching (ED-FRAP): applications to enzyme and mitochondrial reaction kinetics, in vitro. Biophys. J. 2004;86:629–645. doi: 10.1016/S0006-3495(04)74141-7. [DOI] [PMC free article] [PubMed] [Google Scholar]
- 4.Mecham R.P., Broekelmann T.J., Senior R.M. Elastin degradation by matrix metalloproteinases. Cleavage site specificity and mechanisms of elastolysis. J. Biol. Chem. 1997;272:18071–18076. doi: 10.1074/jbc.272.29.18071. [DOI] [PubMed] [Google Scholar]
- 5.Khan S., Sheetz M.P. Force effects on biochemical kinetics. Annu. Rev. Biochem. 1997;66:785–805. doi: 10.1146/annurev.biochem.66.1.785. [DOI] [PubMed] [Google Scholar]
- 6.van den Broek B., Noom M.C., Wuite G.J. DNA-tension dependence of restriction enzyme activity reveals mechanochemical properties of the reaction pathway. Nucleic Acids Res. 2005;33:2676–2684. doi: 10.1093/nar/gki565. [DOI] [PMC free article] [PubMed] [Google Scholar]
- 7.Zhang X., Halvorsen K., Springer T.A. Mechanoenzymatic cleavage of the ultralarge vascular protein von Willebrand factor. Science. 2009;324:1330–1334. doi: 10.1126/science.1170905. [DOI] [PMC free article] [PubMed] [Google Scholar]
- 8.Fung Y.C. Springer-Verlag; New York: 1993. Biomechanics: Mechanical Properties of Living Tissues. [Google Scholar]
- 9.Briones A.M., González J.M., Arribas S.M. Role of elastin in spontaneously hypertensive rat small mesenteric artery remodeling. J. Physiol. 2003;552:185–195. doi: 10.1113/jphysiol.2003.046904. [DOI] [PMC free article] [PubMed] [Google Scholar]
- 10.Yuan H., Kononov S., Suki B. Effects of collagenase and elastase on the mechanical properties of lung tissue strips. J. Appl. Physiol. 2000;89:3–14. doi: 10.1152/jappl.2000.89.1.3. [DOI] [PubMed] [Google Scholar]
- 11.Black L.D., Allen P.G., Suki B. Mechanical and failure properties of extracellular matrix sheets as a function of structural protein composition. Biophys. J. 2008;94:1916–1929. doi: 10.1529/biophysj.107.107144. [DOI] [PMC free article] [PubMed] [Google Scholar]
- 12.Cavalcante F.S., Ito S., Suki B. Mechanical interactions between collagen and proteoglycans: implications for the stability of lung tissue. J. Appl. Physiol. 2005;98:672–679. doi: 10.1152/japplphysiol.00619.2004. [DOI] [PubMed] [Google Scholar]
- 13.Sprague B.L., Pego R.L., McNally J.G. Analysis of binding reactions by fluorescence recovery after photobleaching. Biophys. J. 2004;86:3473–3495. doi: 10.1529/biophysj.103.026765. [DOI] [PMC free article] [PubMed] [Google Scholar]
- 14.Bulinski J.C., Odde D.J., Waterman-Storer C.M. Rapid dynamics of the microtubule binding of ensconsin in vivo. J. Cell Sci. 2001;114:3885–3897. doi: 10.1242/jcs.114.21.3885. [DOI] [PubMed] [Google Scholar]
- 15.Mellet P., Boudier C., Bieth J.G. Stopped flow fluorescence energy transfer measurement of the rate constants describing the reversible formation and the irreversible rearrangement of the elastase-α1-proteinase inhibitor complex. J. Biol. Chem. 1998;273:9119–9123. doi: 10.1074/jbc.273.15.9119. [DOI] [PubMed] [Google Scholar]
- 16.Lele T.P., Thodeti C.K., Ingber D.E. Force meets chemistry: analysis of mechanochemical conversion in focal adhesions using fluorescence recovery after photobleaching. J. Cell. Biochem. 2006;97:1175–1183. doi: 10.1002/jcb.20761. [DOI] [PubMed] [Google Scholar]
- 17.Morrison H.M., Welgus H.G., Campbell E.J. Interaction between leukocyte elastase and elastin: quantitative and catalytic analyses. Biochim. Biophys. Acta. 1999;1430:179–190. doi: 10.1016/s0167-4838(98)00270-2. [DOI] [PubMed] [Google Scholar]
- 18.Suki B., Lutchen K.R., Ingenito E.P. On the progressive nature of emphysema: roles of proteases, inflammation, and mechanical forces. Am. J. Respir. Crit. Care Med. 2003;168:516–521. doi: 10.1164/rccm.200208-908PP. [DOI] [PubMed] [Google Scholar]
- 19.Barnes P.J. Chronic obstructive pulmonary disease. N. Engl. J. Med. 2000;343:269–280. doi: 10.1056/NEJM200007273430407. [DOI] [PubMed] [Google Scholar]
- 20.Janoff A. Elastases and emphysema. Current assessment of the protease-antiprotease hypothesis. Am. Rev. Respir. Dis. 1985;132:417–433. doi: 10.1164/arrd.1985.132.2.417. [DOI] [PubMed] [Google Scholar]
Associated Data
This section collects any data citations, data availability statements, or supplementary materials included in this article.