

Abstract
The motility of the stomach is coordinated by an electrical activity termed “slow waves”, and slow-wave dysrhythmias contribute to motility disorders. One major method for clinically evaluating gastric dysrhythmias has been electrogastrography (EGG); however, the clinical utility of EGG is limited partly due to the uncertainty regarding its electrophysiological basis. In this study, a multiscale model of gastric slow waves was generated from a biophysically based continuum description of cellular electrical events, coupled with a subject-specific human stomach model and high-resolution electrical mapping data. The model was then applied using a forward-modeling approach, within an anatomical torso model, to define how slow wave activity summates to generate the EGG potentials. The simulated EGG potentials were shown to be spatially varying in amplitude (0.27–0.33 mV) and duration (9.2–15.3 s), and the sources of this variance were quantified with respect to the activation timings of the underlying slow wave activity. This model constitutes an improved theory of the electrophysiological basis of the EGG, and offers a framework for optimizing the placement of EGG electrodes, and for interpreting the EGG changes occurring in disease states.
Introduction
Gastric motility is coordinated by a series of propagating electrical events termed “slow waves”, which are initiated and propagated by the interstitial cells of Cajal (ICC). Slow waves are passively conducted from ICC to the neighboring smooth muscle cells (SMC), causing contractions when coregulatory conditions are met, such as after a meal (1,2). (Note that there is some ambiguity in the usage of the term “slow wave”—specifically to which of the cellular electrical activity (ICC or SMC) it refers (2). In this study, the electrical activity of the ICCs is referred to as the initial component of slow wave, and the response of SMC to the ICC activity is referred to as the secondary component of slow wave.)
Dysrhythmic slow wave activity is well known to occur in several gastric motility disorders, including gastroparesis, functional dyspepsia, and gastroesophageal reflux disease (3–5). Degradation or dysfunction of ICC networks may contribute to the slow wave dysrhythmias in some of these disorders, notably in diabetic gastroparesis (1,6).
Electrogastrography (EGG) is a noninvasive method for recording the resultant body surface potential of gastric slow wave propagation. EGG holds significant potential as a routinely deployable tool to aid the diagnosis of gastric slow wave dysrhythmias. However, there are several technical and physiological limitations that have prevented EGG from becoming a widely used diagnostic tool. One fundamental physiological issue has been the lack of understanding about how to interpret the cutaneous EGG recordings in relation to the state of electrical activation of the stomach (7,8). A number of studies using simultaneous serosal and cutaneous recordings have confirmed that the EGG frequency correlates with the gastric slow wave frequency (9,10), but it remains unknown how the slow waves actually summate to generate what is recorded in EGG (11). A clear knowledge of these sources would be of significant value for better determining how the EGG changes in disease.
To determine the electrophysiological basis of the normal EGG, it is first necessary to know the normal pattern of gastric slow wave behavior. It has only been recently that this normal pattern has been described in sufficient detail, following the publication of high-resolution (HR) serosal gastric mapping data (12–14). The opportunity now exists to apply this improved understanding of gastric slow wave activity to determine how slow waves summate to form the EGG. However, the invasiveness of HR mapping is a significant barrier to compare, experimentally, simultaneous serosal and EGG activities in sufficient detail, especially in humans.
Mathematical modeling presents an attractive alternative strategy for quantifying the relationship between gastric slow waves and the EGG. In the cardiac field, the established forward modeling techniques have successfully related electrical events in the heart to the electrocardiogram (ECG) recorded on the torso, in order to optimize the placement of ECG electrodes and improve diagnostic sensitivity (15). The accuracy and sophistication of the forward approach has been significantly enhanced by the advent of realistic anatomical and biophysically based modeling techniques applied across multiple scales (multiscale modeling) (15).
A number of previous studies have attempted to explain and enhance EGG through modeling (11,16,17). However, these past approaches have been limited because they were based on an incomplete description of the underlying gastric slow waves, and/or were lacking in realistic anatomical or biophysical details. More recently, Buist et al. (18) proposed an anatomically detailed multiscale modeling framework for human gastric slow waves and EGG. However, the accuracy of this work was again limited by an inaccurate representation of the underlying gastric slow waves and the lack of a biophysically based representation of cellular slow wave activity. A number of biophysically based cell models have since been published (19–21), but an accurate modeling presentation of the whole organ slow wave activity is still lacking.
In the context of the significant recent advances and the opportunity for a whole organ model discussed above, this study aimed to introduce two major improvements to develop an updated multiscale model of gastric slow wave activity. The first improvement was to adopt biophysically based continuum models of ICC and SMC into a multiscale framework and to reproduce the regional variation in membrane potentials and slow wave amplitudes. The second improvement was to simulate slow wave propagation over the stomach in direct accordance with recent evidence provided by human HR mapping. The updated gastric model was then applied to determine the relationship between the gastric slow wave activity and the cutaneous EGG.
Materials and Methods
Cell models
A continuum cell modeling approach was employed, based on two biophysically based gastric cell models, the Corrias and Buist (C&B) ICC and SMC models (19,20). The C&B ICC model simulates the initial component of gastric slow waves at a self-excitatory intrinsic frequency, while the C&B SMC model simulates the secondary component of gastric slow waves in response to an experimentally fitted intracellular stimulus. In this study, the C&B ICC and SMC models were updated, as described below, to form an electrical generator of slow waves in a spatially averaged sense; i.e., a continuum unit of slow wave activity which contains an averaged number of ICCs driving SMCs.
On the balance of current evidence, it is thought that ICC and SMC are electrically coupled via small sparse gap junctions, enabling conduction of slow waves into the SMC syncytium, but without draining excessive current (such that ongoing ICC entrainment would be prevented) (2). The gap junction relationship was adapted from the model component by Buist et al. (22) and is given by
| (1) |
where Vm(ICC) is the membrane potential (Vm) of ICC simulated by the updated C&B ICC component and Vm(SMC) is the Vm of SMC simulated by the C&B SMC component. The gap junction was modeled as passive-resistor of the difference between the Vm of the two cell components, which is then multiplied by a gap channel coupling conductance (Gcouple). The resultant coupling current (ICouple) activates the secondary component of the slow wave event in the SMC component. For details of the cell model, readers are referred to the Supporting Material, as well as the original articles describing the cell models (19,20,23,24).
Continuum-based modeling
The continuum modeling approach was used to simulate the propagation of slow waves (25,26). The bidomain equations have been used in several previous slow wave propagation modeling problems, and extensive details of the method can be found therein (18,27,28). The following system of equations (Eqs. 2 and 3) summarizes the bidomain equations used in this study to simulate propagation of slow waves,
| (2) |
| (3) |
where ϕe denotes the extracellular potentials, and Am is the surface/volume ratio of the membrane. Cm is the specific cell membrane capacitance, and Iion is the sum of all ionic currents of the SMC-ICC model. The σ-terms represent tissue conductivity tensors, where subscript i represents the intracellular domain and subscript e represents the extracellular domain. We also assumed homogeneity within the gastric tissues, i.e., no fiber orientations within the gastric wall, therefore reducing σi and σe to single value quantities, where σi = 0.3 mS mm−1 and σe = 0.2 mS mm−1.
Anatomical model
A subject-specific virtual anatomical model of the stomach was constructed from preoperative CT images taken from a human patient (Fig. 1 A). This particular subject was chosen as the reference model because a complete description of gastric slow-wave times were obtained from this subject by intraoperative HR mapping and this patient was representative of typical normal activity (see below) (14). The details of the technique used to construct the anatomical model have been described previously (26). In brief, the three-dimensional outline of the stomach was manually digitized from the CT images. A cubic Hermite finite element mesh was fitted to the digital outline of the stomach, from which the anatomical model was constructed using a finite element fitting method (28). The surface of the initial stomach mesh was then projected toward the centerline of the mesh to obtain a muscle layer thickness of 2.66 mm (29). The final anatomical model of the stomach is as shown in Fig. 1 B. The idealized layered structure of the gastric wall adopted by Buist et al. (18) in their previous study was not employed in this study because the ICC-SMC model cell model conceptually represents a continuum unit of a mixture of ICC and SMC. Therefore, artificially establishing distinct layers of these cells in the simulation was not required.
Figure 1.
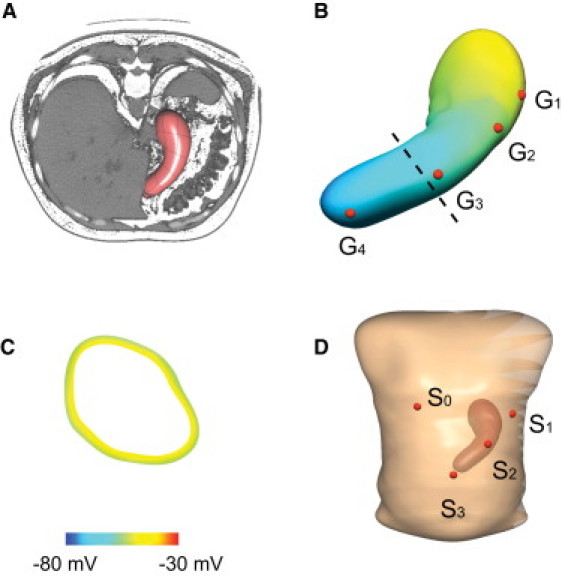
Construction of a subject-specific virtual anatomical stomach model and torso model. (A) The coronal view of the virtual stomach model embedded in the CT images taken of the patient before surgery. (B) The virtual stomach model that was constructed from the CT images. Four virtual electrodes (G1–4) were placed on the stomach model. G1 was placed in the fundus, G2 was placed in the pacemaker region, G3 was placed in the corpus, and G4 was placed in the antrum. (C) A 10-mV membrane potential gradient was modeled across the gastric wall (site of shown cross-section of the stomach indicated by the dashed line in panel B). (D) The virtual torso in which the stomach model was embedded to match the approximate orientation in the CT images. Four virtual EGG electrodes (S1–3) were placed on the stomach model. S0 is the reference and electrodes S1–3 were placed across the abdominal wall following the longitudinal organ-axis of the stomach.
Modeling slow wave propagation
The initial activation times of gastric slow waves were established according to recent evidence from a human gastric HR mapping study (14), in which flexible printed-circuit-board electrode arrays were used to map gastric slow waves at high spatiotemporal resolution (192 channels; 7.62 mm interelectrode spacing; 512 Hz) (30). The locations of the recording arrays used in the human study were manually registered onto the virtual stomach based on a set of anatomical landmarks as previously described (14). The activation times of slow waves in the anterior and posterior stomach were assumed to be symmetrical, based on experimental evidence from a recent porcine gastric HR mapping study (12), and direct observations of contraction dynamics from MRI studies (31). The average activation times obtained from multiple human subjects and recordings were averaged into a single generic propagation pattern, and the initial activation times of slow waves were then interpolated and mapped to each elemental node in the stomach model as one of the initial conditions of the continuum cell model. Only the start times of the first event were prescribed; the subsequent slow waves were generated autonomously by the ICC-SMC component of the multiscale model.
Prescribing the initial activation times in this way produced a significant computational saving. In a modeling study of slow wave entrainment over realistic ICC network geometries, we previously simulated slow wave propagation at spatial resolutions of <0.3 mm, and this was computationally feasible due to the small physical dimensions of the tissue geometries employed (<0.4 × 0.4 mm) and the short duration of simulation times (<500 ms) (27). However, in this study the anatomical model is many centimeters in size, and the required simulation time is also an order-of-magnitude longer than the previous tissue-scale simulations (i.e., 120 s vs. 0.5 s). In combination, these two computational challenges make whole-organ simulations using the ICC-SMC model at a fine mesh resolution a computationally demanding problem. The prescription of initial activation times overcame the need to establish stable gastric slow wave propagation simulations at fine resolutions, while also providing a convenient framework by which the HR mapping data could be directly applied to enforce experimentally derived behaviors on the whole-organ model.
Assignment of resting membrane potential gradients
Experimental studies have demonstrated different morphological features of gastric slow waves, in terms of the rate of upstroke (dVm/dt), resting membrane potentials, and amplitude (32). In this study, we aimed to reproduce the resting membrane potentials and amplitude of gastric slow waves. Experimental studies have also demonstrated a gradient of resting membrane potentials (RMPs) (−45 to −70 mV) and an increasing gradient of amplitude (15–20 mV) of slow waves from fundus to antrum in the guinea-pig stomach (2,32). The amplitude of the ICC-SMC model can be modulated by Gcouple, whereas the RMP of the ICC-SMC model is dependent on both Gcouple and the Nernst potential of Potassium (Ek) as shown in Fig. 2. There are many other cellular parameters which could be changed to vary the RMP, but because the ICC-SMC model contains mostly K+-type conductances, changing EK offers the most direct way of adjusting the RMP. While there is also experimental evidence of carbon monoxide being a modulator of SMC and ICC RMP (33), this study does not include a parameter for CO concentration in SMCs or ICCs. Furthermore, the relative density of SMC relative to each pacemaker of ICC is high, e.g., up to 100, so that the contribution of ICC slow waves to the EGG is ignored in this case (22).
Figure 2.
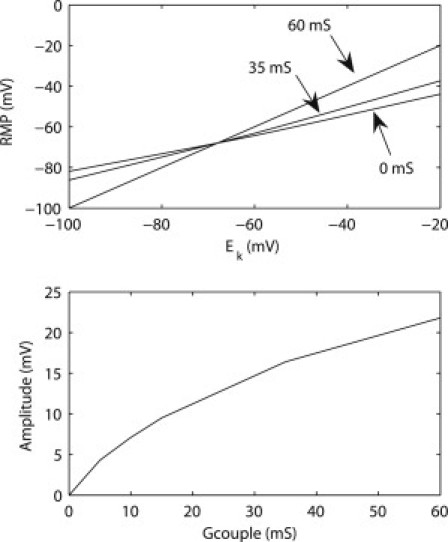
Calibration curves of the resting membrane potential (RMP) and amplitude of the ICC-SMC continuum cell model. (Top) The RMP is dependent on the Nernst potential of K+ (EK) as well as the coupling conductance (Gcouple in Eq. 1) between the ICC component and the SMC component of the ICC-SMC model. Three coupling conductances (0, 35, 60 mS) were plotted. (Bottom) Amplitude at different values of coupling conductance (Gcouple) between ICC and SMC.
To reproduce the known RMPs and amplitudes of gastric slow waves, the values of Gcouple in Eq. 1 were set to 0 mS in the fundus, 35 mS in the corpus, and 60 mS in the distal stomach, based on intracellular data from guinea-pig studies (32), and data from human HR mapping that showed an amplitude increase in the distal stomach (14). The average RMP of the fundus was set to −45 mV and the fundus was assumed to be devoid of slow waves (14). The average RMP was set to −55 mV in the corpus and −70 mV in the distal stomach in accordance with previous recordings in guinea-pig stomach (32).
According to several experimental studies, there is a positive gradient of 10 mV in RMP from the inner wall to the outer wall across the wall thickness in the corpus and antrum of the canine stomach (33), which we represented in the stomach model (Fig. 1 C). A specific region of high-amplitude and high-velocity activity in association with the pacemaker region has only recently been described (12–14), and as-yet there is no experimental data available regarding the RMP and amplitude of membrane potentials of the SMC within this region. However, given the fact that the human pacemaker region is associated with slow wave activity of similar velocity and amplitude to that of the antrum (14), Gcouple in the pacemaker region was also set to 60 mS.
Forward simulation of EGG
To calculate the resultant potentials on the torso surface that arise from the simulated gastric slow waves, two further steps were employed (18,26). First, the local current density was calculated. (For a more detailed derivation of this step, readers are referred to the Supporting Material and the original work on cardiac modeling (15).)
Therefore, the local current density changes prescribed by the continuum cellular event were expressed using the following equation,
| (4) |
where J is the local current density, which is then integrated over the geometry of the stomach model to obtain the equivalent dipole sources (Fig. 1 B), from which the resultant torso surface potential was simulated by solving the Poisson equation,
| (5) |
where the source term Jcombined is the combined equivalent dipole sources and ϕ is the torso potential field. Here the torso conductivity is assumed to be homogenous, with σe = 0.03 mS mm−1.
The simulated EGG was sampled from four surface electrodes (S0–3, where S0 is the reference electrode) as shown in Fig. 1 D. The chosen configuration was based on the standard multichannel EGG electrode configuration reported by Chen et al. (9). The recordings in S1–3 were compared to the simulated simultaneous gastric slow waves at four virtual electrodes (G1–4) placed on the stomach, as shown in Fig. 1 B, where G1 is in the fundus; G2 is in the pacemaker region; G3 is in the distal corpus; and G4 is in the distal antrum.
Numerical solutions
Equations 2 and 3 were solved numerically using a grid-based, finite element-based technique. A Jacobi preconditioned conjugate gradient method with an adaptive integrator solver was used to solve the discrete forms of Eqs. 2 and 3. Details on the solution procedures have been previously described (27). Equation 5 was solved using the boundary element method as previously described (18). All numerical simulations were solved on a single processor of an IBM p595 HPC.
Results
ICC-SMC model
The ICC-SMC model simulated two components of slow wave events (Fig. 3). The initial component of the slow wave was simulated by the ICC component of the ICC-SMC model, and the secondary component of slow wave was simulated by the SMC component of the ICC-SMC model. The RMP of the ICC model was −68 mV throughout the virtual stomach model. The simulated slow wave activity in the ICC model was generated autonomously at an intrinsic frequency of 3.0 cpm, and the slow wave activity in the SMC model occurred as a consequence of the ICC slow wave. The response of the SMC model to the ICC slow wave was dependent on the values of Ek and Gcouple: in the fundus, the simulated RMP was −45 mV and amplitude of the slow wave was 0 mV; in the corpus, the simulated RMP was −57 mV and amplitude of the slow wave was 16 mV; and in the antrum, the simulated RMP was −71 mV and amplitude of the slow wave was 21 mV. Overall, the resultant cell model behavior was consistent with the parameters that were specified based on current experimental evidence, in terms of slow wave activation dynamics, regional RMPs, and amplitudes.
Figure 3.
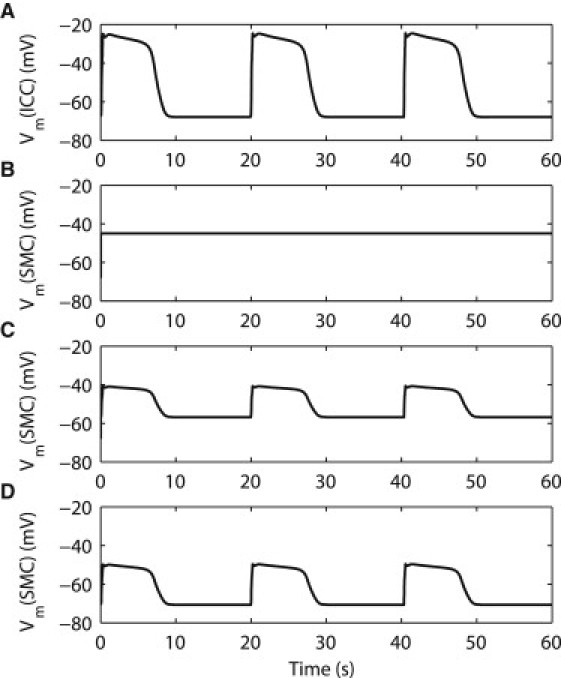
Simulated gastric slow wave activity using the ICC-SMC continuum cell model. (A) An example of the simulated initial component of the gastric slow wave activity in the ICC was generated autonomously at an intrinsic frequency of 3.0 cycles per minute. (B) An example of the simulated secondary component of gastric slow wave in the fundus. The simulated amplitude of the fundus slow wave is 0 mV, and the simulated resting membrane potential (RMP) is −45 mV. (C) An example of the simulated corpus slow wave. The simulated amplitude of the corpus slow wave is 16 mV, and the simulated RMP is −57 mV. (D) An example of the simulated antral slow wave. The simulated amplitude of the antral slow wave is 21 mV, and the simulated RMP is −71 mV.
Whole-organ activation model
Simulated gastric slow waves in the whole organ model are illustrated in Fig. 4 A. The frequency of simulated slow waves at the organ level was the same as at the cellular level (i.e., 3.0 cpm). It took ∼60 s (i.e., one complete propagation cycle) for the activity to settle into a steady state (∼2 h of computational time). The initial 60 s of simulated slow waves was therefore ignored. The origin of the gastric slow wave was consistently situated at the appropriate pacemaker region on the greater curvature of the proximal corpus (e.g., depolarized events, colored red, visible at t = 4 and 24 s). The initial propagation from the pacemaker region formed a wide wavefront in a band by ∼t = 4 s, which then propagated in the antegrade direction toward the pylorus. By 24 s, the onset of the second slow wave cycle was visible in the pacemaker region of the virtual stomach model, with the first cycle of activity having reached the midcorpus. By 44 s, the onset of the third slow wave cycle was visible in the pacemaker region, while the active edge of the first cycle of slow wave activity had entered the antral region. A maximum of four simultaneous wavefronts were visible (e.g., at 60 s), while the minimum number of simultaneous wavefronts was three. The global average of the propagation velocity was ∼6.4 mm s−1, with substantial regional variations in mm s−1: ∼7.7 in the pacemaker region; ∼2.8 in the corpus; ∼5.9 in the antrum. The width of the active edges of the slow waves' depolarized region (colored yellow in Fig. 4 A) was ∼16 mm in the corpus and ∼37 mm in the distal antrum. The slower local corpus velocity resulted in accrual of multiple narrow wavefront bands, with an active-to-active edge separation displacement of ∼50 mm. All of these modeled slow wave propagation dynamics were in accordance with experimental data (14).
Figure 4.
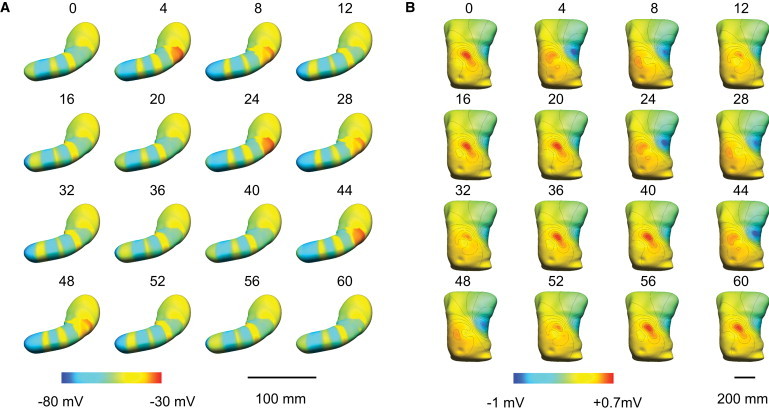
Simulated slow waves in a virtual stomach model based on generic activation times of slow waves from human experiments (14). (A) A total of 60 s of propagation is shown. The red color (right of the colorbar) represents depolarized activity and the blue color (left of the colorbar) represents the resting membrane potentials. (B) Simulated resultant body surface potential field of the slow wave activity in panel A. The red color (right of the colorbar) represents positive potentials and the blue color (left of the colorbar) represents negative potentials in the torso potential field. The contour lines (black) represent 0.1-mV increments.
Virtual analysis of the EGG
The simulated torso surface potentials, calculated from the organ model, are presented in Fig. 4 B. (Note that a three-dimensional visualization of the simulated slow wave and body surface potential fields was also generated to present the full results of the forward simulation in animated form; please refer to the Supporting Material.) The majority of the upper torso was consistently at ∼0 mV (Fig. 4 B in green). A distinct region of consistently positive activity occurred in the simulated torso surface potential field across the epigastrium (Fig. 4 B in yellow/red), while the negative tail of the torso surface potential field was located over the left-hand side of the lateral thorax, beneath the nipple line (Fig. 4 B in blue).
Analysis of the virtual EGG electrodes, S1–3, showed that the EGG was spatially varying, such that the timing, amplitude, and morphology of the signal was dependent on the site where the torso potential was taken in relation to the stomach. The EGG electrode with the highest amplitude (S2; 0.33 mV) was located closest to the midcorpus (Fig. 5). For the other two virtual EGG electrodes, the amplitude was 0.29 mV in S1 and 0.27 mV in S3. The peak of the dominant power in the mean-square power spectrum after the removal of the direct-current offset in each channel was (in dB): −24.2 in S1; −24.9 in S2; and −19.8 in S3. The frequency of the oscillations in all EGG channels was consistently 3.0 cpm, being identical to that of the underlying gastric activity.
Figure 5.
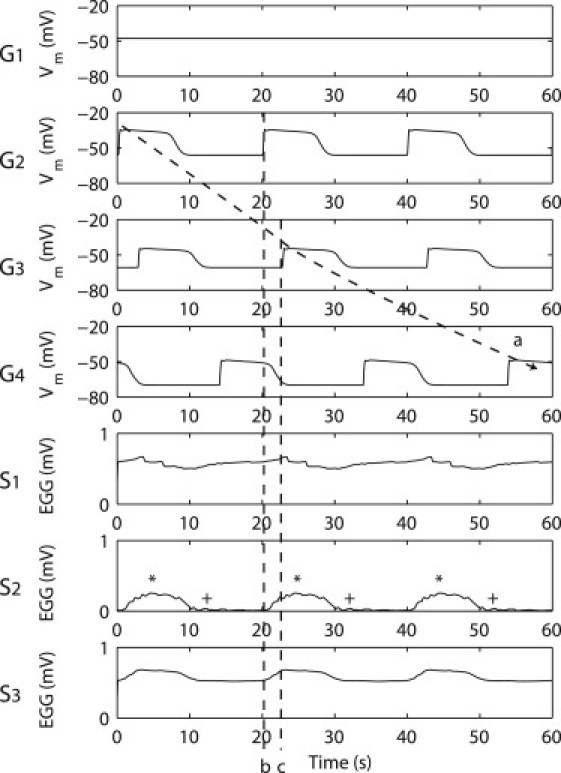
Simulated simultaneous slow waves at selected virtual electrodes on the stomach and EGG on the torso surface. Electrodes G1–4 represent the gastric electrodes and electrodes S1–4 represent the EGG electrodes. Electrode S0 was not shown because it is the reference electrode (i.e., Sn = Sn–S0 where n = 1,2,3). A continuous wavefront from G2–4 was tracked by the arrow. Dashed line b represents the timing of a pacemaker slow wave activity. Dashed line c represents the timing of a corpus slow wave activity. The asterisk symbol (∗) denotes the times when there were four simultaneous waves active in the stomach. The plus-symbol (+) denotes the times when the gastric slow waves were entering in the proximal antrum.
In S1–3, the width of each EGG event was ∼15.3 s in S1, 9.2 s in S2, and 11.5 s in S3. The EGG electrode morphologies were substantially wider than the simulated ICC-SMC slow waves in G2–4 (∼9.4 s). The timings of EGG activity in S2 and S3 were almost simultaneous, with a phase time difference of <1 s. The onset timings of the EGG activity in S1 was close to the end times of the activities in S2 and S3, e.g., at 10.5 s and 30.3 s.
The simulated EGG results are compared to the results of an experimental study by Chen et al. (9) in Table 1.
Table 1.
Simulated EGG mean amplitude, frequency, and correlation to slow wave frequency in S1–3 compared to experimental recordings by Chen et al. (9)
| Simulation | Experiment (mean) | |
|---|---|---|
| Mean EGG amplitude (mV) | 0.30 | 0.27 |
| Mean EGG frequency (cpm) | 3 | 3.24 |
| Slow wave-EGG frequency correlation | 1:1 | 1:1 |
The relationship between gastric slow waves and EGG
As shown in Fig. 4, the timing of the negative tail of the torso surface potential field (across the left lateral thorax) coincided closely with the activation of the pacemaker region. In contrast, the timing of the positive surface potential field across the epigastric region mainly coincided with quiescence of the pacemaker region, when three wavefronts were propagating distally in the corpus and antrum.
Out of S1–3, the onset times of the S3 waves (marked by dashed line b in Fig. 5) matched closest with the onset timings in G2 (pacemaker activation, i.e., at ∼0 s, ∼20 s, and ∼40 s in S3 Fig. 5). The peak timings of the waves in S1 and S3 (marked by dashed line c in Fig. 5) matched closest to the onset timings of G3 (distal corpus activation, i.e., at ∼3 s, ∼23 s, and 43 s in S2 Fig. 5). The peak timings of the waves in S2 (marked by an asterisk in Fig. 5) matched closest to the times when there were four simultaneous waves active in the stomach (i.e., at 4 s, 24 s, and 44 s in Fig. 4 A). The end times of waves in S2 (marked by a plus-sign in Fig. 5) matched closest to the times when gastric slow waves were present in the midantrum (i.e., at 12 s, 32 s, and 54 s in Fig. 4 A), and the period between the end time of a wave in S2 and the following S2 peak coincided with the propagation slow waves through the distal antrum (∼14 s). The onset times of G4 (distal antral activation, i.e., at ∼14 s, ∼34 s, and ∼54 s Fig. 5) did not match closely to the timings of any of the major EGG morphological features.
Discussion
This study presents an improved multiscale mathematical model of human gastric slow wave activity, integrating biophysical gastric cell models and a large volume of recent experimental evidence, including the results from human gastric HR mapping studies (14). Using established forward simulation techniques (15), the model was applied to simulate virtual EGGs over an anatomical torso model, to compare simultaneously simulated serosal and cutaneous potentials. The model also provides a realistic visualization of the dynamics of gastric slow wave propagation and EGG.
These results present a comprehensive theory of the electrophysiological basis of the human EGG. Previously, it has sometimes been simply assumed that the distal antral slow waves dominate the EGG, because of the higher slow wave amplitude and velocity seen on serosal recordings from the distal stomach, and because of the close distance between the abdominal wall and the gastric antrum (11,34). The results of this study suggest that the sources of the EGG are significantly more complex, partly because of the following three observations:
-
1.
Besides the antral slow waves, the pacemaker region also contains high-amplitude events (Fig. 4 A; Fig. 5 G2);
-
2.
The corpus contains the greatest number of simultaneous wavefronts (Fig. 4 A);
-
3.
A physiological RMP gradient modulates regional activities (Fig. 1, B and C) may cause a further distortion of the dipole directions.
In combination, these three factors contributed to a distortion in the equivalent dipole calculated by Eq. 5, such that the contribution of the antral slow waves to the EGG is moderated by the combined effects of the summated slow wave activity occurring in the mid and proximal stomach regions. The EGG thus reflects a combined contribution from all of the electrically active regions in the stomach.
In previous explanations of the EGG, it has also sometimes been assumed that the 1:1 ratio of EGG to slow waves was because there is only one slow wave propagating at a time in the stomach (18). This incorrect assumption was a result of spatial-aliasing in the sparse serosal recordings (14). As previously pointed out by Verhagen et al. (8), multiple gastric sources are simultaneously present, and the EGG is a summation of the underlying slow wave activity. Our findings, based on human HR mapping data, demonstrate that the 1:1 ratio of EGG waves to gastric slow waves can be better attributed to the fact that the EGG torso potential field oscillates in time with the repeating sequence of the underlying multiple gastric slow wave sources. More specifically, because the dipoles are dependent on the gradient of Vm (Eq. 4). Hence, the hypothesis is presented that as a wavefront emerges in the pacemaker region or exits at the pylorus, there would be a corresponding change in the EGG signal. This hypothesis can be supported by the evidence that the timing of the EGG signals in S3 closely matched the onset of slow waves in the pacemaker region (G2). Therefore it is likely that the changes in the network dipole moment caused by an emerging wavefront had affected the net dipole, and consequently the timings of the simulated EGG signals.
The finding that the EGG morphology and timings are spatially varying is supported by several previous experimental studies using multichannel EGG (4,35). As observed in our model, Lin and Chen (4) demonstrated that the events in the most proximal EGG channel showed a longer width and phase differences compared to the more distal EGG channels. These observations support the contention that using multiple EGG electrodes can yield additional information regarding gastric slow wave activity. Chen et al. (35) reported a smaller time lag between EGG waves recorded over the distal stomach compared to EGG recorded over the proximal stomach. This observation was again consistent with our simulated results, which suggest that EGG waves over the corpus and antrum (S2 and S3 in Fig. 5) occurred almost simultaneously.
The optimal placement of cutaneous EGG electrodes has been a subject of controversy, particularly with regard to the detection of uncoupled activity (36). The typical electrode positions, as used this study, were empirically derived from the observation that the highest quality signal can be obtained by placing the electrodes along the organoaxial direction of the stomach (9,37), or more specifically, over the antrum (36). The simulated results appeared to support this observation by the evidence that the power of the dominant frequency (3.0 cpm) in the distal EGG electrode (∼−20 dB in S3) was higher than in the proximal channels (∼−24 dB in S1–2). Future studies employing this model may help to computationally optimize the placement of EGG electrodes, as has been achieved previously in the cardiac field (15). However, a complicating factor in practice is that the size, location, and orientation of the human stomach is highly variable (28), and for this reason some investigators have suggested performing an ultrasound to guide electrode placement (38). To further facilitate this decision-making process, the model presented here could also be applied to help predict the consequences of different gastric anatomies on the EGG, to inform on the ideal electrode placements when anatomical variants are identified.
Despite the advantages of this model, there are a number of limitations and assumptions that warrant further discussion. As stated above, the model is circumstantially supported by existing evidence from several experimental studies; however, it has not yet been directly validated, which is technically challenging at present due to the invasiveness of HR mapping. It should also be noted that prescribing the activation times introduces a deterministic mode of behavior into the organ level of the multiscale framework. This model also does not yet include any representation of spike activity (SMC action potentials), which are thought by some to contribute to diagnostically relevant postprandial changes in the EGG (7). It is believed that spike activity may also contribute to EGG (11); however, the effect of the spike activity on EGG signals is still inconclusive (8), because slow waves alone are now understood to be adequate to induce excitation-contraction coupling in the stomach (39).
Our gastric model adopted a uniform distribution of ICC-SMC at each continuum unit, whereas in reality several different types of ICC network arrangements interact with SMC in different ways throughout the GI tract (2). While the model is sufficient for forward-modeling applications, specific tissue models incorporating detailed information of ICC network geometries should be preferred when representing and evaluating slow wave propagation at finer biological scales (27). A recent framework for multiple cell types proposed by Buist and Poh (40) would be a platform for incorporating both ICC and SMC slow waves simultaneously in a whole organ and/or tissue model. In future, the gastric model presented here could be improved by incorporating experimental evidence regarding the effects of CO, which is known to be responsible for regulating the gastric RMP gradient in SMCs and possibly ICCs (41), as has recently been applied in another modeling study (22). An accurate description of the RMP would be particularly important if the Vm of ICCs were also taken into account. A more accurate description of the variations in dVm/dt (e.g., ∼10 mV s−1 in the corpus and ∼20 mV s−1 in the antrum in guinea-pigs (32)) should also be modeled because of their potential contributions to the dipole calculation (Eq. 4).
There is also likely to be some error in the anatomical relationships assigned in establishing this model. The gastric CT images were taken before surgery, when the stomach was distended by fluid, whereas the HR electrophysiology data was obtained during surgery and fasting. The HR mapping data was obtained based on best-estimates relative to the gastric anatomical landmarks and was matched manually to the virtual stomach model (14). The HR mapping data was also prescribed using several patches of recordings from the anterior serosa, with extrapolation of data to the posterior serosa based on assumptions from porcine HR mapping data and human MRI studies (12,31). Despite these limitations, the approach employed in this study does provide a significantly improved foundation for EGG interpretation over previous mathematical models. Nevertheless, these sources of error might be further reduced in future by improved anatomical registration of the HR mapping arrays (via concurrent mapping and imaging), and by simultaneously mapping a larger serosal surface area.
Many previous studies have demonstrated the potential of the EGG to identify gastric uncoupling (4,42). This model now provides a valuable virtual platform and hypothesis testing tool to predict the effects of various types of gastric dysrhythmias on the EGG, offering a means to define the electrophysiological basis of the abnormal EGG. Interesting recent work has employed HR mapping to define the spatiotemporal dynamics of gastric dysrhythmias in canines, finding complex focal events and fibrillation-type behaviors that were not apparent in earlier studies that used fewer electrodes (43). Before simulations of dysrhythmic EGGs are performed using this model, it would therefore be highly desirable to first develop a clearer understanding of dysrhythmic slow wave activity in the human stomach, via human HR mapping in disease states such as gastroparesis.
Finally, while this study offers new insights into the electrophysiology of the EGG, it should be noted that major technical hurdles also remain before the EGG is likely to become a widely used valuable diagnostic adjunct. Most significantly, cutaneous recordings of gastric electrical activity are of very low amplitude; movement artifacts and noise (such as the ECG) routinely make visual analysis of the EGG unreliable, and can also mislead the interpretation of automated analyses (8,44). Until more-sophisticated recording and analysis techniques overcome these technical challenges, EGG interpretation will remain challenging (7). Nevertheless, the significantly improved understanding of the electrophysiological basis of the EGG, offered in this study, does potentially eliminate one barrier limiting the improved clinical application of the EGG.
Acknowledgments
This project and/or authors are supported by a University of Auckland Doctoral Scholarship, grants from the New Zealand Health Research Council, the U.S. National Institutes of Health (No. R01 DK64775), and the American Neurogastroenterology and Motility Society.
Supporting Material
References
- 1.Farrugia G. Interstitial cells of Cajal in health and disease. Neurogastroenterol. Motil. 2008;20(Suppl 1):54–63. doi: 10.1111/j.1365-2982.2008.01109.x. [DOI] [PubMed] [Google Scholar]
- 2.Sanders K.M., Koh S.D., Ward S.M. Interstitial cells of Cajal as pacemakers in the gastrointestinal tract. Annu. Rev. Physiol. 2006;68:307–343. doi: 10.1146/annurev.physiol.68.040504.094718. [DOI] [PubMed] [Google Scholar]
- 3.Cucchiara S., Salvia G., Riezzo G. Gastric electrical dysrhythmias and delayed gastric emptying in gastroesophageal reflux disease. Am. J. Gastroenterol. 1997;92:1103–1108. [PubMed] [Google Scholar]
- 4.Lin X., Chen J.Z. Abnormal gastric slow waves in patients with functional dyspepsia assessed by multichannel electrogastrography. Am. J. Physiol. Gastrointest. Liver Physiol. 2001;280:G1370–G1375. doi: 10.1152/ajpgi.2001.280.6.G1370. [DOI] [PubMed] [Google Scholar]
- 5.Lin Z.Y., McCallum R.W., Chen J.D. Effects of pacing parameters on entrainment of gastric slow waves in patients with gastroparesis. Am. J. Physiol. 1998;274:G186–G191. doi: 10.1152/ajpgi.1998.274.1.G186. [DOI] [PubMed] [Google Scholar]
- 6.Ordög T. Interstitial cells of Cajal in diabetic gastroenteropathy. Neurogastroenterol. Motil. 2008;20:8–18. doi: 10.1111/j.1365-2982.2007.01056.x. [DOI] [PubMed] [Google Scholar]
- 7.Bortolotti M. Electrogastrography: a seductive promise, only partially kept. Am. J. Gastroenterol. 1998;93:1791–1794. doi: 10.1111/j.1572-0241.1998.01791.x. [DOI] [PubMed] [Google Scholar]
- 8.Verhagen M.A., Van Schelven L.J., Smout A.J. Pitfalls in the analysis of electrogastrographic recordings. Gastroenterology. 1999;117:453–460. doi: 10.1053/gast.1999.0029900453. [DOI] [PubMed] [Google Scholar]
- 9.Chen J.D., Schirmer B.D., McCallum R.W. Serosal and cutaneous recordings of gastric myoelectrical activity in patients with gastroparesis. Am. J. Physiol. 1994;266:G90–G98. doi: 10.1152/ajpgi.1994.266.1.G90. [DOI] [PubMed] [Google Scholar]
- 10.Lin Z., Chen J.D., McCallum R.W. Postprandial response of gastric slow waves: correlation of serosal recordings with the electrogastrogram. Dig. Dis. Sci. 2000;45:645–651. doi: 10.1023/a:1005434020310. [DOI] [PubMed] [Google Scholar]
- 11.Smout A.J., van der Schee E.J., Grashuis J.L. What is measured in electrogastrography? Dig. Dis. Sci. 1980;25:179–187. doi: 10.1007/BF01308136. [DOI] [PubMed] [Google Scholar]
- 12.Egbuji J.U., O'Grady G., Pullan A.J. Origin, propagation and regional characteristics of porcine gastric slow wave activity defined by high-resolution mapping. Neurogastroenterol. Motil. 2010;22:e292–e300. doi: 10.1111/j.1365-2982.2010.01538.x. [DOI] [PMC free article] [PubMed] [Google Scholar]
- 13.Lammers W.J., Ver Donck L., Schuurkes J.A. Origin and propagation of the slow wave in the canine stomach: the outlines of a gastric conduction system. Am. J. Physiol. Gastrointest. Liver Physiol. 2009;296:G1200–G1210. doi: 10.1152/ajpgi.90581.2008. [DOI] [PubMed] [Google Scholar]
- 14.O'Grady G., Du P., Pullan A.J. The origin and propagation of human gastric slow wave activity defined by high-resolution mapping. Am. J. Physiol. Gastrointest. Liver Physiol. 2010;299:585–592. doi: 10.1152/ajpgi.00125.2010. [DOI] [PMC free article] [PubMed] [Google Scholar]
- 15.Pullan A.J., Buist M.L., Smith N.P. Cardiac electrical activity—from heart to body surface and back again. J. Electrocardiol. 2003;36(Suppl):63–67. doi: 10.1016/j.jelectrocard.2003.09.016. [DOI] [PubMed] [Google Scholar]
- 16.Liang J., Chen J.D. What can be measured from surface electrogastrography. Computer simulations. Dig. Dis. Sci. 1997;42:1331–1343. doi: 10.1023/a:1018869300296. [DOI] [PubMed] [Google Scholar]
- 17.Mintchev M.P., Bowes K.L. Computer simulation of the effect of changing abdominal thickness on the electrogastrogram. Med. Eng. Phys. 1998;20:177–181. doi: 10.1016/s1350-4533(98)00019-8. [DOI] [PubMed] [Google Scholar]
- 18.Buist M.L., Cheng L.K., Pullan A.J. Multiscale modeling of human gastric electric activity: can the electrogastrogram detect functional electrical uncoupling? Exp. Physiol. 2006;91:383–390. doi: 10.1113/expphysiol.2005.031021. [DOI] [PubMed] [Google Scholar]
- 19.Corrias A., Buist M.L. A quantitative model of gastric smooth muscle cellular activation. Ann. Biomed. Eng. 2007;35:1595–1607. doi: 10.1007/s10439-007-9324-8. [DOI] [PubMed] [Google Scholar]
- 20.Corrias A., Buist M.L. Quantitative cellular description of gastric slow wave activity. Am. J. Physiol. Gastrointest. Liver Physiol. 2008;294:G989–G995. doi: 10.1152/ajpgi.00528.2007. [DOI] [PubMed] [Google Scholar]
- 21.Faville R.A., Pullan A.J., Smith N.P. Biophysically based mathematical modeling of interstitial cells of Cajal slow wave activity generated from a discrete unitary potential basis. Biophys. J. 2009;96:4834–4852. doi: 10.1016/j.bpj.2009.03.058. [DOI] [PMC free article] [PubMed] [Google Scholar]
- 22.Buist M.L., Corrias A., Poh Y.C. A model of slow wave propagation and entrainment along the stomach. Ann. Biomed. Eng. 2010;38:3022–3030. doi: 10.1007/s10439-010-0051-1. [DOI] [PubMed] [Google Scholar]
- 23.Du P., O'Grady G., Pullan A.J. A tissue framework for simulating the effects of gastric electrical stimulation and in vivo validation. IEEE Trans. Biomed. Eng. 2009;56:2755–2761. doi: 10.1109/TBME.2009.2027690. [DOI] [PMC free article] [PubMed] [Google Scholar]
- 24.Fall C.P., Keizer J.E. Mitochondrial modulation of intracellular Ca2+ signaling. J. Theor. Biol. 2001;210:151–165. doi: 10.1006/jtbi.2000.2292. [DOI] [PubMed] [Google Scholar]
- 25.Cheng L.K., O'Grady G., Pullan A.J. Gastrointestinal system. WIREs Syst. Biol. Med. 2009;2:65–79. doi: 10.1002/wsbm.19. [DOI] [PMC free article] [PubMed] [Google Scholar]
- 26.Pullan A., Cheng L., Buist M. Modeling gastrointestinal bioelectric activity. Prog. Biophys. Mol. Biol. 2004;85:523–550. doi: 10.1016/j.pbiomolbio.2004.02.003. [DOI] [PubMed] [Google Scholar]
- 27.Du P., O'Grady G., Pullan A.J. Tissue-specific mathematical models of slow wave entrainment in wild-type and 5-HT(2B) knockout mice with altered interstitial cells of Cajal networks. Biophys. J. 2010;98:1772–1781. doi: 10.1016/j.bpj.2010.01.009. [DOI] [PMC free article] [PubMed] [Google Scholar]
- 28.Cheng L.K., Komuro R., Pullan A.J. Anatomically realistic multiscale models of normal and abnormal gastrointestinal electrical activity. World J. Gastroenterol. 2007;13:1378–1383. doi: 10.3748/wjg.v13.i9.1378. [DOI] [PMC free article] [PubMed] [Google Scholar]
- 29.Huh C.H., Bhutani M.S., Bolch W.E. Individual variations in mucosa and total wall thickness in the stomach and rectum assessed via endoscopic ultrasound. Physiol. Meas. 2003;24:N15–N22. doi: 10.1088/0967-3334/24/4/401. [DOI] [PubMed] [Google Scholar]
- 30.Du P., O'Grady G., Cheng L.K. High-resolution mapping of in vivo gastrointestinal slow wave activity using flexible printed circuit board electrodes: methodology and validation. Ann. Biomed. Eng. 2009;37:839–846. doi: 10.1007/s10439-009-9654-9. [DOI] [PMC free article] [PubMed] [Google Scholar]
- 31.Pal A., Indireshkumar K., Brasseur J.G. Gastric flow and mixing studied using computer simulation. Proc. Biol. Sci. 2004;271:2587–2594. doi: 10.1098/rspb.2004.2886. [DOI] [PMC free article] [PubMed] [Google Scholar]
- 32.Hirst G.D., Edwards F.R. Electrical events underlying organized myogenic contractions of the guinea pig stomach. J. Physiol. 2006;576:659–665. doi: 10.1113/jphysiol.2006.116491. [DOI] [PMC free article] [PubMed] [Google Scholar]
- 33.Szurszewski J.H., Farrugia G. Carbon monoxide is an endogenous hyperpolarizing factor in the gastrointestinal tract. Neurogastroenterol. Motil. 2004;16(Suppl 1):81–85. doi: 10.1111/j.1743-3150.2004.00480.x. [DOI] [PubMed] [Google Scholar]
- 34.Yoshitomi S., Martin A., Imamura M. Electrogastroenterographic examination of 22 patients before and after cholecystectomy. Dig. Dis. Sci. 1996;41:1700–1705. doi: 10.1007/BF02088733. [DOI] [PubMed] [Google Scholar]
- 35.Chen J.D., Zou X., Liang J. Detection of gastric slow wave propagation from the cutaneous electrogastrogram. Am. J. Physiol. 1999;277:G424–G430. doi: 10.1152/ajpgi.1999.277.2.G424. [DOI] [PubMed] [Google Scholar]
- 36.Chen J.D., Vandewalle J., Janssens J. Observation of the propagation direction of human electrogastric activity from cutaneous recordings. Med. Biol. Eng. Comput. 1989;27:538–542. doi: 10.1007/BF02441475. [DOI] [PubMed] [Google Scholar]
- 37.Mirizzi N., Scafoglieri U. Optimal direction of the electrogastrographic signal in man. Med. Biol. Eng. Comput. 1983;21:385–389. doi: 10.1007/BF02442624. [DOI] [PubMed] [Google Scholar]
- 38.Chen J.D., McCallum R.W. Electrogastrography: measurement, analysis and prospective applications. Med. Biol. Eng. Comput. 1991;29:339–350. doi: 10.1007/BF02441653. [DOI] [PubMed] [Google Scholar]
- 39.Sanders K.M. Regulation of smooth muscle excitation and contraction. Neurogastroenterol. Motil. 2008;20(Suppl 1):39–53. doi: 10.1111/j.1365-2982.2008.01108.x. [DOI] [PMC free article] [PubMed] [Google Scholar]
- 40.Buist M.L., Poh Y.C. An extended bidomain framework incorporating multiple cell types. Biophys. J. 2010;99:13–18. doi: 10.1016/j.bpj.2010.03.054. [DOI] [PMC free article] [PubMed] [Google Scholar]
- 41.Farrugia G. Ionic conductances in gastrointestinal smooth muscles and interstitial cells of Cajal. Annu. Rev. Physiol. 1999;61:45–84. doi: 10.1146/annurev.physiol.61.1.45. [DOI] [PubMed] [Google Scholar]
- 42.Mintchev M.P., Otto S.J., Bowes K.L. Electrogastrography can recognize gastric electrical uncoupling in dogs. Gastroenterology. 1997;112:2006–2011. doi: 10.1053/gast.1997.v112.pm9178693. [DOI] [PubMed] [Google Scholar]
- 43.Lammers W.J., Ver Donck L., Schuurkes J.A. Focal activities and re-entrant propagations as mechanisms of gastric tachyarrhythmias. Gastroenterology. 2008;135:1601–1611. doi: 10.1053/j.gastro.2008.07.020. [DOI] [PubMed] [Google Scholar]
- 44.Bradshaw L.A., Cheng L.K., Pullan A.J. Surface current density mapping for identification of gastric slow wave propagation. IEEE Trans. Biomed. Eng. 2009;56:2131–2139. doi: 10.1109/TBME.2009.2021576. [DOI] [PMC free article] [PubMed] [Google Scholar]
Associated Data
This section collects any data citations, data availability statements, or supplementary materials included in this article.