

Abstract
Recent work has indicated that the shape and size of a cell can influence how a cell spreads, develops focal adhesions, and exerts forces on the substrate. However, it is unclear how cell shape regulates these events. Here we present a computational model that uses cell shape to predict the magnitude and direction of forces generated by cells. The predicted results are compared to experimentally measured traction forces, and show that the model can predict traction force direction, relative magnitude, and force distribution within the cell using only cell shape as an input. Analysis of the model shows that the magnitude and direction of the traction force at a given point is proportional to the first moment of area about that point in the cell, suggesting that contractile forces within the cell act on the entire cytoskeletal network as a single cohesive unit. Through this model, we demonstrate that intrinsic properties of cell shape can facilitate changes in traction force patterns, independently of heterogeneous mechanical properties or signaling events within the cell.
The importance of cell shape has been demonstrated in numerous cell events including proliferation (1,2), cell spreading dynamics (3), and stem cell lineage commitment (4). Many of these studies have demonstrated a link between cell shape and cytoskeletal tension, but the mechanism underlying this link is not well understood (3,5,6). Here we test the hypothesis that cell shape is a determinant of local cell traction forces and find compelling results. Numerous studies have presented models that predict cell-generated traction forces; these include models based on biochemical interactions of actin and myosin (7,8), the curvature of the cell membrane (9,10), and finite element modeling of sheets of cells (11). However, the simplicity of the current model is that it uses only cell shape as an input. This model is based on the assumption that the network of actin fibers within a cell act as a cohesive structural unit.
An initial model was developed to predict traction forces generated by cells on microfabricated post array detectors (mPADs), which consist of a uniform array of deformable silicon posts that bend in response to cell contraction and have previously been used to quantify traction forces generated by various cell types (6) (discussed further in the Supporting Material). Traction forces can be calculated from the deflection and stiffness of each post (Fig. 1 A). To model the contracting cytoskeleton, an array of linear elements was constructed in a trusslike configuration (Fig. 1 B). Nodes were placed at the centroid of each mPAD post and linear elements (green lines) were drawn that connected each node to all other nodes within the cell, as long as the linear element did not cross the cell perimeter. Cell perimeters were determined by binary masks of F-actin immunofluorescence images. Thus, while individual truss elements do not correspond to a structure within the cell, the assembled truss of linear elements represents a first-order approximation of a cohesive cytoskeletal network.
Figure 1.
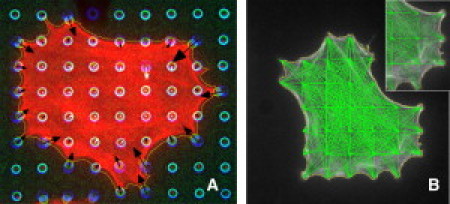
Measurement of traction forces and structure of the model. (A) Cells were plated onto mPADs, which measured traction forces at discrete locations based on the deflection of individual mPAD posts. (B) The constructed truss model with linear elements shown in green.
All truss elements were assumed to have a constant tension per unit length, consistent with the idea of a uniform contractile state. Components of tensile elements terminating at each node were summed to give a resultant force vector at each post. Fig. 2 A shows a representative map of measured mPAD traction force vectors (black arrows) and predicted traction force vectors (blue arrows). Traction force maps were predicted for a population of 71 mouse embryo fibroblast cells (1289 vectors).
Figure 2.
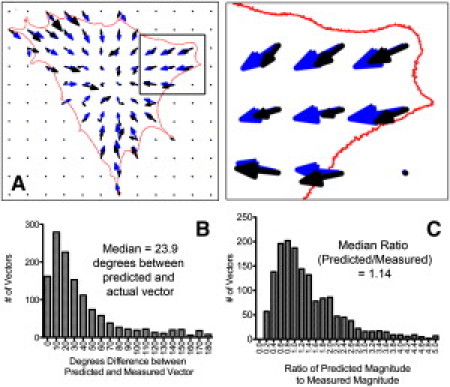
(A) Prediction of traction force vectors. An overlay of predicted (blue) and measured (black) traction forces demonstrates the model performance. Cell outline is shown in red. (B) Histogram of directional difference between predicted and measured vectors. (C) Histogram of the ratio between predicted and measured magnitude.
Model accuracy was evaluated based on the ability to predict direction and magnitude of measured traction vectors. Directional accuracy was assessed by measuring the angle between the predicted and measured vectors. A histogram of the directional difference between measured and predicted vectors shows that a majority differ by <30° (Fig. 2 B). Magnitude agreement was assessed by calculating the ratio between predicted and measured vector magnitude; a ratio of 1.0 indicates complete agreement between model and experiment. A histogram of these ratios (Fig. 2 C) shows a peak at ∼1.0, with a majority of vectors having a ratio between 0.6 and 1.4. These data demonstrate that this truss model can predict traction force vectors with reasonable accuracy.
The truss model assumes that the cytoskeleton is acting as a single structure within the cell, and thus the entire cell shape contributes to the predicted traction force vector. To confirm this, we constructed a local truss model, in which only elements that connected neighboring posts were used. Results from the local truss models performed poorly when only nearest neighbors were used, and performance improved as the distance of neighboring posts used in the truss was increased (see Fig. S1 in the Supporting Material). Optimal performance was seen when the entire cell was included.
While the performance of such a simple model may initially be surprising, analysis of the truss model shows that it is actually a discretization of the first moment of area about each mPAD post. The forces at each node in the truss can be rewritten by breaking down each element into x- and y components. Thus, the resultant x- and y components of force at a given node are given by the equations
where μ is the tension per unit length, xi and yi are the distances between the node of interest and each column or row of posts, and Nx,i and Ny,i are the number of posts in that given column or row that are occupied by posts (Fig. 3 A). Expansion of this model to continuous space replaces the above discrete equations with the continuous integrals
where σ is now the tension per unit area, and dAx and dAy are the differential areas at each distance x or y from the point of interest. The integral in this equation is by definition the first moment of area about the given node. Thus, the model predicts that forces at the centroid of the cell will be zero, and that forces away from the cell centroid are directed toward the centroid, and are proportional to their distance from the centroid.
Figure 3.
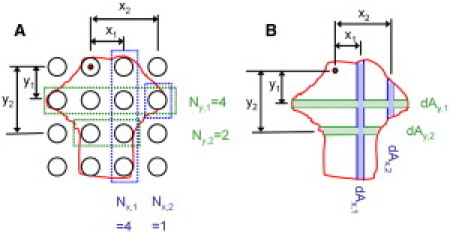
Expansion of the model from the discrete space of mPADs to continuous space. (A) Relevant values for prediction of vectors from cells on mPADs (cell outlined in red, black circles represent mPAD posts). Ny,i and Nx,i represent the number of cell-occupied posts in a given row (green) or column (blue), respectively. (B) In the continuous integral form, Ny,i and Nx,i are replaced with differential areas dAx,i and dAy,i respectively.
To demonstrate the applicability of the first-moment-of-area (FMA) model to traction forces on continuous substrates, cell geometries were selected from previously published works in which traction forces were measured on continuous substrates. These geometries were then used as inputs in the FMA model, and traction forces were predicted (Fig. 4). Each geometry was previously investigated in published studies using deformable continuous substrates to measure forces. Wang et al. (12) measured traction forces in Focal Adhesion Kinase-null cells reexpressing Focal Adhesion Kinase. These cells showed large traction forces at the peripheral lamellipodia with smaller vectors toward the cell interior. Forces in the extended lamellipodia were directed toward the cell center. The traction force map predicted by the FMA model shows a similar pattern of forces (Fig. 4 A). Traction forces were also measured in endothelial cells plated onto deformable substrates by Parker et al. (13). These cells were plated onto square patterns of Type I collagen. Cells spread to fill the square patterns, and showed large traction forces at the corners of cells. The traction force map predicted by the FMA model shows similarly large forces in the cell corners (Fig. 4 B). Fournier et al. (14) used traction force microscopy to study forces in migrating keratocytes, and showed large lateral forces directed toward the cell center, with smaller forces at the leading and trailing edge, which are predicted by the FMA model (Fig. 4 C).
Figure 4.
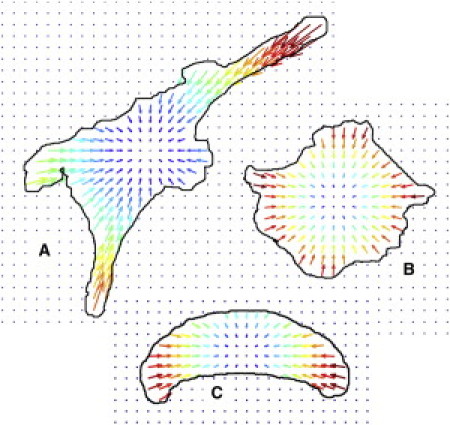
Predictions of traction forces based on the first moment of area (FMA) model. Three geometries were selected from existing literature that measured traction forces on continuous substrates. These geometries were used in the FMA model to predict traction forces: (A) a well-spread fibroblast, (B) an endothelial cell plated onto patterned substrates, and (C) a migrating keratocyte. Vectors are colored by relative scale from blue (smallest) to red (largest).
The results of the FMA model suggest that changes in cell shape could serve to determine the distribution and relative magnitudes of cellular traction forces. These predictions do not require assumptions regarding heterogeneities in cell stiffness or signaling events; they are entirely based on the geometry of the cell. This is consistent with the concept proposed by Cai et al. (15) in which the cytoskeleton functions as a cohesive unit in a myosin-dependent fashion. In support of this hypothesis, the FMA/Truss model performs poorly when predicting forces in fibroblasts in which myosin is inhibited with blebbistatin (see Fig. S2). However, this cohesive structure is most likely a composite of cortical actin, actin stress fibers, myosin, intermediate filaments, and possibly microtubules. It is also important to note that the model predicts the force at each point within the cell; however, cell traction force transmission to matrix in situ is limited to sites of matrix adhesion. Thus, cells may regulate traction force patterns by rearranging the topography of cell-matrix attachment. These data suggest a means by which cell shape may regulate the magnitude of traction forces throughout the cell as an additional input that may be integrated with subcellular differences in signaling and biomechanics during cell migration and spreading. The prediction of traction force based on the first moment of area around any given location in the cell provides novel insights into the contributions of cell size and shape to traction force at the cell-matrix interface.
Acknowledgments
The authors acknowledge Dr. Christopher Chen for helpful discussions.
This work was supported by the National Science Foundation (grant No. MCB-0923661), the National Institutes of Health (grant Nos. HL088203 and GM089331), and the U.S. Department of Defense (grant No. BC06911).
Contributor Information
Christopher A. Lemmon, Email: christopher.lemmon@duke.edu.
Lewis H. Romer, Email: lromer@jhmi.edu.
Supporting Material
References and Footnotes
- 1.Pirone D.M., Liu W.F., Chen C.S. An inhibitory role for FAK in regulating proliferation: a link between limited adhesion and RhoA-ROCK signaling. J. Cell Biol. 2006;174:277–288. doi: 10.1083/jcb.200510062. [DOI] [PMC free article] [PubMed] [Google Scholar]
- 2.Dike L.E., Chen C.S., Ingber D.E. Geometric control of switching between growth, apoptosis, and differentiation during angiogenesis using micropatterned substrates. In Vitro Cell. Dev. Biol. Anim. 1999;35:441–448. doi: 10.1007/s11626-999-0050-4. [DOI] [PubMed] [Google Scholar]
- 3.Reinhart-King C.A., Dembo M., Hammer D.A. The dynamics and mechanics of endothelial cell spreading. Biophys. J. 2005;89:676–689. doi: 10.1529/biophysj.104.054320. [DOI] [PMC free article] [PubMed] [Google Scholar]
- 4.McBeath R., Pirone D.M., Chen C.S. Cell shape, cytoskeletal tension, and RhoA regulate stem cell lineage commitment. Dev. Cell. 2004;6:483–495. doi: 10.1016/s1534-5807(04)00075-9. [DOI] [PubMed] [Google Scholar]
- 5.Reinhart-King C.A., Dembo M., Hammer D.A. Endothelial cell traction forces on RGD-derivatized polyacrylamide substrata. Langmuir. 2003;19:1573–1579. [Google Scholar]
- 6.Tan J.L., Tien J., Chen C.S. Cells lying on a bed of microneedles: an approach to isolate mechanical force. Proc. Natl. Acad. Sci. USA. 2003;100:1484–1489. doi: 10.1073/pnas.0235407100. [DOI] [PMC free article] [PubMed] [Google Scholar]
- 7.Deshpande V.S., McMeeking R.M., Evans A.G. A bio-chemo-mechanical model for cell contractility. Proc. Natl. Acad. Sci. USA. 2006;103:14015–14020. doi: 10.1073/pnas.0605837103. [DOI] [PMC free article] [PubMed] [Google Scholar]
- 8.McGarry J.P., Fu J., Deshpande V.S. Simulation of the contractile response of cells on an array of micro-posts. Philos. Transact. A Math. Phys. Eng. Sci. 2009;367:3477–3497. doi: 10.1098/rsta.2009.0097. [DOI] [PMC free article] [PubMed] [Google Scholar]
- 9.Bischofs I.B., Klein F., Schwarz U.S. Filamentous network mechanics and active contractility determine cell and tissue shape. Biophys. J. 2008;95:3488–3496. doi: 10.1529/biophysj.108.134296. [DOI] [PMC free article] [PubMed] [Google Scholar]
- 10.Bischofs I.B., Schmidt S.S., Schwarz U.S. Effect of adhesion geometry and rigidity on cellular force distributions. Phys. Rev. Lett. 2009;103:048101. doi: 10.1103/PhysRevLett.103.048101. [DOI] [PubMed] [Google Scholar]
- 11.Nelson C.M., Jean R.P., Chen C.S. Emergent patterns of growth controlled by multicellular form and mechanics. Proc. Natl. Acad. Sci. USA. 2005;102:11594–11599. doi: 10.1073/pnas.0502575102. [DOI] [PMC free article] [PubMed] [Google Scholar]
- 12.Wang H.B., Dembo M., Wang Y. Focal adhesion kinase is involved in mechanosensing during fibroblast migration. Proc. Natl. Acad. Sci. USA. 2001;98:11295–11300. doi: 10.1073/pnas.201201198. [DOI] [PMC free article] [PubMed] [Google Scholar]
- 13.Parker K.K., Brock A.L., Ingber D.E. Directional control of lamellipodia extension by constraining cell shape and orienting cell tractional forces. FASEB J. 2002;16:1195–1204. doi: 10.1096/fj.02-0038com. [DOI] [PubMed] [Google Scholar]
- 14.Fournier M.F., Sauser R., Verkhovsky A.B. Force transmission in migrating cells. J. Cell Biol. 2010;188:287–297. doi: 10.1083/jcb.200906139. [DOI] [PMC free article] [PubMed] [Google Scholar]
- 15.Cai Y., Rossier O., Sheetz M.P. Cytoskeletal coherence requires myosin-IIA contractility. J. Cell Sci. 2010;123:413–423. doi: 10.1242/jcs.058297. [DOI] [PMC free article] [PubMed] [Google Scholar]
Associated Data
This section collects any data citations, data availability statements, or supplementary materials included in this article.