

Abstract
During protein biosynthesis the ribosome moves along mRNA in steps of precisely three nucleotides. The mechanism for this ribosome motion remains elusive. Using a classification algorithm to sort single-molecule fluorescence resonance energy transfer data into subpopulations, we found that the ribosome dynamics detected at the peptidyl transferase center are highly inhomogeneous. The pretranslocation complex has at least four subpopulations that sample two hybrid states, whereas the posttranslocation complex is mainly static. We observed transitions among the ribosome subpopulations under various conditions, including 1), in the presence of EF-G; 2), spontaneously; 3), in different buffers, and 4), bound to antibiotics. Therefore, these subpopulations represent biologically active ribosomes. One key observation indicates that the Hy2 hybrid state only exists in a fluctuating ribosome subpopulation, which prompts us to propose that ribosome dynamics are hierarchically arranged. This proposal may have important implications for the regulation of cellular translation rates.
Introduction
The ribosome is a large ribonucleoprotein particle composed of two asymmetric subunits, termed the 30S and 50S subunits (1). During ribosome translocation, tRNAs move from the A- and P-sites to the P- and E-sites, respectively, and ribosomes slide on the mRNA in steps of exactly three nucleotides. The terms “pretranslocation complex” and “posttranslocation complex” refer to the ribosome configurations before and after this translocation process. Remarkably, the ribosome moves processively with a fast speed (22 amino acids per second (2)) and a low error rate with respect to loss of the reading frame (one error in every 30,000 codons (3)). Not surprisingly, this process consumes external energy in the form of GTP via the enzyme EF-G.
A key intermediate state in the translocation process is the putative hybrid state. This state was first detected in chemical footprinting studies (4) after being predicted by theory (5). According to the model that describes the hybrid state, the P/P and A/A tRNAs translocate to their respective E/E and P/P positions via a hybrid P/E-A/P intermediate (the first and second letters refer to the tRNA-binding site in the 30S and 50S subunits, respectively). Further fast-kinetic and single-molecule studies suggested the possibility of the existence of two hybrid states (6,7). However, cryo-electron microscopy (cryo-EM) and other single-molecule studies favored a single hybrid-state model (8–11).
The formation of the hybrid state is closely related to ribosome ratcheting. Cryo-EM studies revealed that a counter-clockwise rotation of the 30S subunit relative to the 50S subunit occurs either upon EF-G binding (12,13) or spontaneously (14,15). The combined application of fluorescence resonance energy transfer (FRET) and chemical footprinting studies on viomycin-trapped ribosome complexes indicated that the cryo-EM-identified ratcheted-ribosome complex is identical to the chemical footprinting-identified hybrid state (16). This result implies that the formation of the hybrid state is coupled with a ribosomal intersubunit rotation before or during translocation (13,17,18).
Based on first physical principles, the ribosome is postulated to be a Brownian motor (19,20) with a rugged energy landscape (19,21). However, in addition to the need for a more descriptive plot, more experimental data are needed to fully map the energy landscape in detail.
In this work, we studied the dynamics of the ribosome pre- and posttranslocation complexes (hereafter termed the Pre-complex and Post-complex, respectively) and sketched the rugged energy landscape. For the first time, as far as we know, single-molecule FRET between labeled tRNAs and the L27-labeled ribosome was studied (Fig. 1). The ribosomal protein L27 is located very close to the peptidyl center, as previously shown by x-ray and photoaffinity methods (22–25). Incorporation of the labeled L27 did not compromise the competence of the ribosome activity showed in Fig. S1 of the Supporting Material. We established a novel (to our knowledge) method for classifying the FRET signals as belonging to several subpopulations, and were able to obtain reproducible and biologically significant results. We report the following: 1), there are two spontaneously formed hybrid states (Hy1 and Hy2) in the Pre-complex; 2), the Pre-complex is composed of at least four subpopulations, including one Post-complex that forms spontaneously; and 3), the hybrid states exist mainly in fluctuating ribosomes, whereas classical states can be found in both fluctuating and nonfluctuating ribosomes. We confirmed the activity of our reported subpopulations by real-time observation of subpopulation transitions as well as their responses to environmental cues. The fact that the hybrid states exist mainly in fluctuating states implies that ribosomal dynamics are hierarchically controlled by the overall subpopulation distribution. The distribution of multiple ribosome subpopulations may have an important role in regulating the cellular translation rate.
Figure 1.
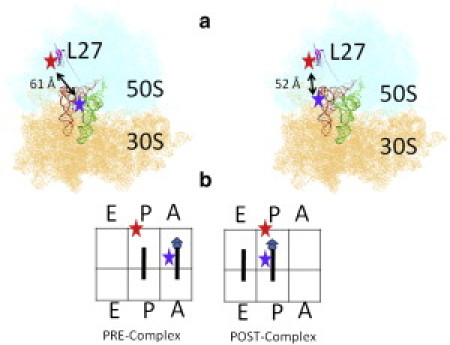
(a) The relative labeling positions of the FRET pairs on the ribosome L27 and the tRNAs at the A-site (left plot) and P-site (right plot). (b) Illustration of the ribosome complexes studied in this work. The triangle represents the N-acetyl-capped phenylalanine, and the circles represent the elongated phenylalanines.
Materials and Methods
A detailed description of our sample preparation methods is included in the Supporting Material.
Total internal reflection fluorescence measurements
An objective-based total internal reflection fluorescence setup was built on a Nikon Eclipse Ti inverted microscope with heavy modification. A 12 mW (maximum power 75 mW), 532-nm laser beam (Crystalaser, Reno, NV) was projected into the sample chamber through a 60 × 1.49 NA oil immersion objective (Nikon Instruments, Lewisville, TX) and an index-matching liquid at a glancing angle relative to the microscope slide. Total internal reflection generated evanescent waves near the sample chamber surface to excite fluorophores bound to the surface (but not those in the bulk medium). The emitted fluorescence from the donor occurred via direct excitation, and the acceptor excitation occurred via FRET. The emitted signals were collected and split by a Dual View apparatus (Optical Insights, Tucson, AZ) into the two halves of a back-thinned CCD camera (Cascade II; Photometrics, Tucson, AZ). The sample channel was prepared as described previously (26), and the final imaging buffer contained the following oxygen scavenger reagents: 3 mg/mL glucose, 100 μg/mL glucose oxidase, 48 μg/mL catalase, and 2 mM trolox (26,27). Data were collected at 100-ms intervals.
Results
FRET pair constructs and data processing
The ribosomal L27 protein was labeled with a Cy5 dye at the unique, natural C53 position. Then the protein was incorporated into an IW312 ribosome lacking L27. Yeast phenylalanine tRNA (tRNAPhe) was labeled with Cy3 dye at the 16/17 position according to previously published methods (28). The relative positions of the FRET pair are shown in Fig. 1 a. The distances between C53 of L27 and U16 on the A- and P-site tRNAs are ∼61 Å and 52 Å, respectively, which correspond to FRET efficiencies of 0.47 and 0.70 (22), respectively. We examined two specific Pre- and Post-complexes as shown in Fig. 1. The Pre-complex was formed by enzymatic delivery of the charged tRNAPhe (Phe-tRNAPhe) ternary complex into the ribosome initiation complex with biotinylated poly(U) mRNA and N-acetyl-capped Phe-tRNAPhe in the absence of EF-G. The final Pre-complex was separated from the residual reactants by a sucrose-cushion ultracentrifuge. The Post-complex was then formed by incubating the purified Pre-complex with EF-G·GTP in solution or on the surface. Both of the resulting ribosome complexes were tethered to the surface via linkage of the poly(U)-biotin-streptavidin-biotin-PEG surface. The artificial poly(U) mRNA did not compromise the biological relevance of this study or result in nonspecific signals, as confirmed by the similarity between these results and other data obtained using modified natural 032 mRNA to contain a 5′ biotin, a strong Shine-Dalgarno sequence (AAAGGA), and the first three codons encoding formyl methionine, phenylalanine, and lysine.
The single-molecule traces were selected by single-step bleaching (see Fig. S2). The data were then truncated before the bleaching points to eliminate artificial FRET populations from detector crosstalk and blinking. Some traces were truncated by more data points before bleaching if the noise level of those points was higher than the threshold. Because the lifetimes of all the dynamic species we studied were shorter than 500 ms, with average trace lengths before bleaching of ∼11 s, the extra truncation eliminated noisy data points but did not affect the kinetic fits.
The details of the data classification are described in the Supporting Material. Briefly, as shown in Fig. S2, the ribosomes were categorized according to the following criteria: 1), nonfluctuating (NF) ribosomes (Fig. S2 a) generated traces with correlation coefficients within ±0.15 between the donor and acceptor intensities with a minimum signal/noise ratio of 4:1; and 2), fluctuating (F) ribosomes (Fig. S2, b and c) were defined by the anticorrelation between donor and acceptor fluorescence as being <−0.6. Within this subgroup, the F-Low ribosomes were those that sampled FRET ≥ 0.6 for fewer than five frames (total, not required to be consecutive), and the F-High ribosomes were those that sampled FRET ≥ 0.6 for at least five frames. The number of five frames was arbitrarily chosen for noise tolerance. The average lifetime of FRET pairs was ∼110 frames (11 s). The NF ribosomes were sorted using the same threshold to obtain the fractions of ribosomes that were static at their respective FRET states, which was essentially the same as a multiple-Gaussian fitting. Only ∼15% of the total ribosomes met these criteria and were included in our analysis. Therefore, the inhomogeneity we report here represents the lower limits of the ribosome system in reality.
FRET signal validation and real-time observation of translocation
We first determined the FRET values between the L27 protein and the A- or P-site tRNAs. As shown in Fig. 2, a and b, the major FRET peak shifted from 0.44 to 0.63 when the Pre-complex was incubated with EF-G·GTP, which indicates the movement of tRNA from the A-site to the P-site. Accordingly, we determined these two FRET values to be the authentic markers for the labeled tRNA at the A- and P-sites. These assignments were consistent with the structural information (Fig. 1). Because of the uncertainty of the linkers from the dyes to the labeled molecules, the FRET values did not exactly match the distances. We further confirmed these assignments by observing the translocation as well as the FRET transitions in real time, as shown in Fig. 2 c. In a typical trace, the Pre-complex fluctuated between 0.2 and 0.44 FRET states, and then abruptly changed to a stable 0.63 FRET state after 14 s of EF-G addition. The fluctuations in the Pre-complex can be used to explain the additional peaks in Fig. 2 a because the Pre-complex was composed of inhomogeneous subpopulations, as discussed in more detail later. On the other hand, Fig. 2 b shows that the translocation was ∼50% complete in this particular experimental condition. The main reason for this incomplete reaction was the in vitro intrinsic thermodynamic equilibrium between the Pre- and Post-complexes. The specific kinetics and affinities for EF-G binding may also play important roles. Indeed, increasing the EF-G concentrations and prolonging the incubation times improved the translocation yield to 80% (Fig. S4).
Figure 2.
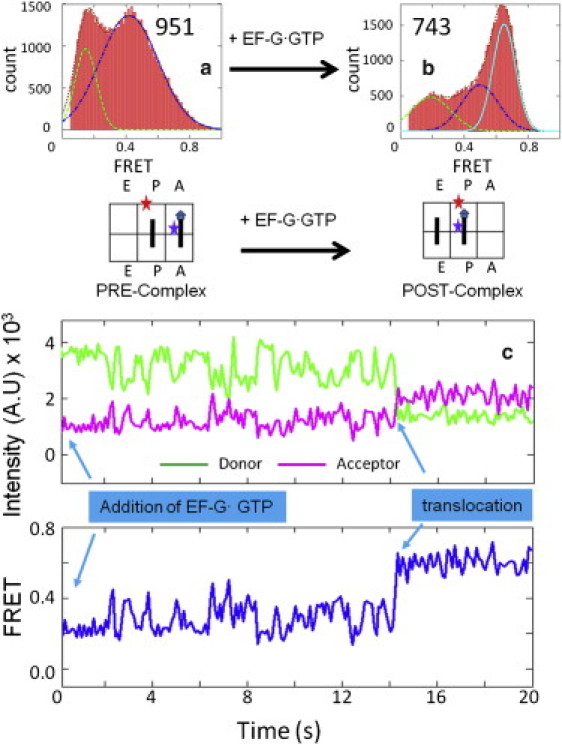
FRET distributions of the signals between the L27 protein and the A-/P-site tRNAs in the (a) Pre-complex (951 particles) and (b) Post-complex (743 particles). The sketches beneath the histogram plots show the relative position of the FRET pairs. (c) One representative trace of the real-time observation of the translocation process. Imaging began immediately after EF-G·GTP (200 nM) was loaded onto the surface-bound Pre-complex. Translocation happened after ∼14 s.
Four ribosomal Pre-complex subgroups with two hybrid states
Using our sorting method, we divided the Pre-complex into four subgroups (Fig. 3, third tier). Of the 951 total Pre-complex ribosomes, 640 particles were fluctuating and 311 particles were nonfluctuating. Of the 640 F ribosomes, 327 particles fluctuated between FRET states of 0.2 and 0.44 (Fig. 3, F-Low), and 313 particles appeared to fluctuate between FRET states of 0.2 and 0.63 (Fig. 3, F-High). Among the 311 NF ribosomes, 49 particles were in the 0.63 FRET state. The other 262 NF ribosomes were fit with two Gaussian distributions that had 59 particles at the 0.2 FRET state and 203 particles in the 0.44 FRET state. One set of representative fluorescence and FRET traces for each ribosome group is shown in Fig. 3.
Figure 3.
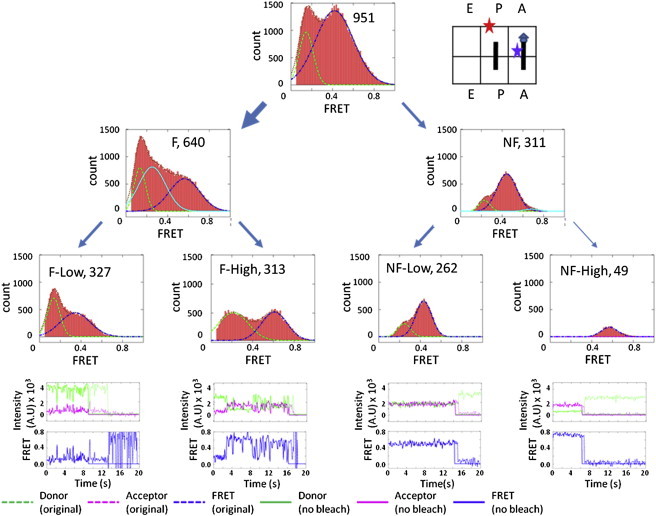
FRET efficiency histograms of the Pre-complex. Four horizontally arranged plots are shown. The top-tier plots show the FRET histogram of the total ribosomes (951 particles, as shown in the parentheses) and a cartoon of the Pre-complex. The second-tier plots show the FRET histograms of the ribosomes separated into fluctuating (F, 640 particles) and nonfluctuating (NF, 311 particles) groups. The third-tier plots show the FRET histograms of the ribosomes further separated into groups of fluctuations that were above or below a FRET value of 0.6 (F-low contained 327 particles and F-high contained 313 particles). Similar thresholds (as discussed in the text) were applied to the NF ribosomes to separate them into stable FRET states that were below or above 0.6 (NF-low contained 262 particles and NF-high contained 49 particles). The fourth-tier plots display the representative fluorescence traces of the donor and acceptor species and their corresponding FRET traces (both the original and the truncated data) from each of the four subpopulations. Legends are shown in the individual plots.
Dynamic FRET states 0.63 and 0.2 in the Pre-complex were assigned as the Hy2 and Hy1 hybrid states. There are only three possible placements for the two tRNAs in the three binding sites of the Pre-complex (Fig. 4): C (classical P/P and A/A state), Hy1 (hybrid P/E and A/A state), and Hy2 (hybrid P/E and A/P state). After the 0.44 FRET state was assigned to the classical state, we assigned FRET state 0.63 to the Hy2 state in Fig. 4 by considering that the P-site tRNA acceptor end was closer to L27. Consequently, the lowest FRET state of 0.2 was assigned to Hy1, the only possible placement left.
Figure 4.
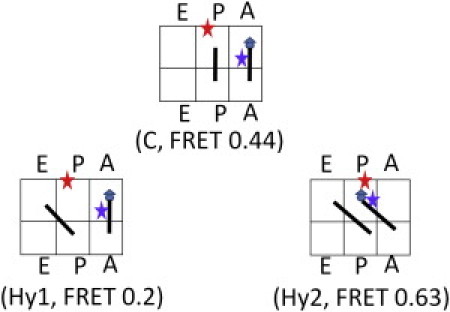
Possible configurations of the FRET states observed in the Pre-complex. C is the classical state corresponding to the FRET efficiency of 0.44. Hy1 and Hy2 are the two possible hybrid states. The Hy1 state is assigned to the FRET state of 0.2 formed by the independent movement of the P-site tRNA. The Hy2 state is assigned to the FRET state of 0.63. Hy2 is most likely coupled with the ribosome intersubunit ratcheting.
Although the Hy2 in Fig. 4 and the Post-complex in Fig. 1 have similar FRET values, they are very different from a dynamics point of view. The Hy2 state mainly existed in F ribosome populations in the Pre-complex (Fig. 3, F-High), whereas the Post-complex was mainly static (Fig. S3, NF-High).
The formation of Hy1 involved only the movement of the P-site tRNA (6,7). Although the low FRET value is not completely understood, it is probably due to tRNA rotational motions involved in Hy1 formation (29). Ribosome complexes charged with varied A-site tRNA generated varied percentages of this low-FRET state (from 6% to 38%) due to the varied A-site conformations (Fig. S5). In Fig. S5, the NF-Low subpopulations of three ribosome complexes are compared with dipeptidyl tRNA (Fig. S5 a, Pre-1), amino acyl tRNA (Fig. S5 b, Pre-2), or uncharged tRNA (Fig. S5 c, Pre-3) at the A-site. It is known that only peptidyl tRNA samples the A/P state efficiently, whereas the other two types of tRNA bind predominantly with A/A conformations (30–32). With a decreased ability to form the A/P state, the Pre-2 and Pre-3 complexes should promote more Hy1 states with A/A-P/E configurations, assuming the P-site tRNA dynamics is not affected. This rationalization agrees well with our experimental results. Fig. S5 shows that the static Hy1 state increased from 6% in the Pre-1 complex to 34% and 38% in the Pre-2 and Pre-3 complexes, respectively. It also shows that nonfluctuating populations predominated in the absence of peptidyl tRNA at the A-site, with NF-Low populations of 83 ± 2% and 84 ± 2% in Pre-2 and -3, respectively, compared to only 23 ± 3% in the Pre-1 complex. These results suggest that A-site peptidyl tRNA is essential for formation of an inhomogeneous population in Pre-complexes, in addition to P-site tRNA deacylation (12).
In summary, the Pre-complex can be categorized into at least four subgroups: 1), F-Low, in which there is fluctuation between C and Hy1 (34 ± 5%); 2), F-High, in which there is fluctuation between C and Hy2 (33 ± 5%) and possible involvement of three FRET states, as discussed further below; 3), NF-Low, a steady conformation in either C (20 ± 3%) or Hy1 (6 ± 2%); and 4), NF-High, which is composed of spontaneously formed Post-complex (5 ± 1%). The errors are calculated from at least three independent measurements. The energy gaps between these subpopulations ranged from 0.5 to 1.5 KBTr (where KB is the Boltzmann constant and Tr = 298 K) as deduced from their kinetics. The simultaneous presence of the ribosome subpopulations indicates that the functionally important complexes were able to exchange via thermal fluctuations. This detailed dynamic diversity was only observable after we applied our new data classification scheme.
The 20% of the population sampling C is consistent with the cryo-EM estimation of the classical state in the Pre-complex (30% in Agirrezabala et al. (15)). The two hybrid states are consistent with previous results (7). The classical state accounts for ∼60% of the total population without the use of our data classification, in agreement with other single-molecule studies (7,33,34).
Demonstration of ribosome subpopulation activity
Three of the four subpopulations in the Pre-complex underwent stochastic transitions among each other. Fig. 5 shows one representative trace. In the 20-s imaging window, an F-Low ribosome changed into an NF-Low at the FRET states of 0.24 and 0.5. This ribosome then fluctuated between 0.2 and 0.6 (F-High) before returning to the F-Low group. The exact FRET values deviated slightly from the peak values of the FRET histograms because of the Poisson distribution of the individual traces. Thirty-four ribosomes out of 313 F-High particles in the Pre-complex showed transitions with different dynamics. However, only three of these 34 ribosomes turned into a stable high-FRET state (0.63), which could be due to spontaneous translocation processes.
Figure 5.
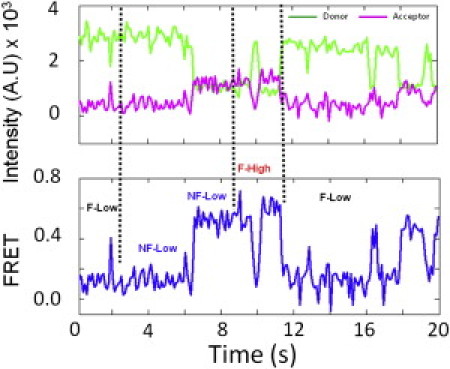
Real-time stochastic transitions of ribosome subpopulations in the Pre-complex. The dotted lines separate the different types of dynamics. Although the exact points of the transitions are hard to identify, the overall transitions among the different ribosome subpopulations are obvious.
We further examined the redistribution of the subpopulations under different buffer conditions as well as in the presence of Viomycin. Low concentrations of Mg2+ are believed to favor hybrid state formation (9). Viomycin is believed to trap the ribosome in their hybrid states (16). Accordingly, we observed increased proportions of Hy2 subpopulation ribosomes when less Mg2+ (4.5 mM vs. 10 mM in TAM buffer) was in the buffer or when Viomycin was added (Fig. 6). Of interest, the increase in the Hy2 population was achieved at the expense of decreasing different subpopulations under the two different conditions. These results imply that different mechanisms are involved in the promotion of more hybrid states by Mg2+ or Viomycin (35).
Figure 6.
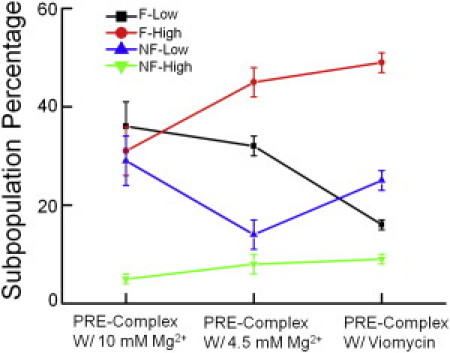
Redistribution of the Pre-complex subpopulations in 10 mM Mg2+ or 4.5 mM Mg2+ buffers, or bound with Viomycin. The color codes for the subpopulations are shown in the plot. With decreasing Mg2+ concentrations, F-High increases mainly at the expense of decreasing NF-Low, whereas in the presence of Viomycin, F-High increases mainly at the expense of decreasing F-Low. The error bars are calculated from at least three independent measurements.
In conclusion, Figs. 2, 5, and 6 demonstrate that all four of the subpopulations we observed were active or coupled with active ribosomes. However, because these ribosomes were selected with reasonably high signal/noise ratios at a specific threshold, they accounted for only 15% of the total ribosome signals we detected on the surface. Consequently, these subpopulations did not describe the complete population of ribosomes. Therefore, the inhomogeneity we observed here represents the lower limit for the real biological system.
Spontaneous formation and fluctuation of ribosome hybrid states in the sublevel dynamic region
Our results show that the fluctuations of Hy1 and Hy2 were intrinsic and did not require any external energy input. The exchange rates in the fluctuating ribosomes were deduced with the use of the hidden Markov model (HaMMy) analysis package (36) (Fig. S6 and Fig. S7; Table 1). In F-Low, the ribosomes fluctuated between FRET states 0.2 and 0.44 with a kforward of 3.5 s−1 and a kbackward of 4.3 s−1. In F-High, HaMMy fitting revealed three FRET states (0.2, 0.44, and 0.63) instead of the two apparent FRET states shown in Fig. 3. The transition rates ranged from 2.9 s−1 to 5.4 s−1 (Table 1). There was no obvious order for the transitions among the FRET states, indicating that the tRNAs' movements were not tightly coupled.
Table 1.
Kinetic analysis of transitions among tRNA hybrid and classical states in the fluctuating ribosome subpopulations
| Pre-complex |
||
|---|---|---|
| Ribosome | F-Low (34% of total ribosomes) | F-High (33% of total ribosomes) |
| Transitions | k (s−1) | k (s−1) |
| Hy1→C | 3.5 | 4.6 |
| C→Hy1 | 4.3 | 5.4 |
| C→Hy2 | 5.1 | |
| Hy2→C | 2.9 | |
| Hy1→Hy2 | 5.0 | |
| Hy2→Hy1 | 3.7 | |
The kinetics and free-energy differences of ribosome fluctuations among the C, Hy1, and Hy2 states in the Pre-complex were obtained from the HaMMy analysis package with idealized FRET traces. The dwell-time histograms of each FRET state corresponding to specific transitions were also obtained. For example, the transition of Hy1→C was obtained by counting the dwell times of the FRET state Hy1 before it transitioned into C. Any Hy1 FRET states that transitioned into Hy2 were not included, and vice versa. The transition rates were then obtained by fitting the dwell-time histogram to a single exponential decay.
We note that the hybrid states (Hy1 and Hy2) were not abundant in the stable ribosome complex (NF in Fig. 3) even though they were energetically similar to the classical state (C), based on their fast and similar fluctuation rates (Table 1). The Hy2 ribosomes existed only in equilibrium with the C and Hy1 states (F-High ribosomes of Fig. 3). In contrast, the C ribosomes existed either with or without fluctuation with the Hy1 or Hy2 states (F-Low, F-High, and NF-Low ribosomes of Fig. 3). If these fluctuations occurred on a global level, we would expect to see a 60% versus 40% distribution of the static Hy2 versus C populations, as implied by their exchange rates in Table 1. However, the real ratio of Hy2 versus C was <25% versus 75% even if we assumed that the static FRET state 0.63 is Hy2 (Fig. 3). This discrepancy can be resolved through the use of a hierarchic model, i.e., a model in which the static and fluctuating ribosomes are not coupled by the relative energy of the states (in this case, C, Hy1, and Hy2), but are instead determined by higher-level regulations. Therefore, using this model, multiple-ribosome subpopulations would be allowed to coexist. In other words, the ribosomes would first be distributed into different subpopulations, and then different dynamics would evolve within each subpopulation.
Our interpretation differs from the general view of classical and hybrid states, in which two global conformations and their distributions are governed by their relative free-energy levels (11,13). In our model, the percentages of the hybrid and classical states are determined by the relative percentages of the different ribosome subpopulations. Within the specific subpopulation, the fluctuation followed the local energy gaps. Our model is compatible with the current hybrid state model because the current model likely describes the dynamics within one of our proposed fluctuating ribosome subpopulations without explicit knowledge of their existence.
Discussion
Hierarchical regulation of ribosome hybrid state formation
By classifying the FRET signals in the Pre-complex (Fig. 1), we directly detected three FRET states with fluctuations of ∼0.2, 0.44, and 0.63. They were assigned to the P/E-A/A hybrid state, the P/P-A/A classical state, and the P/E-A/P hybrid state, respectively (Figs. 2 and 3). Both of the hybrid states exist predominantly in the F ribosomes, not in the NF ribosomes. This can best be explained by a ribosomal bifurcation whereby the ribosomal dynamics vary for each type of ribosome. For example, the 0.44 FRET state in the stable ribosome populations (NF in Fig. 3) is not directly interchangeable with the 0.44 FRET state in the fluctuating populations (F in Fig. 3) because they are in different ribosome subpopulations. Consequently, the regulation of the hybrid state fluctuation is achieved by varying the partitions of the ribosome subpopulations rather than by varying the thermodynamic parameters of the hybrid states directly. In other words, the ribosome hybrid state fluctuations occur with sublevel dynamics and are thus hierarchically regulated.
We therefore propose a hierarchically regulated, hybrid-state model (Fig. 7). The expanded, rugged energy landscape of the Pre-complex is shown in the top part of Fig. 7. The ribosome conformations that correspond to the potential wells are listed underneath the curve. The ribosome subpopulations are regulated by hierarchic barriers as labeled. The Post- and Pre-complexes are separated by first-level kinetic barriers. After overcoming the first barrier by deacylation of the P-site tRNA, the Pre-complex is able to sample a rugged potential surface. A second-level barrier separates the fluctuating and nonfluctuating conformations, and a third-level barrier further separates the fluctuations between C and Hy1 or C, Hy1, and Hy2. Assuming that the formation of Hy2 is coupled to ribosome ratcheting (16), our model shows that the ratcheting is spontaneous in certain ribosomes (F-High). In addition, the ratcheting and P-site tRNA formation of the P/E state are not coupled.
Figure 7.
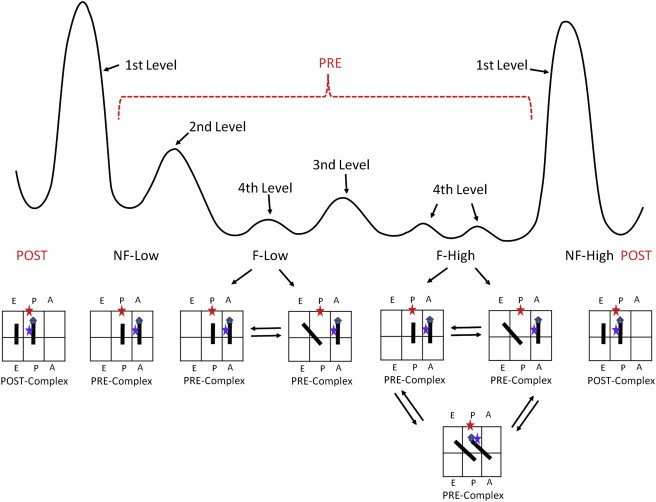
The expanded, rugged, qualitative energy potential in the Pre-complex. The Post- and Pre-complexes are separated by first-level kinetic barriers. After deacylation of the P-site tRNA, the Pre-complex is able to sample a rugged potential surface. A second-level barrier separates the fluctuating and nonfluctuating conformations, and a third-level barrier further separates the fluctuations between C and Hy1 or C, Hy1, and Hy2. The motions of tRNAs to form A/P state and the P/E state are not coupled.
Although the hierarchical model has been applied in other biological fields, this study is the first, to our knowledge, to apply this model with explicit data. Our view of the hierarchical regulation in ribosomes is consistent with and supported by other studies (21,37–39). This model should be generally useful for studying other ribosome dynamics. For example, the movement of ribosomes on mRNA is known to be nonuniform during the regulation of gene expression (40) and arrested during cell division (41). Ribosomes may achieve varied rates and translation arrest through fluctuations among different types of subpopulations.
Acknowledgments
We appreciate the kind gifts of the IW312 ribosome glycerol stock from Prof. Robert A. Zimmermann, and plasmids from Profs. Yale E. Goldman, Barry S. Cooperman, and Jacek Wower. We thank Guangtao Song for collecting some of the single-molecule data.
This work was supported by startup funds from the University of Houston and a grant to Y.W. from the Welch Foundation (E-1721).
Supporting Material
References
- 1.Schmeing T.M., Ramakrishnan V. What recent ribosome structures have revealed about the mechanism of translation. Nature. 2009;461:1234–1242. doi: 10.1038/nature08403. [DOI] [PubMed] [Google Scholar]
- 2.Liang S.T., Xu Y.C., Bremer H. mRNA composition and control of bacterial gene expression. J. Bacteriol. 2000;182:3037–3044. doi: 10.1128/jb.182.11.3037-3044.2000. [DOI] [PMC free article] [PubMed] [Google Scholar]
- 3.Nierhaus K.H. Decoding errors and the involvement of the E-site. Biochimie. 2006;88:1013–1019. doi: 10.1016/j.biochi.2006.02.009. [DOI] [PubMed] [Google Scholar]
- 4.Moazed D., Noller H.F. Intermediate states in the movement of transfer RNA in the ribosome. Nature. 1989;342:142–148. doi: 10.1038/342142a0. [DOI] [PubMed] [Google Scholar]
- 5.Bretscher M.S. Translocation in protein synthesis: a hybrid structure model. Nature. 1968;218:675–677. doi: 10.1038/218675a0. [DOI] [PubMed] [Google Scholar]
- 6.Pan D., Kirillov S.V., Cooperman B.S. Kinetically competent intermediates in the translocation step of protein synthesis. Mol. Cell. 2007;25:519–529. doi: 10.1016/j.molcel.2007.01.014. [DOI] [PMC free article] [PubMed] [Google Scholar]
- 7.Munro J.B., Altman R.B., Blanchard S.C. Identification of two distinct hybrid state intermediates on the ribosome. Mol. Cell. 2007;25:505–517. doi: 10.1016/j.molcel.2007.01.022. [DOI] [PMC free article] [PubMed] [Google Scholar]
- 8.Scheres S.H., Gao H., Carazo J.M. Disentangling conformational states of macromolecules in 3D-EM through likelihood optimization. Nat. Methods. 2007;4:27–29. doi: 10.1038/nmeth992. [DOI] [PubMed] [Google Scholar]
- 9.Kim H.D., Puglisi J.D., Chu S. Fluctuations of transfer RNAs between classical and hybrid states. Biophys. J. 2007;93:3575–3582. doi: 10.1529/biophysj.107.109884. [DOI] [PMC free article] [PubMed] [Google Scholar]
- 10.Agirrezabala X., Frank J. Elongation in translation as a dynamic interaction among the ribosome, tRNA, and elongation factors EF-G and EF-Tu. Q. Rev. Biophys. 2009;42:159–200. doi: 10.1017/S0033583509990060. [DOI] [PMC free article] [PubMed] [Google Scholar]
- 11.Cornish P.V., Ermolenko D.N., Ha T. Spontaneous intersubunit rotation in single ribosomes. Mol. Cell. 2008;30:578–588. doi: 10.1016/j.molcel.2008.05.004. [DOI] [PMC free article] [PubMed] [Google Scholar]
- 12.Valle M., Zavialov A., Frank J. Locking and unlocking of ribosomal motions. Cell. 2003;114:123–134. doi: 10.1016/s0092-8674(03)00476-8. [DOI] [PubMed] [Google Scholar]
- 13.Frank J., Agrawal R.K. A ratchet-like inter-subunit reorganization of the ribosome during translocation. Nature. 2000;406:318–322. doi: 10.1038/35018597. [DOI] [PubMed] [Google Scholar]
- 14.Julián P., Konevega A.L., Valle M. Structure of ratcheted ribosomes with tRNAs in hybrid states. Proc. Natl. Acad. Sci. USA. 2008;105:16924–16927. doi: 10.1073/pnas.0809587105. [DOI] [PMC free article] [PubMed] [Google Scholar]
- 15.Agirrezabala X., Lei J., Frank J. Visualization of the hybrid state of tRNA binding promoted by spontaneous ratcheting of the ribosome. Mol. Cell. 2008;32:190–197. doi: 10.1016/j.molcel.2008.10.001. [DOI] [PMC free article] [PubMed] [Google Scholar]
- 16.Ermolenko D.N., Spiegel P.C., Noller H.F. The antibiotic viomycin traps the ribosome in an intermediate state of translocation. Nat. Struct. Mol. Biol. 2007;14:493–497. doi: 10.1038/nsmb1243. [DOI] [PubMed] [Google Scholar]
- 17.Frank J., Gao H., Taylor D.J. The process of mRNA-tRNA translocation. Proc. Natl. Acad. Sci. USA. 2007;104:19671–19678. doi: 10.1073/pnas.0708517104. [DOI] [PMC free article] [PubMed] [Google Scholar]
- 18.Horan L.H., Noller H.F. Intersubunit movement is required for ribosomal translocation. Proc. Natl. Acad. Sci. USA. 2007;104:4881–4885. doi: 10.1073/pnas.0700762104. [DOI] [PMC free article] [PubMed] [Google Scholar]
- 19.Frank J., Gonzalez R.L., Jr. Structure and dynamics of a processive Brownian motor: the translating ribosome. Annu. Rev. Biochem. 2010;79:381–412. doi: 10.1146/annurev-biochem-060408-173330. [DOI] [PMC free article] [PubMed] [Google Scholar]
- 20.Spirin A.S. The ribosome as a conveying thermal ratchet machine. J. Biol. Chem. 2009;284:21103–21119. doi: 10.1074/jbc.X109.001552. [DOI] [PMC free article] [PubMed] [Google Scholar]
- 21.Munro J.B., Sanbonmatsu K.Y., Blanchard S.C. Navigating the ribosome's metastable energy landscape. Trends Biochem. Sci. 2009;34:390–400. doi: 10.1016/j.tibs.2009.04.004. [DOI] [PMC free article] [PubMed] [Google Scholar]
- 22.Voorhees R.M., Weixlbaumer A., Ramakrishnan V. Insights into substrate stabilization from snapshots of the peptidyl transferase center of the intact 70S ribosome. Nat. Struct. Mol. Biol. 2009;16:528–533. doi: 10.1038/nsmb.1577. [DOI] [PMC free article] [PubMed] [Google Scholar]
- 23.Selmer M., Dunham C.M., Ramakrishnan V. Structure of the 70S ribosome complexed with mRNA and tRNA. Science. 2006;313:1935–1942. doi: 10.1126/science.1131127. [DOI] [PubMed] [Google Scholar]
- 24.Wower J., Wower I.K., Zimmermann R.A. Peptidyl transferase and beyond. Biochem. Cell Biol. 1995;73:1041–1047. doi: 10.1139/o95-111. [DOI] [PubMed] [Google Scholar]
- 25.Wower J., Hixson S.S., Zimmermann R.A. Labeling the peptidyltransferase center of the Escherichia coli ribosome with photoreactive tRNA(Phe) derivatives containing azidoadenosine at the 3′ end of the acceptor arm: a model of the tRNA-ribosome complex. Proc. Natl. Acad. Sci. USA. 1989;86:5232–5236. doi: 10.1073/pnas.86.14.5232. [DOI] [PMC free article] [PubMed] [Google Scholar]
- 26.Wang Y., Qin H., Goldman Y.E. Single-molecule structural dynamics of EF-G—ribosome interaction during translocation. Biochemistry. 2007;46:10767–10775. doi: 10.1021/bi700657d. [DOI] [PubMed] [Google Scholar]
- 27.Rasnik I., McKinney S.A., Ha T. Nonblinking and long-lasting single-molecule fluorescence imaging. Nat. Methods. 2006;3:891–893. doi: 10.1038/nmeth934. [DOI] [PubMed] [Google Scholar]
- 28.Pan D., Qin H., Cooperman B.S. Synthesis and functional activity of tRNAs labeled with fluorescent hydrazides in the D-loop. RNA. 2009;15:346–354. doi: 10.1261/rna.1257509. [DOI] [PMC free article] [PubMed] [Google Scholar]
- 29.Agmon I., Bashan A., Yonath A. Symmetry at the active site of the ribosome: structural and functional implications. Biol. Chem. 2005;386:833–844. doi: 10.1515/BC.2005.098. [DOI] [PubMed] [Google Scholar]
- 30.Semenkov Y.P., Rodnina M.V., Wintermeyer W. Energetic contribution of tRNA hybrid state formation to translocation catalysis on the ribosome. Nat. Struct. Biol. 2000;7:1027–1031. doi: 10.1038/80938. [DOI] [PubMed] [Google Scholar]
- 31.Dorner S., Brunelle J.L., Green R. The hybrid state of tRNA binding is an authentic translation elongation intermediate. Nat. Struct. Mol. Biol. 2006;13:234–241. doi: 10.1038/nsmb1060. [DOI] [PMC free article] [PubMed] [Google Scholar]
- 32.Sharma D., Southworth D.R., Green R. EF-G-independent reactivity of a pre-translocation-state ribosome complex with the aminoacyl tRNA substrate puromycin supports an intermediate (hybrid) state of tRNA binding. RNA. 2004;10:102–113. doi: 10.1261/rna.5148704. [DOI] [PMC free article] [PubMed] [Google Scholar]
- 33.Munro J.B., Altman R.B., Blanchard S.C. A fast dynamic mode of the EF-G-bound ribosome. EMBO J. 2009;29:770–781. doi: 10.1038/emboj.2009.384. [DOI] [PMC free article] [PubMed] [Google Scholar]
- 34.Munro J.B., Altman R.B., Blanchard S.C. Spontaneous formation of the unlocked state of the ribosome is a multistep process. Proc. Natl. Acad. Sci. USA. 2009;107:709–714. doi: 10.1073/pnas.0908597107. [DOI] [PMC free article] [PubMed] [Google Scholar]
- 35.Ly C.T., Altuntop M.E., Wang Y. A single molecule study of Viomycin's inhibition mechanism on ribosome translocation. Biochemistry. 2010 doi: 10.1021/bi101029g. In press. [DOI] [PubMed] [Google Scholar]
- 36.McKinney S.A., Joo C., Ha T. Analysis of single-molecule FRET trajectories using hidden Markov modeling. Biophys. J. 2006;91:1941–1951. doi: 10.1529/biophysj.106.082487. [DOI] [PMC free article] [PubMed] [Google Scholar]
- 37.Zhuravlev P.I., Materese C.K., Papoian G.A. Deconstructing the native state: energy landscapes, function, and dynamics of globular proteins. J. Phys. Chem. B. 2009;113:8800–8812. doi: 10.1021/jp810659u. [DOI] [PubMed] [Google Scholar]
- 38.Wang Y., Baskin J.S., Zewail A.H. Human myoglobin recognition of oxygen: dynamics of the energy landscape. Proc. Natl. Acad. Sci. USA. 2004;101:18000–18005. doi: 10.1073/pnas.0408379102. [DOI] [PMC free article] [PubMed] [Google Scholar]
- 39.Frauenfelder H., Sligar S.G., Wolynes P.G. The energy landscapes and motions of proteins. Science. 1991;254:1598–1603. doi: 10.1126/science.1749933. [DOI] [PubMed] [Google Scholar]
- 40.Vazquez-Laslop N., Thum C., Mankin A.S. Molecular mechanism of drug-dependent ribosome stalling. Mol. Cell. 2008;30:190–202. doi: 10.1016/j.molcel.2008.02.026. [DOI] [PubMed] [Google Scholar]
- 41.Sivan G., Kedersha N., Elroy-Stein O. Ribosomal slowdown mediates translational arrest during cellular division. Mol. Cell. Biol. 2007;27:6639–6646. doi: 10.1128/MCB.00798-07. [DOI] [PMC free article] [PubMed] [Google Scholar]
Associated Data
This section collects any data citations, data availability statements, or supplementary materials included in this article.