

Abstract
The NagC and Mlc proteins are homologous transcriptional regulators that control the expression of several phosphotransferase system (PTS) genes in Escherichia coli. NagC represses nagE, encoding the N-acetylglucosamine-specific transporter, while Mlc represses three PTS operons, ptsG, manXYZ and ptsHIcrr, involved in the uptake of glucose. NagC and Mlc can bind to each others operator, at least in vitro. A binding site selection procedure was used to try to distinguish NagC and Mlc sites. The major difference was that all selected NagC binding sites had a G or a C at positions +11/–11 from the centre of symmetry. This is also the case for most native NagC sites, but not the nagE operator, which thus looks like a potential Mlc target. The nagE operator does exhibit a higher affinity for Mlc than NagC, but no regulation of nagE by physiological concentrations of Mlc was detected in vivo. Regulation of wild-type nagE by NagC is achieved because of the chelation effect due to a second high affinity NagC operator covering the nagB promoter. Replacing the A/T at +11/–11 with C/G allows repression by NagC in the absence of the nagB operator.
INTRODUCTION
NagC is a transcriptional regulator whose function is to co-ordinate the biosynthesis of the amino sugars, glucosamine (GlcN) and N-acetylglucosamine (GlcNAc) with their catabolism. In the absence of an environmental supply of amino sugars, NagC represses the divergent nagE-BACD operons, which are necessary for the utilisation of GlcNAc as a carbon source (1), and activates the expression of one promoter of the glmUS operon that is part of the biosynthetic pathway for the formation of GlcN-6-phosphate (GlcN-6-P) and UDP-GlcNAc (2). The nagE gene encodes the GlcNAc-specific phosphotransferase system (PTS) transporter (EIICBANag) while the nagBA genes encode the two enzymes that degrade GlcNAc-6-P into fructose-6-P (3). NagC is encoded by the third gene of this operon. The inducer for NagC is GlcNAc-6-P, the product of the transport of GlcNAc by the PTS (4).
Mlc is a homologue of NagC (40% identity) (5). It has been shown recently to control the expression of several genes of the PTS in Escherichia coli, namely the two transporters for glucose encoded by ptsG (EIIBCGlc) and manXYZ (EIIABCDMan) and ptsHI, encoding the cytoplasmic components of the PTS, HPr and enzyme I (6–11). Recent results suggest that the signal for Mlc induction is the activation of the PTS by glucose or other PTS sugars rather than glucose per se (8,12), and that induction of Mlc-controlled genes involves sequestration of Mlc to membranes containing dephosphorylated PtsG (13,14).
Both NagC and Mlc are members of the so-called ROK (repressors, ORFs, kinases) family of proteins which contains at least two distinct classes of proteins (15). The first class is the transcriptional regulators, notably the family of various xylose repressors (XylR) in Gram-positive bacteria, and NagC and Mlc in E.coli. The second class is a series of glucose/fructose kinases from a variety of organisms, which are missing the helix–turn–helix (HTH) DNA binding motif present in the N-terminus of the transcription factors. The peculiarity of the NagC and Mlc proteins is that the sequence of the amino acids in their recognition helices is almost identical and much more similar to each other than to the equivalent sequences in the XylR family (Fig. 1A). Similar amino acid sequences in their DNA binding domains implies that NagC and Mlc bind to similar operators and comparison of the identified NagC and Mlc operators shows that this is indeed the case (Fig. 1B). This figure also includes a variant of the nagE operator (nagE s.o.) that has a much higher affinity for NagC than either the wild-type nagE or nagB operators (16). During a systematic mutagenesis study of the nagE operator, we observed that either a G or a C at positions +11 or –11 from the centre of symmetry produced a considerable increase in the affinity of NagC for the operator. We termed this high affinity operator a ‘super-operator’ (nagE s.o.). Normally, DNA loop formation between NagC bound to the nagE and nagB operators is necessary for repression (1) but the nagE s.o. mutation increased the nagE operator affinity so much that repression in the absence of DNA loop formation was detected (16).
Figure 1.

Comparison of NagC and Mlc DNA binding motifs and operators. (A) Alignment of the HTH motifs in the N-terminal regions of NagC and Mlc from E.coli and the XylR repressor from Bacillus subtilis. The locations of the motifs relative to the N-terminal of the proteins are given. Amino acids in the recognition helix (helix 2 shown in yellow) are numbered 1–11. Identical amino acids are indicated by shading and conservative replacements by hatching. (B) Alignment of native NagC and Mlc operator sites. The conserved TT/AA bases at positions –5,6/+5,6 are shown in yellow. AT bases in positions 7–10 (NagC) or 7–11 (Mlc) are shown in green, while C or G at positions +11/–11 of NagC are in blue. C or G residues in pink are in positions –4 to +4, which conforms to the CGCGNCGCG pattern, while those in mauve are in the GCGCNGCGC order.
Recent experiments on the mlc-regulated genes showed that although NagC binding to Mlc operators could be detected in vitro, there was no or little regulation in vivo (6,17, unpublished results). The work described in this paper was undertaken to investigate what distinguishes a Mlc binding site from a NagC site. Initially, in an attempt to determine the essential differences between the operators for the two proteins, a binding site selection/amplification (selex) procedure was performed. The implications of this experiment were that the nagE operator, the part of the divergent nagE-B operon system that is known to be controlled by NagC, appeared to have the characteristics of a Mlc operator. Thus, an examination of Mlc binding to the nagE-B promoter region was undertaken both in vitro and in vivo.
MATERIALS AND METHODS
DNA binding site selection and amplification
Oligonucleotides Nag14E and Nag15B are derived from DNA sequence downstream of the nagE and nagB promoters (with a convenient restriction site introduced in the centre of each oligo, underlined). Nag14E (5′-GCAAATTGTACTGCCGAATTCTGTAATCAGATTGTTAG-3′) and Nag15B (5′-GGCATCTTTAAGCGGATCCTGGATTTGCGCAGAC-3′).
A 69 base long oligonucleotide with 25 random positions in the centre (NagN25) was made between the EcoRI and BamHI sites of Nag14E and Nag15B [GAATTCTGTAATCAGAATGTTAG-(N)25-GTCTGCGCAAATCCAGGATCC]. A double-stranded template with the 25 random positions in the centre was initially made. Forty-six picomoles of NagN25 were amplified with 500 pmol of Nag14E and Nag15B for 12 cycles (1 min at 95°C, 1 min at 50°C, 2 min at 72°C). The Nag14E to Nag15B fragment including the N25 sequence (97 bp) was eluted from a native 8% acrylamide gel and 5′ end-labelled with [γ-32P]ATP and polynucleotide kinase. The labelled DNA was divided into three pools (15 pmol) and mixed with extracts from strains carrying a NagC-overproducing plasmid, a Mlc-overproducing plasmid or a control plasmid. The amount of extract necessary to produce a faint retarded DNA band and the position of its migration on a small 8% acrylamide gel (10 × 15 cm) had been determined previously in trial experiments. Assuming an enrichment of NagC or Mlc to ~2.5% of the total protein in the extracts, the amount of NagC or Mlc mixed with the 15 pmol of labelled template was ~250 ng. DNA from the retarded region was extracted and amplified with the Nag14E and Nag15B oligos (250 pmol, 12 cycles as described above). The 97 bp fragment was purified and half of it relabelled with [γ-32P]ATP and the selection procedure repeated. For later rounds of selection the DNA was mixed with decreasing amounts of the extracts. After nine cycles half the eluted DNA was digested with EcoRI and BamHI and cloned into pTZ19R digested with the same enzymes. The inserts were sequenced with T7 DNA polymerase (Pharmacia). The NagC sequences were all unique after nine cycles (total 41) but a large number of the Mlc sequences selected were identical. The procedure was repeated starting from NagN25. This second set of Mlc sequences (which are numbered from 100 in Fig. 2B) also contained a large number of repetitions. In the two experiments there was a total of 19 unique sequences out of the 59 sequenced. The total number of times the same sequence was isolated is given in brackets after the aligned sequence. The sequences were aligned about the conserved TT 9 bp AA motif. In many cases the –11 to +11 region included DNA derived from the fixed part of the Nag14E or Nag15B oligonucleotides (indicated by lower case letters in Fig. 2). These experiments were performed using extracts of bacteria with Mlc or NagC overproduced from a multicopy plasmid. One criticism is that other proteins in the extracts can influence NagC or Mlc binding. This cannot be excluded but these same proteins will also be present during bacterial cell growth. At the time these experiments were performed purified NagC and Mlc were not available. Subsequent experiments with purified NagC and Mlc (kind gifts from Mitchel Lewis and Winfried Boos) show that they produce complexes of the same mobility as those formed with the extracts. However, at least one of the Mlc selected DNA binding sites, M120, with limited homology to the NagC/Mlc consensus, did not bind to purified Mlc or NagC when tested in vitro. It did produce a band with the crude extracts suggesting that the band shift observed was an artefact due to binding another protein in the extracts. M15 might also be an artefact.
Figure 2.

Alignment of NagC (A) and Mlc (B) DNA binding sites selected in this study after nine cycles of selection and amplification. The Mlc binding sequences are derived from two independent selections, new sequences found in the second experiment are indicated by a number greater than 100. Some sequences were selected many times; the total number of times each sequence was found is shown in brackets after the sequence. Bases derived from the N25 randomised starting sequence are shown in upper-case letters while those derived from the flanking oligonucleotide sequences are shown in lower-case. The colour coding of the homologous sequences is as described in Figure 1B. Sequences tested for NagC or Mlc binding in vivo by operator titration (Table 3) are indicated by a cross.
DNaseI footprinting
The DNA fragments were made by PCR with one oligonucleotide 5′ end-labelled with [γ-32P]ATP and polynucleotide kinase (indicated by *). The wild-type intergenic fragment with two operators was made with Nag14E and Nag15B oligonucleotides (Fig. 3C). The single nagB operator fragment was made by cutting the Nag14E–Nag15B*-labelled fragment with HphI (at –56, Fig. 3C). The single nagE operator fragment was made by cutting the Nag14E*–Nag15B fragment made on a template with a XbaI site at position –93 [called mutation +6 in (1)]. The nagE s.o. fragment was made using Nag14E* and Nag42B on a template carrying the –11G,+11C mutations. Extracts containing overproduced Mlc or NagC from a plasmid were made in a mlc nagC host (e.g. IBPC529C) and DNaseI footprinting was carried out as described previously (1,6). Products were separated on an 8% denaturing polyacrylamide gel and the gel analysed with a PhosphoImager (Molecular Dynamics). The relative occupancy of each operator by Mlc or NagC was calculated by comparing the intensity of three bands within each operator in the presence of NagC or Mlc with that in their absence (Fig. 4). The intensities of the three bands within the operator were normalised by comparing each with three bands outside the NagC/Mlc protected region. This generated nine values for percent occupancy of each site from which the mean value of percent protection was calculated (Fig. 4).
Figure 3.
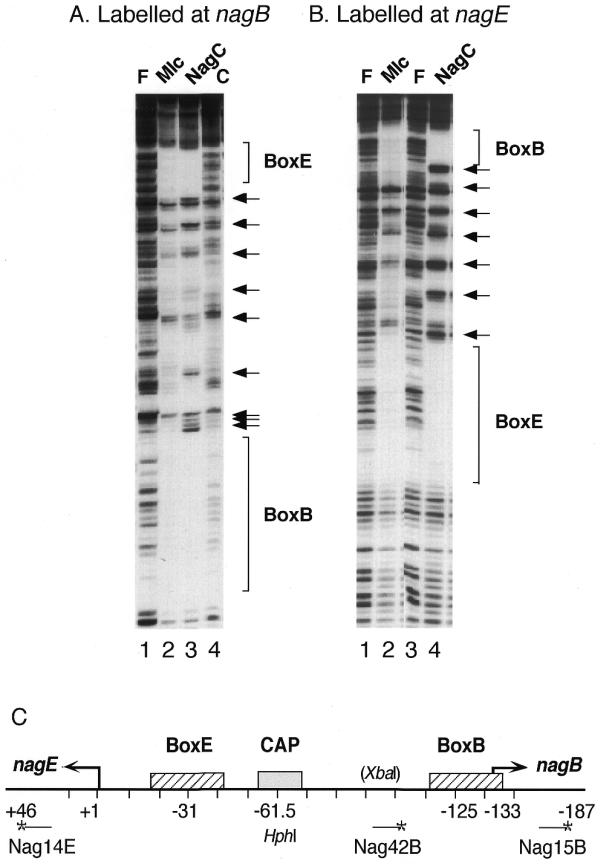
Footprint of NagC and Mlc binding to the Nag14E–Nag15B fragment labelled at Nag15B (A) or Nag14E (B). The DNA was incubated with extracts containing overproduced NagC (lanes A3 and B4), Mlc (lanes A2 and B2) or an empty plasmid vector control (lane A4) (~100 µg/ml) in binding buffer, 50 mM HEPES, 100 mM Na glutamate, pH 8.0, 0.5 mg/ml BSA. Lanes labelled with an F show DNA in the absence of protein extracts. After DNaseI digestion, the reactions were extracted with phenol and analysed on an 8% denaturing polyacylamide gel as described previously (22). The nagE and nagB operators (BoxE and BoxB) are indicated as are the seven hypersensitive cleavages produced by NagC binding. (C) The organisation of the nagE-B promoter region with the location of the NagC operators (BoxE and BoxB) and the CAP site. The sequence is numbered from the nagE transcription site (+1) so that the nagB transcription start is at –133. The 5′ ends of the oligonucleotides are indicated by an asterisk and are at +46 for Nag14E, –118 for Nag42B and –187 for Nag15B. HphI cuts at –56/57 and the XbaI site was created by insertion of 6 bp at –91.
Figure 4.
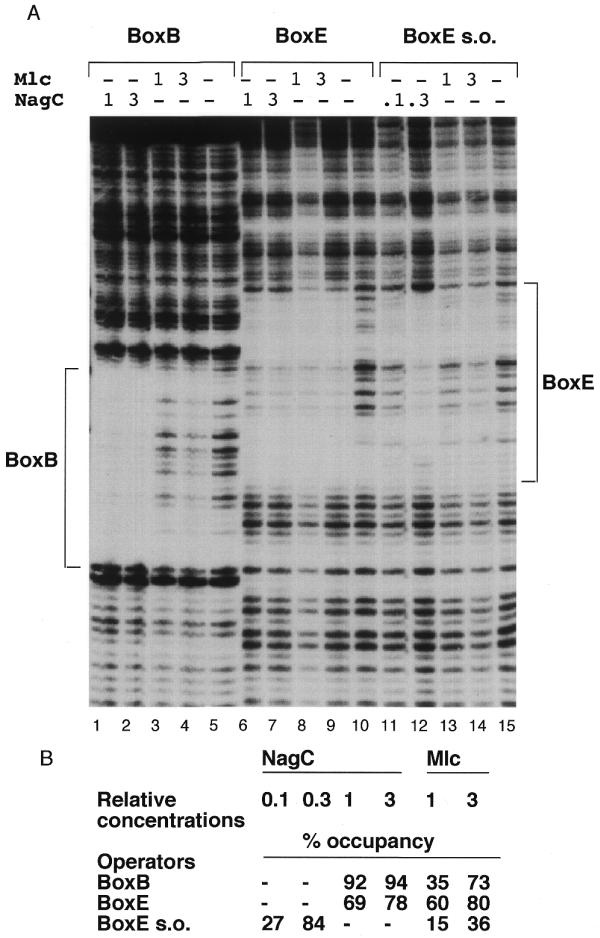
Footprint of NagC and Mlc binding to the single nagB and nagE operators. (A) Labelled DNA fragments (~6 nM) with BoxB, Nag15B*–HphI (lanes 1–5), BoxE, Nag14E*–XbaI (lanes 6–10) and BoxE s.o. Nag14E*–Nag42B with the –11C,+11G mutation (lanes 11–15) were mixed with different amounts of NagC or Mlc extracts. The locations of the protected nagE and nagB operators (BoxE and BoxB) are indicated. The relative concentrations of Mlc and NagC are shown at the top of each lane. ‘1’ corresponds to ~33 µg/ml total extract protein of which Mlc or NagC represents a few percent. (B) The relative protection of each operator by Mlc or NagC was calculated as described in Materials and Methods and is reported as percentage occupancy data for each site by the different amounts of the proteins tested. A dash indicates that that concentration was not tested on the operator indicated. (Note, since the absolute amounts of NagC or Mlc in the extracts are unknown it is only possible to compare the relative binding of the same extract with the different operators and not the binding of NagC and Mlc with the same operator.)
Bacteriological methods
The bacterial strains used were JM101, F’traD36 lacIq Δ(lacZ)M15 proA+B+/ supE Δ(lac-proAB) and IBPC529C, nagC::Cm thi-1 argG6 argE3 his-4 mtl-1 xyl-5 rpsL ΔlacX74 mlc-1 (4). The mlc::Tc, nagC::Cm mutations were introduced by P1 transduction. The nagBE–lacZ fusion carries both nagE and nagB operators (16). It was made from the Nag15B–Nag14E fragment (Fig. 3C) cut with BamHI and EcoRI, cloned into pRS1274 and transferred to bacteriophage λRS45 (18). The nagE–lacZ single-site fusions were made in an analogous way by using the Nag42B to Nag14E fragment (Fig. 3C) (19). β-galactosidase activities were measured on lysogenised bacteria as described previously (16,20). pTZ(Mlc) expresses Mlc from the lac promoter (6). An equivalent plasmid, pTZ(NagC), expressing NagC was made from pUC(NagC) (4).
RESULTS
Selection of random Mlc and NagC binding sites
DNA fragments with affinity for NagC or Mlc were selected. The DNA fragments were passed through nine cycles of amplification and selection before cloning into a vector and sequencing. The results are shown in Figure 2A and B. The sequences were aligned by searching for the ‘TT 9 bp AA’ motif shown to be essential for NagC binding (16) and apparently conserved in the Mlc sites (Fig. 1B). In addition, the adjacent DNA sequences, position +7/–7 to +10/–10, were predominately AT-rich as found for the native NagC and Mlc sites. The major difference between the selected Mlc and NagC sites is the frequency with which a G or C is found in positions +11/–11. For NagC every selected fragment has a G or C at this position while for Mlc it is only about a third (15/38), of which 9/38 are due to Gs supplied by the fixed region of the oligonucleotides. The starting oligonucleotide contained 25 random nucleotides and was flanked with DNA from the nagE-B region (the oligonucleotides used to amplify the fragment were Nag14E and Nag15B, Fig. 3C). Aligning the sequences showed that in some cases part of the fixed sequence of the oligos (indicated by lower case letters) was included in the –11 to +11 region. This was particularly true for the NagC sites where ‘gttag’ from the 3′ end of the Nag14E oligo was frequently found aligned in positions –11 to +7 (21/40). This forced a G at position –7 that otherwise would have been expected to be unfavourable. In the systematic mutagenesis study a G or C at position –7 decreased NagC binding 4–5-fold (16). This disadvantage must be compensated by the presence of GTTA at positions –11 to –8.
Except for the preference for G/C at positions +11/–11 the consensus deduced for Mlc and NagC is remarkably similar. A characteristic of both sets of ‘selected’ sequences is that the central positions, –4 to +4, are GC-rich, ~76 and 69% for NagC and Mlc sites, respectively. In both the ‘selected’ NagC and Mlc sites there is a very strong preference for the CGCGNCGCG motif (shown in pink). This tendency was also reflected in the results of the systematic mutagenesis study. At position –4, C gave the best repression and G was the worst, while in position –3, a G gave the best repression and C was the worst. At positions –2,–1, CG also produced a slight improvement in repression (16). The native NagC sites are much less GC-rich in the –4 to +4 region (42%) but still show a tendency to the CGCG motif (Fig. 1B). On the other hand the native Mlc sites are more GC-rich (61%) but the CGCG repeat is not conserved and more than half of the GC bases are found in the alternative motif GCGCNGCGC (shown in mauve).
To verify the protein-binding specificity of the selected sites, some were tested in vitro for binding to Mlc and NagC. NagC bound to the NagC selected sites (C5, C9 and C42) at least 100-fold better than to the Mlc sites (M1, M26) and at least 10 times better than to M3. The reverse was true for the binding of Mlc. Mlc bound at least 10-fold better to its sites than to C sites. Binding was tested using both the crude extracts of the overproduced native proteins and proteins purified with a His-tag. It is interesting that there appeared to be less discrimination against binding to non-cognate sites when the purified His-tagged proteins were used. This could either be because there is something in the extracts which increases specificity or because the basic His-tag modifies the binding to DNA. The inherent binding of NagC to its specific sites was ~10-fold stronger than Mlc to its specific sites. The Kd for NagC was found to be 2–5 nM. The stronger binding of NagC to its sites, compared with Mlc binding to its sites, presumably reflects the importance of the C/G at +11/–11. The C/G base pair provides an additional recognition point and binding interaction for NagC. The M134 sequence appears to be particularly interesting. It was selected for binding to Mlc and binds Mlc as well as M1, M3 and M26. In addition it was found to bind NagC as well as the NagC sites tested (C5, C9 and C42). The presence of –11C/+11G can explain the good NagC binding but the strong binding to Mlc, despite there being a C/G at +11/–11, must reflect another affinity factor.
Comparison of Mlc and NagC binding to nagE and nagB operators in vitro
The binding site selection results confirmed that C/G at +11/–11 is a major factor in NagC recognition and raised the question of whether the nagE operator, which has T/A at +11/–11, could function as a Mlc site. NagC regulates expression of the divergent nagE-BACD operons by binding to two operators (called BoxE and BoxB) overlapping the nagE-B promoters. Repression is dependent upon the co-operative binding of NagC to these two sites resulting in DNA loop formation (1), which can be detected in vitro by DNaseI footprinting. NagC binding produces a regular pattern of seven hypersensitive DNaseI cleavages and protected regions between the two operators, which is characteristic of DNA loop formation (Fig. 3A and B, lanes 3 and 4, respectively) (21,22). When Mlc binds to the two operators, it also alters the cleavage pattern of the intervening DNA but not to the same extent as NagC (Fig. 3A and B, lanes 2). In particular, Mlc does not generate the first and seventh hypersensitive bands immediately adjacent to the two operators that NagC generates (Fig. 3B). With Mlc, certain cleavages are repressed in the inter-operator region and the pattern of hypersensitive bands is less pronounced. The fact that there is a change in the inter-operator cleavage pattern demonstrates that there is some interaction between Mlc molecules bound at the nagE and nagB operators. A modified template with 6 bp inserted between the two operators prevents DNA loop formation by NagC (1) and eliminates the distortion to the inter-operator cleavage pattern by Mlc as well as NagC (data not shown).
To eliminate complications due to co-operative binding at the two sites and DNA loop formation, the two nag operators were studied individually and, in addition, the super-operator form of nagE operator was tested (Fig. 4A). On all three templates the DNaseI footprint produced by Mlc binding is qualitatively the same as that of NagC. Thus, in the absence of any interaction between the repressor proteins bound to two sites on the same template, the binding of NagC and Mlc to DNA is essentially identical, showing it is really the co-operative interaction that produces the distorted inter-operator footprints shown in Figure 3. An attempt to quantitate the degree of protection was made by calculating the percentage occupancy of each operator by a fixed amount of NagC or Mlc (Fig. 4B). NagC binds best to the nagE s.o., then to the nagB operator and has lowest affinity for the nagE w.t. (wild-type) operator. For Mlc the order is reversed; Mlc shows highest affinity for the nagE w.t. operator and lowest for the nagE s.o. The –11C,+11G nagE s.o. mutation has the effect of enhancing NagC binding nearly 10-fold and reducing Mlc binding about three times.
Binding of NagC and Mlc to nagE operators in vivo
As Mlc showed a stronger affinity for the nagE operator than NagC, it seemed possible that Mlc might be able to regulate the nagE promoter in the absence of NagC in vivo. Three nagE–lacZ fusions were tested: the standard ‘loop-forming’ nagBE–lacZ fusion, whose expression is repressed by NagC binding co-operatively to the nagE and nagB operators; and two single operator nagE–lacZ fusions, missing the nagB promoter/operator, but carrying the same nagE–lacZ junction. One single operator fusion was wild-type and the other carried the –11C,+11G super-operator mutation.
Expression from these three fusions was measured in strains carrying either the mlc or nagC or double mlc, nagC mutations (Table 1). The nagC mutation causes a large derepression (34-fold) of the loop-forming nagBE–lacZ fusion while the mlc mutation has no effect. The nagE–lacZ single operator fusion is highly expressed in the wild-type strain, since NagC cannot bind to the wild-type nagE operator in the absence of loop formation. The introduction of the mlc mutation does seem to provoke a small increase (1.3-fold), which could be explained by some weak Mlc binding in the absence of NagC. For all three fusions, expression in the double nagC mlc strain is unexpectedly lower than in the single nagC mutation. Possibly the unregulated expression of both sets of genes controlled by NagC and Mlc has a detrimental effect on cell physiology. The –11C,+11G mutation overlaps the nagE promoter and reduces nagE promoter activity so that expression in the fusion carrying the nagE s.o. mutation is lower than in the wild-type single operator. This single operator site is very strongly bound by NagC such that the nagC mutation produces a 77-fold derepression (as compared with 34-fold for the nagBE looping construct) demonstrating its high affinity for NagC. There is no effect of the mlc mutation on the nagE s.o. expression.
Table 1. Effect of mlc and nagC mutations on expression of nagE–lacZ fusions.
| |
|
w.t. |
mlc |
|
nagC |
|
nagC mlc |
|
| |
|
Units |
Units |
Ind |
Units |
Ind |
Units |
Ind |
|
nagBE–lacZ |
looped |
47 |
45 |
1.0 |
1590 |
34 |
1200 |
25 |
|
nagE–lacZ |
single site |
1620 |
2040 |
1.3 |
1650 |
1.0 |
1430 |
0.9 |
| nagE–lacZ s.o. | single site with super-operator | 7.5 | 6.5 | 0.9 | 580 | 77 | 550 | 73 |
JM101 was lysogenised with bacteriophage λ carrying the three nagE–lacZ fusions and the nagC and mlc mutations introduced by P1 transduction. Bacteria were grown in MOPS medium containing 0.4% glycerol and 0.5% cas amino acids at 30°C. β-galactosidase activities were measured at several points throughout the exponential growth phase. Ind (induction) gives the fold increase in expression caused by the mutations compared to the expression of the same fusion in the wild-type strain.
These experiments show that with the physiological concentrations of Mlc present in the cell, there is little binding of Mlc to the nagE operator, even in the absence of NagC binding. To verify that Mlc does bind preferentially to the nagE operator in vivo, the effect of plasmids overproducing either Mlc or NagC was tested in a strain mutated for both mlc and nagC. Plasmids expressing either NagC or Mlc produce considerable repression of the nagBE–lacZ looped fusion, reducing expression 88- and 56-fold (Table 2). For the single-site nagE–lacZ fusion the NagC plasmid is surprisingly inefficient at repressing (<3-fold repression) while the Mlc plasmid is 10 times better (28-fold repression). The preferential repression by NagC at the looped nagBE–lacZ fusion, compared with the nagE–lacZ fusion with a single operator site, emphasises that regulation by NagC is normally dependent upon DNA loop formation involving the higher-affinity nagB operator. On the other hand, Mlc can bind quite efficiently to the nagE single-site fusion producing a level of repression only 2-fold lower than for the nagBE–lacZ fusion (28- and 56-fold, respectively). As expected, the NagC plasmid is more efficient than the Mlc plasmid for the nagE–lacZ s.o. fusion (nearly 100-fold for NagC compared with just 8-fold repression by Mlc), which is consistent with the –11G,+11C s.o. mutation creating a better NagC site and a worse Mlc site.
Table 2. Effect of excess Mlc or NagC on expression of nagE–lacZ fusions.
| |
|
Control (pTZ19) |
PTZ(Mlc) |
|
pTZ(NagC) |
|
| |
|
Units |
Units |
Rep |
Units |
Rep |
|
nagBE–lacZ |
looped |
1410 |
25 |
56 |
16 |
88 |
|
nagE–lacZ |
single site |
1120 |
40 |
28 |
420 |
2.7 |
| nagE–lacZ s.o. | single site with super-operator | 325 | 42 | 8 | 3.3 | 98 |
IBPC529C (nagC, mlc-1) was lysogenised with the three nagE–lacZ fusions and then transformed with plasmids overexpressing Mlc or NagC from the lac promoter in a pTZ vector or the empty vector plasmid (pTZ19, control) as indicated. IBPC529C is Δlac so that expression from the lac promoter of the pTZ plasmids expressing Mlc and NagC is constitutive. Bacteria were grown in MOPS medium with 0.4% glycerol, 0.5% cas amino acids and 0.5 mg/ml ampicillin. β-galactosidase activities were measured throughout the exponential growth phase and the values are the mean of two independent cultures. Rep (repression) is the relative decrease in expression of the fusion caused by the presence of the NagC or Mlc plasmid compared with the empty vector plasmid.
Binding of NagC and Mlc to some ‘selected’ operators in vivo
To examine the relative binding affinities of some of the selected Mlc and NagC binding sites in vivo, an ‘operator titration’ technique was used. A multi-copy plasmid carrying a binding site for a repressor will cause derepression of a chromosomally encoded single copy gene controlled by that repressor. A subset of the Mlc and NagC selected binding sites, on pTZ plasmids, were introduced into strains carrying lysogenic ptsG–lacZ or nagBE–lacZ fusions. The expression of ptsG is controlled by Mlc binding to two operators upstream of two promoters, both of which are subject to Mlc repression. The relative derepression caused by each sequence is a measure of its binding affinity for Mlc or NagC (Table 3). The Mlc and NagC sites chosen show a range of binding affinities. None of the NagC selected sites shows any derepression of ptsG–lacZ. This is not just due to the presence of G/C at positions +11/–11 in all the NagC selected sequences, since the Mlc selected sequence M134, which has –11C,+11G, produces a 2-fold derepression of ptsG–lacZ and M11, with +11G, produces a 6-fold derepression. As described above, NagC and Mlc both bind very well to M134 in vitro. In fact all the Mlc selected binding sites produce some level of derepression of nagBE–lacZ.
Table 3. Effect of Mlc and NagC operator sequences on expression of ptsG–lacZ and nagBE–lacZ fusions.
| Plasmid |
Strain |
Derepression |
|
| |
|
ptsG–lacZ |
nagBE–lacZ |
| M26 |
w.t |
13.1 |
1.3 |
| M1 |
w.t. |
11.5 |
1.8 |
| M11 |
w.t. |
6.5 |
2.6 |
| M3 |
w.t. |
5.8 |
1.8 |
| M134 |
w.t. |
2.2 |
5.4 |
| C24 |
w.t. |
1 |
4.7 |
| C17 |
w.t. |
1 |
5.3 |
| C5 |
w.t. |
1 |
5.5 |
| C43 |
w.t. |
1 |
7.5 |
| C42 |
w.t. |
1 |
8.1 |
| C9 |
w.t. |
1 |
8.2 |
| pTZ(Nag14E-15B) |
w.t. |
1.1 |
15 |
| pTZ19 |
w.t. |
1 |
1 |
| pTZ19 | mlc nagC | 13 | 35 |
JM101(mlc+, nagC+), lysogenised with either λRS/nagBE–lacZ or λRS/ptsG–lacZ, was transformed with pTZ19R carrying the NagC and Mlc selected binding sites indicated. Bacteria were grown in MOPS medium containing 0.4% glycerol, 0.5% cas amino acids 0.5 mg ampicillin/ml at 30°C and β-galactosidase activities were measured at the end of the exponential phase (A650 = 0.6–0.8). Derepression caused by the operators in trans was calculated by comparison with the presence of pTZ19R. Maximum derepression of the fusions was measured in JM101 carrying nagC::Cm and mlc::Tc mutations. The basal levels of expression are 6 and 60 U for ptsG–lacZ and nagBE–lacZ, respectively. Results are the mean of two independent cultures.
Mlc selected sequences, M26 and M1, produce nearly complete derepression of ptsG–lacZ (similar to the mlc, nagC strain, last line of Table 3). The maximum induction for ptsG–lacZ (13-fold) is much less than that of nagBE–lacZ (35-fold). Rather surprisingly, none of the selected NagC binding sites produced >8-fold induction. This could be because the nagBE–lacZ fusion is controlled by NagC binding co-operatively to the two operators covering the nagE and nagB promoters. However even the DNA fragment carrying the two wild-type nagE and nagB operators, Nag14E–Nag15B, produces only 15-fold induction. This lack of derepression by the wild-type nag operators in trans is not understood. [Note that the DNA cloned in the nagBE–lacZ fusion is exactly the same as that carried by pTZ(Nag14E-15B) used in the titration experiments. This excludes the presence of a third NagC operator controlling nagBE–lacZ expression (compare with 23,24).]
DISCUSSION
Consensus sequences for NagC and Mlc binding sites
The consensus sequence for a NagC binding site has been deduced by three methods: (i) from the comparison of the native sites; (ii) by mutagenesis of one operator to determine which bases alter regulation (i.e. on the criteria of NagC binding in vivo); and (iii) by the selection of DNA fragments binding NagC in vitro. The three methods agree and the operator half site, between positions –11 to –5, is G/CTTATTT, with the underlined TT at positions –5,6 the most important. Note also that a central ‘0’ position in the palindrome is essential, showing that the spacing between the TT and AA at positions –5,6 and +5,6 is critical. The majority of the known, natural NagC operators have G/C at positions +11/–11 while none of the identified native Mlc operators has. The deduced consensus for Mlc is the same as for NagC except for the frequency of G/C at positions +11/–11.
Some C and M sites were compared for their binding properties with NagC and Mlc by band shift assay in vitro and operator titration in vivo. The results confirm the specificity of the selected binding sites for one or other of the repressors. The M134 sequence seems to be an interesting exception. Despite the presence of –11C,+11G, it was selected as an Mlc site and binds Mlc almost as well as the other M sites. Moreover it binds NagC as well as the other C sites tested.
For both Mlc and NagC sites the affinities in vivo seem to increase with the presence of more bases in the CGCG configuration in positions –4 to +4 (shown in pink in Fig. 2). M26 and M1, both of which conform to the deduced consensus in positions 11–5 and have 7 and 5 bp, respectively, in the CGCG configuration in positions –4 to +4, produce more derepression than M3, which has only 2 bp in the CGCG configuration. Similarly, the three sequences that derepress nagBE–lacZ the most, C9, C42 and C43, have 7, 6 and 8 bp, respectively, in this pattern. So for both Mlc and NagC sites there is some indication that the CGCG pattern in the centre of the palindromic recognition site does indeed enhance binding. However, as the rest of the selected sequences are not identical, these conclusions are only tentative and will need to be confirmed by systematic replacement of nucleotides.
Mlc and NagC are not the only examples of proteins with overlapping specificity in E.coli. The Gal repressor, GalR, and the Gal isorepressor or Mgl repressor, GalS, are good examples. In this case the operons controlled belong to the same regulon so that cross-regulation is not unexpected. Differential regulation of the gal and mgl genes is partly achieved because the repressor and isorepressor are sensitive to different concentrations of the inducer galactose (25,26). In the case of Mlc and NagC the inducing signals are apparently very different (13,14).
The NagC and Mlc protein–DNA interaction
The strictly conserved TT/AA at positions –6, –5/+5, +6 bp from the centre of symmetry, is probably the major recognition point for both NagC and Mlc. This presumably reflects the fact that the amino acids in positions 1, 2 and 6 in the recognition helix of the HTH, known to be important for DNA binding in other HTH proteins (27–29), are identical in NagC and Mlc. The crystallographic structures of other HTH protein–DNA complexes predict that these amino acids are likely to contact the DNA in the major groove (28–30). This implies that the major groove of the DNA near positions –6, –5/+5, +6 of the palindrome, is adjacent to the protein and thus that the minor groove of the DNA at positions +11/–11 should be facing the protein.
Proteins binding to DNA frequently distort the path of the DNA helix. For the Lac and Pur repressors, leucine residues from the hinge helix, outside the HTH motif, contact the DNA near the centre of the palindrome and pry open the minor groove of the DNA. This produces a kink and bends the DNA away from the protein (29,30). This should reduce any chance of an interaction at positions +11/–11. On the other hand, DNA bound to the cAMP receptor protein (CAP) is strongly bent, by nearly 90° (28,31) and AT-rich sequences in positions 9–11 of the CAP operator favour CAP binding (32). As a G or C at positions +11/–11 is equally beneficial to NagC binding, it is likely that NagC recognises the conformation produced by a GC base pair (e.g. a wider minor groove) and/or makes a contact with the phosphate backbone rather than making a specific contact with the nucleotide base at positions +11/–11. However, unlike the CAP case, where AT sequences in positions 9–11 are favourable to the bending (32), the G/C base pair must be at positions +11/–11 to enhance NagC binding. The only candidate amino acids in the HTH of NagC and Mlc that could potentially make a differential interaction with the G/C at positions +11/–11 are at position 10, at the far end of the recognition helix. This amino acid is Gln in NagC and Glu in Mlc (Fig. 1A). As this replacement involves a charge change, it could conceivably alter an interaction with a phosphate in the minor groove. However mutagenesis experiments exchanging the Gln to Glu in NagC, and vice versa in Mlc, gave no indication of a specificity change (data not shown). It is also possible that amino acid residues outside the HTH contact the DNA as has been shown for the Trp repressor (33,34) and PurR and LacI (29,30).
Positive interaction between NagC and the C/G base pair at +11/–11 presumably accounts for the higher affinity of NagC for its sites in vitro compared with Mlc for its sites. It is worth emphasising that NagC prefers G/C at +11/–11 even when binding to a single site. The ‘selected’ NagC binding sites had exclusively G or C at position +11/–11 showing that this recognition by NagC is an intrinsic property of NagC and the G/C preference is not imposed by co-operativity between NagC molecules or DNA loop formation. It should also be noted that G/C at this position does not exclude Mlc binding (e.g. M134) but, at least in the nagE s.o. case, it does considerably reduce the affinity. The results reported here have confirmed that the major difference between NagC and Mlc binding sites is the presence of a G or C at positions +11/–11. However, it remains to be determined how the proteins discriminate between bases at these positions. A crystallographic study of the two proteins complexed with their respective operators should be very informative.
Potential regulation of nagE by Mlc: effect of DNA loop formation
The lack of G/C nucleotides at positions +11/–11 makes the nagE operator (BoxE) look like a potential Mlc site. It should be remembered that nagE encodes the GlcNAc-specific PTS transporter and the genes for two other PTS transporters (ptsG and manXYZ) plus the genes for the central components of the PTS (ptsHIcrr) have been shown to be regulated by Mlc (6–11). Thus, it was interesting to find out if regulation by Mlc was a general characteristic of PTS genes. Although Mlc does bind specifically to both the nagE and nagB operators in vitro, no regulation of nagBE expression in vivo by the natural chromosomal copy of mlc was detected, even in the absence of NagC binding. However the much stronger repression of this fusion by overproduced Mlc, compared with overproduced NagC, shows that the isolated nagE operator site has a higher affinity for Mlc than NagC. One reason for the apparent lack of regulation of nagE by Mlc could be the lower affinity of Mlc for the nagE operator for Mlc than for the other identified Mlc operators. In addition, regulation in vivo is very dependent upon the location of the regulatory site (35). The nagE operator covers the –35 region of the nagE promoter while most Mlc binding sites cover the +1 or –10 region of the target promoters (6–9,11,17).
The inter-operator nagE–nagB region possesses an intrinsic DNA bend based upon the CAP binding site. This bend makes an essential contribution to DNA loop formation and hence is necessary for repression by the NagC protein (19). The glmUS operon, which is regulated positively by NagC, also relies upon co-operative binding of NagC to two sites (2). Co-operative binding produces a wider range of regulation than a single site and allows the use of lower affinity sites (24). In the case of nagE-B operons, loop formation has the role of allowing simultaneous induction of the divergent promoters and increases the sensitivity to smaller changes in inducer concentration. There are two Mlc operators in the ptsG regulatory region but it is not known if binding is co-operative. In the other operons controlled by Mlc, regulation involves just a single Mlc site and the induction factors are lower.
Another reason why Mlc does not repress the native, divergent nagB-E promoters could be that Mlc is not capable of forming a stable DNA loop. The Mlc footprint on the looping nagBE template does show some of the pattern of hypersensitive DNaseI cleavages (Fig. 3) indicative of co-operative binding of Mlc to the two sites. However, two of the cleavages, the first and seventh, are absent, implying that Mlc is producing greater steric incumberance than NagC in the loop. Changing the interoperator distance could perhaps increase binding by Mlc. The lack of regulation of nagE by Mlc can be seen as a consequence of two effects: a non-optimal position and a reduced capacity to form a DNA loop. The nagE operator is inherently a better Mlc site than the NagC site but is not located at the best position for repression from a single site. Its weak NagC binding ability is considerably enhanced by the chelation effect due to the high-affinity nagB operator. The net result is that there is no cross-regulation of nagE expression by physiological concentrations of Mlc.
Acknowledgments
ACKNOWLEDGEMENTS
I thank Annie Kolb for many helpful discussions and critical reading of the manuscript and Mitchel Lewis and Winfried Boos for the gifts of purified NagC and Mlc, respectively.
References
- 1.Plumbridge J. and Kolb,A. (1993) DNA loop formation between Nag repressor molecules bound to its two operator sites is necessary for repression of the nag regulon of Escherichia coli in vivo. Mol. Microbiol., 10, 973–981. [DOI] [PubMed] [Google Scholar]
- 2.Plumbridge J. (1995) Co-ordinated regulation of aminosugar biosynthesis and degradation: The NagC repressor acts as an activator for the transcription of the glmUS operon and requires two separated NagC binding sites. EMBO J., 14, 3958–3965. [DOI] [PMC free article] [PubMed] [Google Scholar]
- 3.White R.J. (1968) Control of aminosugar metabolism in Escherichia coli and isolation of mutants unable to degrade amino sugars. Biochem. J., 106, 847–858. [DOI] [PMC free article] [PubMed] [Google Scholar]
- 4.Plumbridge J.A. (1991) Repression and induction of the nag regulon of Escherichia coli K12: the roles of nagC and nagA in maintenance of the uninduced state. Mol. Microbiol., 5, 2053–2062. [DOI] [PubMed] [Google Scholar]
- 5.Hosono K., Kakuda,H. and Ichihara,S. (1995) Decreasing accumulation of acetate in rich medium by Escherichia coli on introduction of genes on a multicopy plasmid. Biosci. Biotechnol. Biochem ., 59, 256–261. [DOI] [PubMed] [Google Scholar]
- 6.Plumbridge J. (1998) Control of the expression of the manXYZ operon in Escherichia coli: Mlc is a negative regulator of the mannose PTS. Mol. Microbiol., 27, 369–381. [DOI] [PubMed] [Google Scholar]
- 7.Plumbridge J. (1998) Expression of ptsG, the gene for the major glucose PTS transporter in Escherichia coli, is repressed by Mlc and induced by growth on glucose. Mol. Microbiol., 29, 1053–1063. [DOI] [PubMed] [Google Scholar]
- 8.Plumbridge J. (1999) Expression of the phosphotransferase system (PTS) both mediates and is mediated by Mlc regulation in Escherichia coli. Mol. Microbiol., 33, 260–273. [DOI] [PubMed] [Google Scholar]
- 9.Kimata K., Inada,T., Tagami,H. and Aiba,H. (1998) A global repressor (Mlc) is involved in glucose induction of the ptsG gene encoding major glucose transporter in Escherichia coli. Mol. Microbiol., 29, 1509–1519. [DOI] [PubMed] [Google Scholar]
- 10.. Tanaka Y., Kimata,K., Inada,T., Tagami,H. and Aiba,H. (1999) Negative regulation of the pts operon by Mlc: mechanism underlying glucose induction in Escherichia coli. Genes Cell., 268, 391–399. [DOI] [PubMed] [Google Scholar]
- 11.. Kim S.-Y., Nam,T.-W., Shin,D., Koo,B.-M., Seok,Y.-J. and Ryu,S. (1999) Purification of Mlc and analysis of its effects on the pts expression in Escherichia coli. J. Biol. Chem., 274, 25398–25402. [DOI] [PubMed] [Google Scholar]
- 12.. Zeppenfeld T., Larisch,C., Lengeler,J.W. and Jahreis,K. (2000) Glucose transporter mutants of Escherichia coli K-12 with changes in substrate recognitiuon of the IICBGlc and induction behavior of the ptsG gene. J. Bacteriol ., 182, 4443–4452. [DOI] [PMC free article] [PubMed] [Google Scholar]
- 13.. Lee S.-J., Boos,W., Bouché,J.-P. and Plumbridge,J. (2000) Signal transduction between a membrane bound transporter and a soluble transcription factor, Mlc, of Escherichia coli. EMBO J., 19, 5353–5361. [DOI] [PMC free article] [PubMed] [Google Scholar]
- 14.. Tanaka Y., Kimata,K. and Aiba,H. (2000) A novel regulatory role of glucose transporter of Escherichia coli: membrane sequestration of a global repressor Mlc. EMBO J., 19, 5344–5352. [DOI] [PMC free article] [PubMed] [Google Scholar]
- 15.. Titgemeyer F., Reizer,J., Reizer,A. and Saier,M.H. (1994) Evolutionary relationships between sugar kinases and transcriptional repressors in bacteria. Microbiology, 140, 2349–2354. [DOI] [PubMed] [Google Scholar]
- 16.. Plumbridge J. and Kolb,A. (1995) Nag repressor-operator interactions: Protein-DNA contacts cover more than two turns of the DNA helix [see also corrigendum in J. Mol. Biol., 253, 219–220]. J. Mol. Biol., 249, 809–902. [DOI] [PubMed] [Google Scholar]
- 17.. Decker K., Plumbridge,J. and Boos,W. (1998) Negative transcriptional regulation of a positive regulator: the expression of malT, encoding the transcriptional activator of the maltose regulon of Escherichia coli, is negatively controlled by Mlc. Mol. Microbiol., 27, 381–390. [DOI] [PubMed] [Google Scholar]
- 18.. Simons R.W., Houman,F. and Kleckner,N. (1987) Improved single and multicopy lac based cloning vectors for protein and operon fusions. Gene, 53, 85–96. [DOI] [PubMed] [Google Scholar]
- 19.. Plumbridge J. and Kolb,A. (1998) DNA bending and expression of the divergent nagE-B operons. Nucleic Acids Res., 26, 1254–1260. [DOI] [PMC free article] [PubMed] [Google Scholar]
- 20.. Miller J.H. (1972) Experiments in Molecular Genetics. Cold Spring Harbor Laboratory Press, Cold Spring Harbor, NY.
- 21.. Hochschild A. and Ptashne,M. (1986) Cooperative binding of lambda repressors to sites separated by integral turns of the DNA helix. Cell, 44, 681–687. [DOI] [PubMed] [Google Scholar]
- 22.. Plumbridge J. and Kolb,A. (1991) CAP and Nag repressor binding to the regulatory regions of the nagE-B and manX genes of E.coli. J. Mol. Biol., 217, 661–679. [DOI] [PubMed] [Google Scholar]
- 23.. Dandanell G., Valentin-Hansen,P., Love Larsen,J.E. and Hammer,K. (1987) Long range cooperativity between regulatory sequences in a prokaryote. Nature, 325, 823–826. [DOI] [PubMed] [Google Scholar]
- 24.. Oehler S., Eismann,E.R., Krämer,H. and Müller-Hill,B. (1990) The three operators of the lac operon cooperate in repression. EMBO J., 9, 973–979. [DOI] [PMC free article] [PubMed] [Google Scholar]
- 25.. Geanacopoulos M. and Adhya,S. (1997) Functional characterisation of roles of GalR and GalS as regulators of the gal regulon. J. Bacteriol ., 179, 228–234. [DOI] [PMC free article] [PubMed] [Google Scholar]
- 26.. Weickert M.J. and Adhya,S. (1992) Isorepressor of the gal regulon in Escherichia coli. J. Mol. Biol., 226, 69–83. [DOI] [PubMed] [Google Scholar]
- 27.. Lehming N., Sartorius,J., Kisters-Woike,B., von Wilken-Bergman,B. and Müller-Hill,B. (1991) Rules for protein DNA recognition for a family of helix-turn-helix proteins. Nucleic Acids Mol. Biol., 5, 114–125. [Google Scholar]
- 28.. Schultz S.C., Shields,G.C. and Steitz,T.A. (1991) Crystal structure of a CAP-DNA complex: The DNA is bent by 90°. Science, 253, 1001–1007. [DOI] [PubMed] [Google Scholar]
- 29.. Schumacher M.A., Choi,K.Y., Zalkin,H. and Brennan,R.G. (1994) Crystal structure of LacI member, PurR, bound to DNA: minor groove binding by α helices. Science, 266, 763–770. [DOI] [PubMed] [Google Scholar]
- 30.. Lewis M., Chang,G., Horton,N.C., Kercher,M.A., Pace,H.C., Schumacher,M.A., Brennan,R.G. and Lu,P. (1996) Crystal structure of the Lactose operon repressor and its complexes with DNA and inducers. Science, 271, 1247–1254. [DOI] [PubMed] [Google Scholar]
- 31.. Parkinson G., Wilson,C., Gunasekera,A., Ebright,Y.W., Ebright,R.E. and Berman,H.M. (1996) Structure of the CAP-DNA complex at 2.5A resolution: A complete picture of the protein-DNA interface. J. Mol. Biol., 260, 395–408. [DOI] [PubMed] [Google Scholar]
- 32.. Gartenberg M.R. and Crothers,D.M. (1988) DNA sequence determinants of CAP-induced bending and protein affinity. Nature, 333, 824–829. [DOI] [PubMed] [Google Scholar]
- 33.. Carey J. (1989) trp repressor arms contribute binding energy without occupying unique locations on DNA. J. Biol. Chem., 264, 1941–1945. [PubMed] [Google Scholar]
- 34.. Mackintosh S., McDermott,P. and Hurlburt,B. (1998) Mutational analysis of the NH2-terminal arms of the Trp repressor indicates a multifunctional domain. Mol. Microbiol., 27, 1119–1127. [DOI] [PubMed] [Google Scholar]
- 35.. Collado Vides J., Magasanik,B. and Gralla,J.D. (1991) Control site location and transcriptional regulation in Escherichia coli. Microbiol. Rev., 55, 371–394. [DOI] [PMC free article] [PubMed] [Google Scholar]