

Abstract
Background
Pasteurella multocida is a gram-negative bacterial pathogen that has a broad host range. One of the diseases it causes is fowl cholera in poultry. The availability of the genome sequence of avian P. multocida isolate Pm70 enables the application of functional genomics for observing global gene expression in response to a given stimulus. We studied the effects of three classes of antibiotics on the P. multocida transcriptome using custom oligonucleotide microarrays from NimbleGen Systems. Hybridizations were conducted with RNA isolated from three independent cultures of Pm70 grown in the presence or absence of sub-minimum inhibitory concentration (sub-MIC) of antibiotics. Differentially expressed (DE) genes were identified by ANOVA and Dunnett's test. Biological modeling of the differentially expressed genes (DE) was conducted based on Clusters of Orthologous (COG) groups and network analysis in Pathway Studio.
Results
The three antibiotics used in this study, amoxicillin, chlortetracycline, and enrofloxacin, collectively influenced transcription of 25% of the P. multocida Pm70 genome. Some DE genes identified were common to more than one antibiotic. The overall transcription signatures of the three antibiotics differed at the COG level of the analysis. Network analysis identified differences in the SOS response of P. multocida in response to the antibiotics.
Conclusion
This is the first report of the transcriptional response of an avian strain of P. multocida to sub-lethal concentrations of three different classes of antibiotics. We identified common adaptive responses of P. multocida to antibiotic stress. The observed changes in gene expression of known and putative P. multocida virulence factors establish the molecular basis for the therapeutic efficacy of sub-MICs. Our network analysis demonstrates the feasibility and limitations of applying systems modeling to high throughput datasets in 'non-model' bacteria.
Background
Pasteurella multocida is a gram–negative bacterial pathogen that has a unique history of serving as a model species for new discoveries. In his seminal experiments in the late eighteenth century, Louis Pasteur demonstrated both attenuation as well as protective immune response utilizing P. multocida in birds [1,2]. P. multocida is also an excellent model species for studying the effects of antibiotics on gram-negative bacteria because its short lipopolysaccharide O side chains make it more permeable, allowing investigations on the effects of antibiotics on bacterial metabolism [3].
Of the different P. multocida subspecies, multocida has a broad host range and causes diseases in poultry, cattle, pigs, and rabbits [4]. Zoonosis with P. multocida is caused by cat and dog bites and scratches and respiratory infection [5]. Fowl cholera (avian pasteurellosis) caused by P. multocida can be either chronic or acute and is a septicemic disease that causes significant economic loss to the poultry industry. Due to the importance of this pathogen to the avian community, the genome of an isolate recovered from chicken fowl cholera (strain Pm70) was sequenced in 2001 [6]. The genome sequence has enabled subsequent functional genomics research with this species [7-9]. It has also enabled investigations on the proteomic and transcriptomic response of P. multocida Pm70 to sub-MICs of antibiotics [10-12].
Much attention has been focused on characterization of specific antibiotic resistance mechanisms; however, recent studies are shedding light on non-target effects of antibiotics. In the current study, we used P. multocida as a model species to investigate the effects of three antibiotics with disparate mechanisms of action (amoxicillin, chlortetracycline, and enrofloxacin) on bacterial metabolism. Because biological systems utilize highly complex, interrelated metabolic and signaling networks, a thorough understanding of bacterial physiology requires studying the global response to a given stimulus in the context of interacting gene networks. Computational systems biology facilitates this level of analysis. Systems level analysis can identify key regulatory elements of a molecular interaction network; dynamic changes in these elements govern a response [13].
Application of systems approaches to P. multocida is still in the initial stages, but we have started using these methods to characterize the P. multocida response to antibiotics at the proteome level [11]. Here we describe the use of systems analysis at the transcriptome level to investigate the P. multocida response to sub-MICs of antibiotics.
Results and discussion
Differentially expressed genes
Statistical analysis of microarray data revealed that 1/4 MIC of AMX, CTC, and ENR resulted in significant changes in expression of approximately 25% of the genome (525 genes, Additional file 1, supplemental table 1). The differences in gene expression that were determined to be statistically significant ranged from as small as a 5% decrease (relative to control) to as high as an 11.5-fold increase in expression (recN, Table 1). Earlier microarray studies with P. multocida arbitrarily chose a 1.5-fold significant change in gene expression as differentially regulated genes. Instead of choosing a pre-determined threshold for determining the biological relevance of changes in gene expression, we considered every significant change in expression to be a valid change based on our rigorous statistical testing. We validated changes as small as a 15% decrease or increase (for example, expression of murA in response to AMX and ENR, respectively) (Additional file 1, supplemental table 1) by qPCR. Figure 1 shows the correlation between the trends observed in microarray and qPCR for the subset of genes with qPCR validations.
Table 1.
Differential expression of P. multocida genes involved in SOS response
| GeneID | Product Name | Locus | AMX* | CTC* | ENR* |
|---|---|---|---|---|---|
| 1244239 | ImpA | impA | -0.52 | -0.53 | 4.55 |
| 1244433 | DNA-binding protein Fis | fis | ns | ns | 1.41 |
| 1244528 | LexA repressor | lexA | ns | 1.60 | 9.87 |
| 1244611 | Hypothetical protein PM1264 | - | -0.78 | -0.57 | ns |
| 1244637 | Transcriptional repressor protein MetJ | metJ | -0.53 | -0.74 | -0.80 |
| 1244659 | Hypothetical protein PM1312 | - | -0.56 | -0.68 | -0.31 |
| 1244737 | DNA-directed RNA polymerase subunit alpha | rpoA | ns | -0.77 | 1.27 |
| 1244795 | Hypothetical protein PM1448 | - | -0.81 | -0.70 | 1.29 |
| 1244828 | Hypothetical protein PM1481 | - | -0.53 | -0.51 | -0.51 |
| 1244993 | Hypothetical protein PM1646 | - | -0.62 | ns | -0.70 |
| 1245061 | Hypothetical protein PM1714 | - | -0.74 | -0.91 | ns |
| 1245083 | DNA-directed RNA polymerase subunit beta' | rpoC | ns | -0.76 | -0.87 |
| 1245184 | ATP-dependent helicase HepA | hepA | -0.77 | -0.77 | 1.69 |
| 1245314 | DNA-binding transcriptional activator GutM | gutM | -0.55 | -0.69 | -0.62 |
| 1243539 | Hypothetical protein PM0192 | recJ | -0.77 | -0.79 | 1.24 |
| 1243679 | Hypothetical protein PM0332 | recN | ns | ns | 11.54 |
| 1243758 | DNA-dependent helicase II | uvrD | ns | ns | 4.26 |
| 1243814 | DNA polymerase IV | dinP | -0.76 | -0.83 | 1.83 |
| 1244020 | Hypothetical protein PM0673 | - | -0.63 | -0.81 | -0.47 |
| 1244323 | Holliday junction DNA helicase B | ruvB | ns | -0.78 | 2.37 |
| 1244324 | Holliday junction DNA helicase motor protein | ruvA | ns | ns | 3.39 |
| 1244459 | DeaD | deaD | -0.78 | -0.72 | -0.67 |
| 1244499 | DNA repair protein RadC | radC | -0.52 | -0.60 | -0.65 |
| 1244507 | DNA polymerase III subunit beta | dnaN | ns | ns | 1.41 |
| 1244526 | Primosomal replication protein N | priB | ns | ns | 1.67 |
| 1244563 | DNA polymerase III subunit delta | holA | ns | -0.88 | 1.38 |
| 1244666 | MutY | mutY | -0.68 | -0.86 | 1.17 |
| 1244774 | RecQ | recQ | -0.86 | -0.84 | 1.11 |
| 1244823 | DNA gyrase subunit B | gyrB | ns | 1.36 | 1.45 |
| 1245063 | NAD-dependent DNA ligase LigA | ligA | -0.84 | 1.08 | 1.56 |
| 1245164 | Recombinase A | recA | ns | ns | 9.96 |
| 1245177 | DNA mismatch repair protein | mutS | -0.87 | -0.78 | 1.50 |
| 1245268 | ATP-dependent RNA helicase RhlB | rhlB | -0.73 | -0.83 | 1.07 |
| 1245298 | Excinuclease ABC subunit A | uvrA | -0.78 | ns | 2.57 |
| 1243785 | Hypothetical protein PM0438 | ftsH | -0.94 | -0.80 | 1.13 |
| 1244083 | Hypothetical protein PM0736 | DnaK | ns | -0.74 | 1.50 |
| 1244087 | Hypothetical protein PM0740 | dnaJ | -0.74 | -0.79 | 1.29 |
| 1245051 | ClpB | clpB | -0.66 | ns | 2.14 |
| 1245095 | ATP-dependent protease ATP-binding subunit | hslU | -0.70 | ns | 2.58 |
| 1245163 | Recombination regulator RecX | recX | -0.54 | -0.78 | 6.44 |
* Ratio of treatment/control normalized intensities. ns: no significant change in gene expression with sub-MIC of antibiotic.
Figure 1.

Validation of microarray differential gene expression data by quantitative real time RT-PCR (qPCR). Ratio of treated vs. control were calculated for microarray data (ordinate) and qPCR data (abscissa). A total of six genes that were up or down regulated with amoxicillin, chlortetracycline or enrofloxacin were compared. The correlation coefficient r2 was 0.84.
Compared to the untreated control, expression of 413, 392, and 473 genes had significantly altered expression in response to AMX, CTC, and ENR, respectively, and the overlap between treatments is shown in the Venn diagram (Figure 2). The extensive overlap of regulated genes with the three different antibiotics is consistent with the recent transcriptome analysis of ampicillin and ofloxacin effects in E. coli, which showed that these two unrelated antibiotics had a significant overlap of regulated genes [14].
Figure 2.

Venn diagram of gene expression in response to sub-MIC antibiotics. The data intersections between significant changes in gene expression of P. multocida in response to sub-MIC amoxicillin (AMX), chlortetracycline (CTC) and enrofloxacin (ENR).
Functional analysis of DE genes: COGs
The three antibiotics used in this study have distinct modes of action; AMX is a cell wall biosynthesis inhibitor, CTC is a protein synthesis inhibitor, and ENR inhibits DNA gyrase and DNA topoisomerase IV activities [15]. At the COG category level, the three antibiotics had different effects on gene expression (Figure 3). The AMX and CTC treatments resulted in an overall decrease in gene expression in all COG categories. The overall suppression of gene expression could indicate that the antibiotics have a marked detrimental effect on the fitness of P. multocida at doses below MIC, or it is also possible that the overall transcriptional shutdown is a compensatory response by slowing metabolism. ENR had varying effects on gene expression in different COG categories. In particular, ENR caused a pronounced increase in expression of genes in categories I (lipid metabolism), J (translation, ribosomal structure and biogenesis), and L (DNA replication, recombination and repair). All three antibiotics had reduced expression of genes in COGs V (defense mechanisms), G (carbohydrate transport and metabolism), P (inorganic ion transport and metabolism) and Q (secondary metabolites biosynthesis, transport and catabolism).
Figure 3.

Summary of significant changes in P. multocida gene expression grouped by COGs. Numbers on the y-axis represent the percentage of genes in each COG category whose expression either significantly increased (black bars) or decreased (gray bars) in response to antibiotic treatment. COG category descriptions are: A, RNA processing and modification; K, Transcription; L, Replication, recombination and repair; D, Cell cycle control, mitosis and meiosis; V, Defense mechanisms; T, Signal transduction mechanisms; M, Cell wall/membrane biogenesis; N, Cell motility; W, Extracellular structures; U, Intracellular trafficking and secretion; O, Posttranslational modification, protein turnover, chaperones; C, Energy production and conversion; G, Carbohydrate transport and metabolism; E, Amino acid transport and metabolism; F, Nucleotide transport and metabolism; H, Coenzyme transport and metabolism; I, Lipid transport and metabolism P, Inorganic ion transport and metabolism; Q, Secondary metabolites biosynthesis, transport and catabolism R, General function prediction only; S, Function unknown; -, not in COGs
Effects of antibiotics on known target genes
We observed altered expression of some of the known targets (direct or inferred based on mechanism of action) with each antibiotic. CTC reduced the expression of genes encoding ribosomal proteins S4 and S7, which interact with tetracyclines [16]. One quarter-MIC of ENR resulted in a 1.5 fold increase in the expression of gyrB, which encodes a known ENR target, DNA gyrase B (Table 2). We had previously reported that the expression of RecA protein increased in response to sub-MIC of ENR [10], and in the current study we detected increased expression of recA. With AMX, except for the expression of ponC, there were no detectable differences in the expression of genes encoding penicillin binding proteins (pbp). There was a 50% decrease in ponC (pbp) gene expression. However, this was a not an AMX specific effect, as all three antibiotics caused a decrease in ponC gene expression.
Table 2.
Changes in specific target gene expression in response to sub-MIC of antibiotics
| GeneID | Product Name | Locus | AMX* | CTC* | ENR* | COG(s) |
|---|---|---|---|---|---|---|
| 1244738 | 30S ribosomal protein S4 | rpsD | ns | -0.82 | 1.29 | COG0522J |
| 1244702 | 30S ribosomal protein S7 | rpS7 | 1.11 | -0.93 | 1.69 | COG0049J |
| 1244823 | DNA gyrase subunit B | gyrB | ns | 1.36 | 1.45 | COG0187L |
| 1245164 | Recombinase A | recA | ns | ns | 9.96 | COG0468L |
| 1243991 | PonC | ponC | -0.55 | -0.56 | -0.62 | COG4953M |
*Ratio of treatment/control normalized intensities. ns: no significant change in gene expression with sub-MIC of antibiotic.
While regulation of expression of known targets is an expected response to antibiotics, it is not a consistent finding; expression of the target is usually not affected. For example, microarray analysis showed that enrofloxacin, trimethoprim, brodimoprim, and cefquinome had no effects on expression of their targets in P. multocida [12]. However, even though expression of the known antibiotic target is often not affected, bacteria typically have a "signature" gene expression response to specific antibiotics. Indeed, bacterial transcription profiles are now sometimes used to obtain initial indications of the mechanism of action for new compounds [17,18].
Common trends in response to AMX, CTC and ENR
Despite differences in their mechanism of action, the majority of genes with significantly altered expression (282) were common to all three antibiotics (Figure 2). Beyond the effects on specific target gene expression, antibiotics are known to cause secondary effects on genes involved in general physiology as part of the adaptive response to antibiotic stress. A hallmark of recently described antibiotic mediated bacterial cell death common to bactericidal antibiotics in E. coli is the generation of hydroxyl radicals with subsequent induction of SOS response [19,20]. These effects were noted for MIC as well as sub-MIC concentrations of the antibiotics. There is increasing appreciation for the fact that fine tuning of these responses is unique to each organism and needs to be evaluated as such to facilitate identification of targets that potentiate the bactericidal activity of antibiotics. The P. multocida genome is known to contain genes necessary for antibiotic mediated SOS response [6] (for example, sulA, which is necessary for beta-lactam mediated SOS response).
Antibiotic stress in P. multocida resulted in increased ATP synthesis (Additional file 2, supplemental table 2). While this effect has been described for gyrase inhibitors [21], in P. multocida this response was common to all three antibiotics. In particular, all three antibiotics influenced gene expression involved in de novo nucleotide biosynthesis. The overall effects on expression of purM (increase), purK (decrease), and purF (decrease) could reduce the intracellular concentrations of IMP, while increased expression of pyrG and pyrF with ENR could result in increased concentrations of CTP and UDP.
Both AMX and CTC impaired the expression of hsp90, thus affecting proper protein folding under stress conditions in P. multocida. All three classes of antibiotics adversely affected putrescine (potE), ribose (rbscA and rbscC), and molybdate (modC) transport systems. Alterations to modC expression could have wide ranging effects on bacterial physiology due to effects on the synthesis of molybdoenzymes (Additional file 2, supplemental table 2). Reduced levels of polyamines like putrescine could have profound negative effects on protein translation and impair the ability to cope with oxidative stress [22].
Expression of 121 genes annotated as coding for hypothetical proteins were altered in response to the antibiotics (Additional file 1, supplemental table 1). Lack of functional information for these genes hampers our understanding of their role in adaptation of P. multocida to antibiotic stress and demonstrates the need for continuous functional annotation of genes beyond the initial annotation that is described with the genome sequence.
One of the demonstrated outcomes of antibiotic stress in E. coli is alterations in iron homeostasis; namely, expression of genes involved in siderophore mediated iron transport are affected (for example, fecC) [19]. In P. multocida, expression of genes encoding iron transporters fecC and fecE were reduced when it was grown in the presence of 1/4 MIC of AMX or ENR (Additional file 2, supplemental table 2).
Changes in the ratio of NAD+/NADH are known to influence the levels of toxic superoxide formation, which ultimately leads to hydroxyl radical formation. NADH I levels are directly linked to the activities of TCA cycle enzymes that generate NADH from NAD+ [19]. ENR treatment caused decreased expression of sucB, and all three antibiotics caused decreased lpdA expression, which could reduce hydroxyl radical formation. Expression of the gene encoding anaerobic respiration electron transfer enzyme molybdoenzyme dimethylsulfoxide reductase was reduced in response to AMX and ENR. AMX treatment reduced the expression of acetyl-CoA carboxylase enzyme (accB, accD), which catalyzes the first step of type II fatty acid biosynthesis as well as the step catalyzed by acyl carrier protein S-malonyltransferase (fabD); by contrast, ENR increased the expression of these genes, which could result in increased fatty acid biosynthesis.
DE genes: network analysis
COG analysis of DE genes was useful for identifying overall trends at a broad functional category level. Gene ontology (GO) analysis of P. multocida, which is available through Uniprot, was useful to some extent in adding specific functions to the genes within each of the broad functional categories represented by COGs. However, neither of these two approaches could actually show exactly how the genes within a functional category were interacting with each other to bring about a specific function. To enable network analysis, we used Pathway Studio to build interaction networks for all DE P. multocida genes with AMX, CTC and ENR. Careful analysis of these networks revealed expression cascades for some of the DE genes common to CTC and ENR.
Expression of fnr increased in response to sub-MIC of CTC and ENR (Figure 4). Fnr regulates the transcription of many genes that are involved in either aerobic or anaerobic respiration, including Nap nitrate reductase, which facilitates nitrate reduction in the periplasmic space. Expression of napD and napF increased in response to ENR and decreased with CTC (Additional file 3, supplemental figure 1). NapD is a chaperone protein that is specific for NapA and is required for the stability of NapA protein. NapF stimulates the Nap reductase. NapF promoters regulate the transcription of cmABCDEFGH operon in E. coli, which constitutes the cytochrome biogenesis system. Expression of ccmH increased with CTC and decreased with ENR (Table 3). The identification of this cascade of gene regulation was possible by combining the network analysis with the functional information available at EcoCyc. The implications of up regulation of enzymes that facilitate anaerobic respiration in response to antibiotics remain unclear at present.
Figure 4.
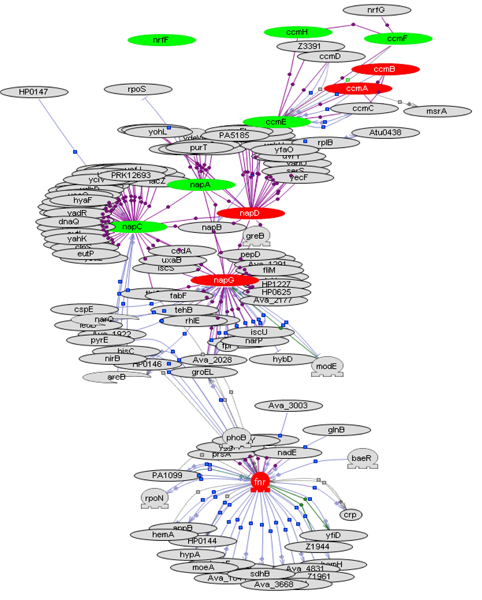
Fumarate/nitrate response regulator network in P. multocida in response to enrofloxacin visualized in Pathway Studio. P. multocida sub-MIC ENR response was marked by significant changes in fnr response regulated genes. Red nodes are genes with increased expression and green nodes are genes with decreased expression. The rest of the interacting nodes are shown in gray. These nodes had no significant changes in expression or were orthologs from additional gram-negative species in the molecular interaction database in Pathway Studio.
Table 3.
Fnr regulated genes and their response to sub-MIC of chlortetracycline and enrofloxacin
| GeneID | Product Name | Locus | CTC* | ENR* |
|---|---|---|---|---|
| 1244015 | Fumarate/nitrate reduction transcriptional regulator | fnr | 1.49 | 1.43 |
| 1243352 | Cytochrome c biogenesis protein CcmA | ccmA | -0.70 | 1.80 |
| 1243353 | CcmB | ccmB | -0.45 | 1.27 |
| 1243356 | cytochrome c-type biogenesis protein CcmE | ccmE | -0.77 | -0.57 |
| 1243357 | CcmF | ccmF | ns | -0.44 |
| 1243359 | CcmH | ccmH_1 | 1.41 | -0.43 |
| 1243360 | CcmH | ccmH_2 | 1.56 | -0.52 |
| 1244939 | Hypothetical protein PM1592 | napF | -0.50 | 2.11 |
| 1244940 | NapD | napD | -0.52 | 1.35 |
| 1244941 | Nitrate reductase | napA | -0.81 | -0.76 |
| 1244945 | NapC | napC | 1.40 | -0.68 |
* Ratio of treatment/control normalized intensities. ns: no significant change in gene expression with sub-MIC of antibiotic.
Network analysis also facilitated the identification of differences in the SOS response with different antibiotics in P. multocida (Figure 5 (ENR) and Additional file 3, supplemental figures 2 (AMX) and 3 (CTC)). In particular, the response to ENR showed the signature gene expression pattern typical of SOS response (Figure 5). Increased RecA protein expression results in the cleavage of LexA repressor, thus removing the LexA mediated repression of DNA repair genes like uvrD. Expression of both recA and lexA genes increased in response to ENR (Table 1). Expression of recN was increased, which also relieves LexA repression [23-25]. Genes involved in fine-tuning the actions of RecA, namely recX and uvrD, also had increased expression. Expression of primosome genes (dnaJ and dnaK) that encode enzymes required for re-starting the stalled replication fork and other replicative enzymes like DNA polymerase III increased with ENR.
Figure 5.
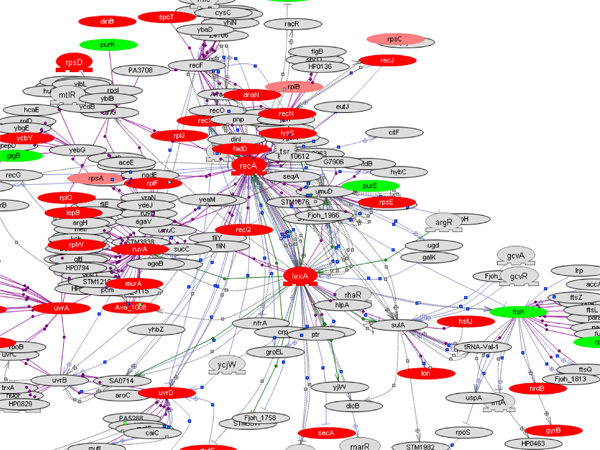
SOS response gene network in P. multocida in response to enrofloxacin. P. multocida sub-MIC ENR response was marked by significant changes in SOS response genes. Red nodes are genes with increased expression and green nodes are genes with decreased expression. Pink nodes represent no significant changes in gene expression while gray nodes are orthologs from gram-negative species in the molecular interaction database in Pathway Studio.
It is reported that beta lactam mediated cell killing involves SOS response through SulA and DpiBA two component system [26]. Based on the genome annotation of Pm70 [6], all the components of this regulon are not present. There was no induction of the expression of recA or lexA with AMX (Additional file 3, supplemental figure 2). The expression profile of SOS response genes remained either unchanged or showed decreased expression, which indicates that sub-MIC AMX does not activate SOS response in P. multocida. Excluding the increased expression of lexA and gyrB, CTC (Additional file 3, supplemental figure 3) also did not activate SOS response.
DE virulence genes
Productive infection by bacterial pathogens relies on the expression of virulence factors that have wide ranging functions like competence, adherence, capsule synthesis and export, evading host immune responses etc. Transcription profiling of the response of a bovine P. multocida isolate (L386) to MIC of eight different antibiotics identified mostly reduced virulence gene expression [12]. In the current study, transcription profiling of the P. multocida response to AMX, CTC and ENR identified significant changes in the expression of known and putative virulence genes. AMX and CTC reduced the expression of ompA, a known virulence factor of P. multocida involved in binding to host cells [27] (Table 4). AMX and CTC decreased expression of the gene encoding detoxifying enzyme superoxide dismutase, which is one of the virulence genes identified in the P. multocida L386 study [12]. Additional virulence factors (based on L386 study) which had reduced expression in Pm70 are: clpB protease with AMX, capsule transport protein hexA with all three antibiotics, PM1714 regulator with AMX and CTC, capsule biosynthesis genes phyA and hyaE with AMX and CTC, phyB with CTC, and tight adherence gene tadB with AMX. Expression of dnaK, which is required for virulence in a number of bacterial pathogens [26], was decreased by CTC.
Table 4.
Effects of sub-MIC of antibiotics on P. multocida putative virulence factors
| GeneID | Product Name | Locus | AMX* | CTC* | ENR* |
|---|---|---|---|---|---|
| 1244083 | Hypothetical protein PM0736 | DnaK | ns | -0.74 | 1.50 |
| 1244119 | PhyB | phyB | ns | -0.84 | 1.41 |
| 1244120 | PhyA | phyA | -0.80 | -0.71 | 1.71 |
| 1244121 | HyaE | hyaE | -0.64 | -0.91 | 1.27 |
| 1244128 | HexA | hexA | -0.74 | -0.69 | -0.73 |
| 1244133 | Hypothetical protein PM0786 | OmpA | -0.83 | -0.75 | ns |
| 1244195 | Hypothetical protein PM0848 | tadB | -0.51 | ns | ns |
| 1245051 | ClpB | clpB | -0.66 | ns | 2.14 |
| 1245061 | Hypothetical protein PM1714 | - | -0.74 | -0.91 | ns |
* Ratio of treatment/control normalized intensities. ns: no significant change in gene expression with sub-MIC of antibiotic.
Conclusion
Our global transcriptome analysis of P. multocida response to three antibiotics with differing modes of action identified gene expression changes in a little over a quarter of the annotated open reading frames in the genome. The antibiotics had varying effects on various cellular and metabolic functions. Amoxicillin reduced the overall transcription rate as reflected by the majority of the identified significant changes in gene expression showing a downward trend in expression. An interesting aspect of the AMX response was the marked lack of expression of SOS response genes. Enrofloxacin, a DNA gyrase inhibitor, resulted in the significant overexpression of its target gene and induced a typical SOS response. Analysis of DE genes in the context of interacting protein networks facilitated the identification of coordinated regulation of gene expression across different COG functional categories. Sub-MIC of antibiotics influenced the expression of virulence factors in P. multocida. Our results form the framework for understanding the global effects of antibiotics on P. multocida, which will aid rational drug design for containing as well as treating infections caused by this pathogen across multiple species.
Methods
Bacterial culture and RNA isolation
P. multocida Pm70 was cultivated in brain heart infusion broth (BHI) at 37°C with rotary aeration. Minimum inhibitory concentrations (MICs) of AMX, CTC and ENR for Pm70 are 0.5 μg/ml, 4 μg/ml, and 0.031 μg/ml, respectively [10]. Growth kinetics of Pm70 in the presence of 1/4 MIC of the three antibiotics were previously described [10]. Stationary phase cultures of Pm70 were used to inoculate 50 ml BHI to an initial A600 of 0.05; antibiotic treated cultures contained 1/4 MIC of AMX, CTC, or ENR, and control cultures were grown without antibiotics. For each treatment, cultures were grown in triplicate to mid-log phase (A600 of 0.8). RNAprotect (Qiagen) was added to culture samples, and bacteria were harvested by centrifugation (10,000 × g, 10 min, 4°C). Pellets were stored at -80°C.
Total RNA from three biological replicate cultures (for untreated control culture as well as antibiotic treated cultures) was isolated using Qiagen RNeasy kit using the manufacturer's protocol. The quality and concentration of RNA was determined by Agilent Bioanalyzer.
Microarrays and data analysis
A custom oligonucleotide microarray consisting of all the 2015 annotated open reading frames (ORFs) of Pasteurella multocida strain Pm70 was constructed by NimbleGen Systems. The array design included 23 perfect match (PM) and mismatch (MM) probes per target gene, and each probe was spotted twice. Reverse transcription, cDNA labeling, and hybridization were conducted by NimbleGen Sytems according to their established protocols. Briefly, three independent RNA samples (10 μg each) from untreated and antibiotic treated Pm70 were reverse transcribed using Random Hexamer (Gibco) and SuperScript II Reverse Transcriptase (Invitrogen). Biotin end-labeling of cDNA utilized Terminal Deoxynucleotidyl Transferase (Promega) with Biotin-N6-ddATP (Perkin Elmer); hybridization and washes were conducted using NimbleGen Systems protocol. Detection of hybridized biotin-labeled probe used Fluorolink Cy3 Labeled Streptavidin (Amersham Pharmacia).
Raw intensity data (single channel) were log transformed, and normalization was done by quantile normalization [28] and robust multichip analysis (RMA) algorithm [29]. The experimental design and all microarray data have been deposited in the NCBI Gene Expression Omnibus (GEO, http://www.ncbi.nlm.nih.gov/geo/, accession number GSE12779). ANOVA followed by step-down Bonferroni correction for multiple testing was conducted to identify genes with significant changes in expression relative to untreated control (p ≤ 0.05) in any group. Significant changes between control vs specific antibiotic treatments were identified by performing Dunnett's test [30]. The differences in gene expression in response to antibiotics were calculated as the ratio of treatment vs control intensities.
Real time RT-PCR
The majority of significant changes in gene expression identified in this study were less than one-fold. Therefore, to validate changes in gene expression, we performed duplex real time quantitative RT-PCR (qPCR) of six genes: gyrb, impA, rpsg, hpkR, recQ, and murA using gapdh as the internal standard. The RNA template used for qPCR was the same RNA that was used for microarray hybridizations. The probes and primers for duplex RT-PCR were designed using Beacon Designer software (Additional file 4, supplemental table 3). Reactions were performed using the Platinum® SYBR® Green One-Step qRT-PCR Kit (Invitrogen Corporation, Carlsbad, CA). Amplification and detection of specific products were done using the iCycler iQ Real-Time PCR Detection System (Bio-Rad Laboratories, Inc., Hercules, CA). Regression analysis of the Ct values of the test RT-PCRs was used to generate standard curves. The mean Ct value for the GAPDH mRNA-specific reactions was used to normalize the test values. Regression analysis of the gene expression trends determined by qPCR and microarray analysis was performed in Microsoft Excel.
Functional analysis of differentially expressed genes
Initial functional analysis of genes with significant changes in expression was done using clusters of orthologous groups (COG) classification [31]. For each COG category in the genome, the percent increase or decrease in expression of genes belonging to that category for each antibiotic treatment was calculated. The COG functional categories described for P. multocida genes [6] along with the description for proteins encoded by the genes at Uniprot [32] were used to identify overall themes in antibiotic response. Specific functions of P. multocida proteins were deduced from information available for E. coli orthologs at the EcoCyc database [33]. Network analysis of DE genes was done in Pathway Studio (Ariadne Genomics) as described earlier [11]. Briefly, we built interaction networks in Pathway Studio with proteins of interest including the upstream regulators and downstream targets. In the interaction networks, different colors were used for nodes to indicate significant increase (red), decrease (green), or no change (pink) in gene expression in response to sub-MIC of antibiotic. Entities in the interaction map that were not present in the Pm70 genome were shown in gray color.
List of abbreviations used
MIC: minimum inhibitory concentration; CTC: chlortetracycline; AMX: amoxicillin; ENR: enrofloxacin; BHI: brain heart infusion; COG: Clusters of Orthologous Groups; DE: differentially expressed; recA: recombinase A; gyrB: DNA gyrase B.
Competing interests
The authors declare that they have no competing interests.
Authors' contributions
BN cultured Pm70, did RNA isolations, data analysis and network modeling and wrote the draft of the manuscript. LAS carried out the qPCR validations and contributed to the methods and results of this aspect in the manuscript. ML and SCB conceived and coordinated this study and helped draft the manuscript. All authors read and approved the final manuscript.
Supplementary Material
Significant changes identified in P. multocida gene expression with AMX, CTC and ENR.
Supplemental table 2. Significant changes identified in P. multocida gene expression common to more than one antibiotic.
Supplemental figures. Interaction networks. The network diagrams show changes in gene expression in response to sub-MIC. Red and green indicate significant increase and decrease in expression respectively. Genes whose expression did not change (pink) and genes in the network from other bacteria (gray) are also included. Supplemental figure 1. fnr regulated genes with CTC administration. Supplemental figure 2. Interaction network with genes involved in SOS response with AMX administration. Supplemental figure 3. Interaction network with genes involved in SOS response with CTC administration.
Supplemental table 3. Quantitative RT-PCR probes and primers. The sequences of primers used for qPCR validations of selected gene expression changes in microarray.
Contributor Information
Bindu Nanduri, Email: bnanduri@cvm.msstate.edu.
Leslie A Shack, Email: shack@cvm.msstate.edu.
Shane C Burgess, Email: burgess@cvm.msstate.edu.
Mark L Lawrence, Email: lawrence@cvm.msstate.edu.
Acknowledgements
This project was partially supported by a grant from the National Science Foundation (EPS-0556308-06040293) and a competitive grant from Mississippi State University Life Sciences and Biotechnology Institute (LSBI). We acknowledge Dr. Vivek Kapur for P. multocida Pm70 strain and Dr. Carolyn Boyle for statistical analysis of microarray datasets.
This article has been published as part of BMC Genomics Volume 10 Supplement 2, 2009: Proceedings of the Avian Genomics Conference and Gene Ontology Annotation Workshop. The full contents of the supplement are available online at http://www.biomedcentral.com/1471-2164/10?issue=S2
References
- Pasteur L. De l'att'enuation du virus du chol'era des poules. C R Acad Sci. 1880;91:673–680. [Google Scholar]
- Pasteur L. Sur les virus-vaccins du chol'era des poules et du charbon. C R Trav Congr Int Dir Agronom session de Versailles. 1881. pp. 161–162.
- Ellison ML, Champlin FR. Outer membrane permeability for nonpolar antimicrobial agents underlies extreme susceptibility of Pasteurella multocida to the hydrophobic biocide triclosan. Vet Microbiol. 2007;124(3–4):310–318. doi: 10.1016/j.vetmic.2007.04.038. [DOI] [PubMed] [Google Scholar]
- Harper M, Boyce JD, Adler B. Pasteurella multocida pathogenesis: 125 years after Pasteur. FEMS Microbiol Lett. 2006;265(1):1–10. doi: 10.1111/j.1574-6968.2006.00442.x. [DOI] [PubMed] [Google Scholar]
- Talan DA, Citron DM, Abrahamian FM, Moran GJ, Goldstein EJ. Bacteriologic analysis of infected dog and cat bites. Emergency Medicine Animal Bite Infection Study Group. N Engl J Med. 1999;340(2):85–92. doi: 10.1056/NEJM199901143400202. [DOI] [PubMed] [Google Scholar]
- May BJ, Zhang Q, Li LL, Paustian ML, Whittam TS, Kapur V. Complete genomic sequence of Pasteurella multocida, Pm70. Proc Natl Acad Sci USA. 2001;98(6):3460–3465. doi: 10.1073/pnas.051634598. [DOI] [PMC free article] [PubMed] [Google Scholar]
- Boyce JD, Wilkie I, Harper M, Paustian ML, Kapur V, Adler B. Genomic scale analysis of Pasteurella multocida gene expression during growth within the natural chicken host. Infect Immun. 2002;70(12):6871–6879. doi: 10.1128/IAI.70.12.6871-6879.2002. [DOI] [PMC free article] [PubMed] [Google Scholar]
- Paustian ML, May BJ, Cao D, Boley D, Kapur V. Transcriptional response of Pasteurella multocida to defined iron sources. J Bacteriol. 2002;184(23):6714–6720. doi: 10.1128/JB.184.23.6714-6720.2002. [DOI] [PMC free article] [PubMed] [Google Scholar]
- Paustian ML, May BJ, Kapur V. Transcriptional response of Pasteurella multocida to nutrient limitation. J Bacteriol. 2002;184(13):3734–3739. doi: 10.1128/JB.184.13.3734-3739.2002. [DOI] [PMC free article] [PubMed] [Google Scholar]
- Nanduri B, Lawrence ML, Boyle CR, Ramkumar M, Burgess SC. Effects of subminimum inhibitory concentrations of antibiotics on the Pasteurella multocida proteome. J Proteome Res. 2006;5(3):572–580. doi: 10.1021/pr050360r. [DOI] [PubMed] [Google Scholar]
- Nanduri B, Lawrence ML, Peddinti DS, Burgess SC. Effects of Subminimum Inhibitory Concentrations of Antibiotics on the Pasteurella multocida Proteome: A Systems Approach. Comp Funct Genomics. 2008. p. 254836. [DOI] [PMC free article] [PubMed]
- Melnikow E, Schoenfeld C, Spehr V, Warrass R, Gunkel N, Duszenko M, Selzer PM, Ullrich HJ. A compendium of antibiotic-induced transcription profiles reveals broad regulation of Pasteurella multocida virulence genes. Vet Microbiol. 2008. [DOI] [PubMed]
- Weston AD, Hood L. Systems biology, proteomics, and the future of health care: toward predictive, preventative, and personalized medicine. J Proteome Res. 2004;3(2):179–196. doi: 10.1021/pr0499693. [DOI] [PubMed] [Google Scholar]
- Kaldalu N, Mei R, Lewis K. Killing by ampicillin and ofloxacin induces overlapping changes in Escherichia coli transcription profile. Antimicrobial agents and chemotherapy. 2004;48(3):890–896. doi: 10.1128/AAC.48.3.890-896.2004. [DOI] [PMC free article] [PubMed] [Google Scholar]
- Walsh C. Antibiotics: actions, origins, resistance. ASM press; 2003. [Google Scholar]
- Yonath A, Bashan A. Ribosomal crystallography: initiation, peptide bond formation, and amino acid polymerization are hampered by antibiotics. Annu Rev Microbiol. 2004;58:233–251. doi: 10.1146/annurev.micro.58.030603.123822. [DOI] [PubMed] [Google Scholar]
- Freiberg C, Fischer HP, Brunner NA. Discovering the mechanism of action of novel antibacterial agents through transcriptional profiling of conditional mutants. Antimicrobial agents and chemotherapy. 2005;49(2):749–759. doi: 10.1128/AAC.49.2.749-759.2005. [DOI] [PMC free article] [PubMed] [Google Scholar]
- Hutter B, Schaab C, Albrecht S, Borgmann M, Brunner NA, Freiberg C, Ziegelbauer K, Rock CO, Ivanov I, Loferer H. Prediction of mechanisms of action of antibacterial compounds by gene expression profiling. Antimicrobial agents and chemotherapy. 2004;48(8):2838–2844. doi: 10.1128/AAC.48.8.2838-2844.2004. [DOI] [PMC free article] [PubMed] [Google Scholar]
- Dwyer DJ, Kohanski MA, Hayete B, Collins JJ. Gyrase inhibitors induce an oxidative damage cellular death pathway in Escherichia coli. Mol Syst Biol. 2007;3:91. doi: 10.1038/msb4100135. [DOI] [PMC free article] [PubMed] [Google Scholar]
- Kohanski MA, Dwyer DJ, Hayete B, Lawrence CA, Collins JJ. A common mechanism of cellular death induced by bactericidal antibiotics. Cell. 2007;130(5):797–810. doi: 10.1016/j.cell.2007.06.049. [DOI] [PubMed] [Google Scholar]
- Dahan-Grobgeld E, Livneh Z, Maretzek AF, Polak-Charcon S, Eichenbaum Z, Degani H. Reversible induction of ATP synthesis by DNA damage and repair in Escherichia coli. In vivo NMR studies. J Biol Chem. 1998;273(46):30232–30238. doi: 10.1074/jbc.273.46.30232. [DOI] [PubMed] [Google Scholar]
- Shah P, Swiatlo E. A multifaceted role for polyamines in bacterial pathogens. Mol Microbiol. 2008;68(1):4–16. doi: 10.1111/j.1365-2958.2008.06126.x. [DOI] [PubMed] [Google Scholar]
- Erill I, Campoy S, Barbe J. Aeons of distress: an evolutionary perspective on the bacterial SOS response. FEMS Microbiol Rev. 2007;31(6):637–656. doi: 10.1111/j.1574-6976.2007.00082.x. [DOI] [PubMed] [Google Scholar]
- Kelley WL. Lex marks the spot: the virulent side of SOS and a closer look at the LexA regulon. Mol Microbiol. 2006;62(5):1228–1238. doi: 10.1111/j.1365-2958.2006.05444.x. [DOI] [PubMed] [Google Scholar]
- Cox MM. Regulation of bacterial RecA protein function. Crit Rev Biochem Mol Biol. 2007;42(1):41–63. doi: 10.1080/10409230701260258. [DOI] [PubMed] [Google Scholar]
- Miller C, Thomsen LE, Gaggero C, Mosseri R, Ingmer H, Cohen SN. SOS response induction by beta-lactams and bacterial defense against antibiotic lethality. Science. 2004;305(5690):1629–1631. doi: 10.1126/science.1101630. [DOI] [PubMed] [Google Scholar]
- Dabo SM, Confer AW, Quijano-Blas RA. Molecular and immunological characterization of Pasteurella multocida serotype A:3 OmpA: evidence of its role in P. multocida interaction with extracellular matrix molecules. Microb Pathog. 2003;35(4):147–157. doi: 10.1016/S0882-4010(03)00098-6. [DOI] [PubMed] [Google Scholar]
- Bolstad BM, Irizarry RA, Astrand M, Speed TP. A comparison of normalization methods for high density oligonucleotide array data based on variance and bias. Bioinformatics. 2003;19(2):185–193. doi: 10.1093/bioinformatics/19.2.185. [DOI] [PubMed] [Google Scholar]
- Irizarry RA, Hobbs B, Collin F, Beazer-Barclay YD, Antonellis KJ, Scherf U, Speed TP. Exploration, normalization, and summaries of high density oligonucleotide array probe level data. Biostatistics. 2003;4(2):249–264. doi: 10.1093/biostatistics/4.2.249. [DOI] [PubMed] [Google Scholar]
- Shaffer JP. Multiple comparisons emphasizing selected contrasts: an extension and generalization of Dunnett's procedure. Biometrics. 1977;33(2):293–303. doi: 10.2307/2529779. [DOI] [PubMed] [Google Scholar]
- Tatusov RL, Koonin EV, Lipman DJ. A genomic perspective on protein families. Science. 1997;278(5338):631–637. doi: 10.1126/science.278.5338.631. [DOI] [PubMed] [Google Scholar]
- The universal protein resource (UniProt) Nucleic Acids Res. 2008. pp. D190–195. [DOI] [PMC free article] [PubMed]
- Keseler IM, Collado-Vides J, Gama-Castro S, Ingraham J, Paley S, Paulsen IT, Peralta-Gil M, Karp PD. EcoCyc: a comprehensive database resource for Escherichia coli. Nucleic Acids Res. 2005. pp. D334–337. [DOI] [PMC free article] [PubMed]
Associated Data
This section collects any data citations, data availability statements, or supplementary materials included in this article.
Supplementary Materials
Significant changes identified in P. multocida gene expression with AMX, CTC and ENR.
Supplemental table 2. Significant changes identified in P. multocida gene expression common to more than one antibiotic.
Supplemental figures. Interaction networks. The network diagrams show changes in gene expression in response to sub-MIC. Red and green indicate significant increase and decrease in expression respectively. Genes whose expression did not change (pink) and genes in the network from other bacteria (gray) are also included. Supplemental figure 1. fnr regulated genes with CTC administration. Supplemental figure 2. Interaction network with genes involved in SOS response with AMX administration. Supplemental figure 3. Interaction network with genes involved in SOS response with CTC administration.
Supplemental table 3. Quantitative RT-PCR probes and primers. The sequences of primers used for qPCR validations of selected gene expression changes in microarray.