Abstract
OBJECTIVE: To determine whether dry weight gain accompanied by an increase in muscle mass is associated with a survival benefit in patients receiving maintenance hemodialysis (HD).
PATIENTS AND METHODS: In a nationally representative 5-year cohort of 121,762 patients receiving HD 3 times weekly from July 1, 2001, through June 30, 2006, we examined whether body mass index (BMI) (calculated using 3-month averaged post-HD dry weight) and 3-month averaged serum creatinine levels (a likely surrogate of muscle mass) and their changes over time were predictive of mortality risk.
RESULTS: In the cohort, higher BMI (up to 45) and higher serum creatinine concentration were incrementally and independently associated with greater survival, even after extensive multivariate adjustment for available surrogates of nutritional status and inflammation. Dry weight loss or gain over time exhibited a graded association with higher rates of mortality or survival, respectively, as did changes in serum creatinine level over time. Among the 50,831 patients who survived the first 6 months and who had available data for changes in weight and creatinine level, those who lost weight but had an increased serum creatinine level had a greater survival rate than those who gained weight but had a decreased creatinine level. These associations appeared consistent across different demographic groups of patients receiving HD.
CONCLUSION: In patients receiving long-term HD, larger body size with more muscle mass appears associated with a higher survival rate. A discordant muscle gain with weight loss over time may confer more survival benefit than weight gain while losing muscle. Controlled trials of muscle-gaining interventions in patients receiving HD are warranted.
In a cohort of 121,762 patients receiving long-term hemodialysis, the authors found that larger body size with more muscle mass appears to be associated with a higher survival rate.
BMI = body mass index; CKD = chronic kidney disease; DEXA = dual-energy X-ray absorptiometry; HD = hemodialysis; Kt/V = dialysis dose; LBM = lean body mass; PEW = protein-energy wasting; UKM = urea kinetic modeling
Patients with chronic kidney disease (CKD) who require maintenance hemodialysis (HD) treatment for survival have a high annual mortality of approximately 20% in the United States, mostly as a result of cardiovascular or infectious diseases.1 Despite decades of ongoing efforts to correct such conventional risk factors as obesity, hypertension, or hypercholesterolemia or other potential risk factors (eg, dialysis dose, anemia, or hyperhomocysteinemia), survival of patients receiving maintenance HD has not improved substantially.1 Several recent randomized controlled trials in patients with CKD have showed no survival benefit resulting from increasing the dialysis dose, lowering serum cholesterol levels, correcting hyperhomocysteinemia, or improving anemia.2
Whereas obesity is a risk factor for CKD,3 many epidemiological studies have indicated inverse associations between obesity or other cardiovascular risk factors and mortality in patients with CKD or cardiac disease.4,5 A higher death rate has been observed in patients with CKD who have a low, rather than a high, body mass index (BMI [calculated as the weight in kilograms divided by height in meters squared]),6 blood pressure,7 or serum concentrations of cholesterol8 or homocysteine,9 whereas high values of these risk factors are associated with improved survival. Other patient populations, including those with heart failure,10 those with coronary artery disease,5,11 and those of advanced age,12 also exhibit this so-called obesity paradox. However, most studies have not examined the relative contribution of fat vs muscle mass or their changes over time to the survival benefits of larger body size. Assessing muscle mass or lean body mass (LBM) is particularly difficult in large epidemiological studies and requires such elaborate tests of body composition as dual-energy X-ray absorptiometry (DEXA).13
Among biochemical markers of muscle mass, serum creatinine is most routinely measured, but its association with kidney function may limit its utility as such.14 However, in patients receiving long-term HD who have minimal or no residual renal function and who undergo a stable HD treatment regimen, time-averaged serum creatinine concentration is a more likely surrogate of muscle mass, and its changes over time may represent parallel changes in skeletal muscle mass.15,16 We studied adjusted dry weight and serum creatinine concentration and their changes over time as predictors of mortality in a large and nationally representative cohort of patients receiving long-term HD. We hypothesized that gain in dry weight over time in patients receiving HD is associated with greater survival, especially if it is associated with an increase in muscle mass as reflected by an increase in the serum creatinine concentration at the same dialysis dose level, whereas weight loss or reduction in muscle mass (ie, a decrease in serum creatinine concentration) is associated with increased mortality.
PATIENTS AND METHODS
We extracted, refined, and examined data from all patients with stage 5 CKD who underwent HD treatment from July 1, 2001, to June 30, 2006 (ie, for 20 consecutive calendar quarters) in one of the outpatient dialysis facilities of a US-based large dialysis organization (DaVita, Lakewood, CO). The study was approved by the Harbor-UCLA Medical Center Institutional Review Board with exemption of the requirement for a written consent form.
Clinical and Demographic Measures
The creation and analyses of the 5-year, nonconcurrent, dynamic cohort of DaVita patients receiving HD have been described previously.17-20 To minimize measurement variability and to dilute the effect of short-term variation in nutrition, fluid intake, or dialysis dose on weight or laboratory measurements, all repeated measures for each patient during any given calendar quarter, ie, during 13 consecutive weeks or 3 months, were averaged, and the quarterly means in each of the 20 calendar quarters were used in time-dependent analyses.
Dry Weight and BMI
Post-HD dry weight for each patient receiving HD during each calendar quarter is the mathematical average of up to 39 post-HD weight values (weight was measured 3 times weekly). At least 1 height value during the entire cohort was needed to calculate the averaged BMI in each calendar quarter.
Dialysis Vintage and Base Quarter
Dialysis vintage was defined as the duration of time between the first day of HD treatment and the first day that the patient entered the cohort. The first (baseline) study quarter for each patient was the calendar quarter in which the patient's vintage was greater than 45 days during at least half of that quarter.
The single-pool dialysis dose (Kt/V) was calculated using urea kinetic modeling (UKM) equations that are described elsewhere.20 The UKM equations used in DaVita laboratories to calculate Kt/V are more complex, and computational software programs are used.
Laboratory Measures
Blood samples were drawn at the start of the HD treatment (pre-HD) using uniform techniques in all of the DaVita dialysis clinics and transported, typically within 24 hours, to a single laboratory center, ie, the DaVita Laboratory in Deland, FL. All laboratory values were measured by automated and standardized methods. Most laboratory values were measured monthly, including levels of serum creatinine, urea, albumin, calcium, phosphorus, and bicarbonate, as well as total iron-binding capacity.21 Serum ferritin and intact parathyroid hormone levels were measured at least quarterly. Hemoglobin concentration was measured weekly to biweekly in most patients.
Serum Creatinine Validation Substudy
To verify the association between the serum creatinine concentration and LBM that was shown previously,15,16,22 we carried out a validation study within the NIED (Nutritional and Inflammatory Evaluation in Dialysis) study, in 747 randomly selected patients receiving HD at 8 DaVita dialysis clinics in the Los Angeles South Bay area. Near-infrared interactance and DEXA were used as the reference standard for LBM measurements (for more details on the creatinine validation substudy, see the eDocument and eTable in the Supporting Online Material [a link to which is provided at the end of this article], the NIED study Web site at http://www.NIEDstudy.org, and previous studies13,22-24).
Statistical Analyses
Survival analyses included time-dependent Cox proportional hazards regressions using quarterly averaged values. For each analysis, 3 levels of multivariate adjustment were examined:
Unadjusted model that included mortality as the outcome, surrogates of body mass or composition (ie, BMI or serum creatinine concentration), and entry calendar quarter (quarter 1 through quarter 20);
Case-mix–adjusted models that included all of the aforementioned plus age, sex, diabetes mellitus, dialysis vintage (<6 months, 6 months to <2 years, 2 to <5 years, and ≥5 years), primary insurance (Medicare, Medicaid, private, and other), marital status, dialysis dose as indicated by Kt/V (single pool),20 and residual renal function during the entry quarter (ie, urinary urea clearance);
Models adjusted for malnutrition-inflammation-cachexia syndrome, which included all of the covariates in the case-mix model as well as the 11 following surrogates of nutritional status and/or inflammation: blood or serum concentrations of albumin; total iron-binding capacity; levels of ferritin, phosphorus, calcium, or bicarbonate; peripheral white blood cell count; lymphocyte percentage; hemoglobin concentration; and the UKM-based estimate of daily protein intake, known as the normalized protein nitrogen appearance.18
Patients who underwent a transplant or left DaVita clinics were censored at the time of the event. In an attempt to mitigate the impact of the regression to the mean phenomena, all survival models that examined the “change” as a mortality predictor were also controlled for the baseline BMI or serum creatinine level. Missing covariate data (<1% for most laboratory and demographic variables) were imputed by the mean or median of the existing values. Analyses were carried out with SAS, version 9.1 (SAS Institute, Cary, NC).
RESULTS
The original 5-year (July 1, 2001, to June 30, 2006) national database of all DaVita patients receiving HD included 164,801 adult patients. After excluding patients who did not maintain at least 45 days of HD treatment or those who had missing core values, 121,762 HD patients remained with known age, dialysis vintage, averaged dry weight, and at least 1 height value (for details of the patient selection process, see eFigure 1 in Supporting Online Material). These patients had a median cohort time of 738 days. Table 1 shows the relevant demographic, clinical, and laboratory data of the study patients.
TABLE 1.
Characteristics of 121,762 Patients Undergoing Maintenance Hemodialysis in the Base Calendar Quartera,b,c
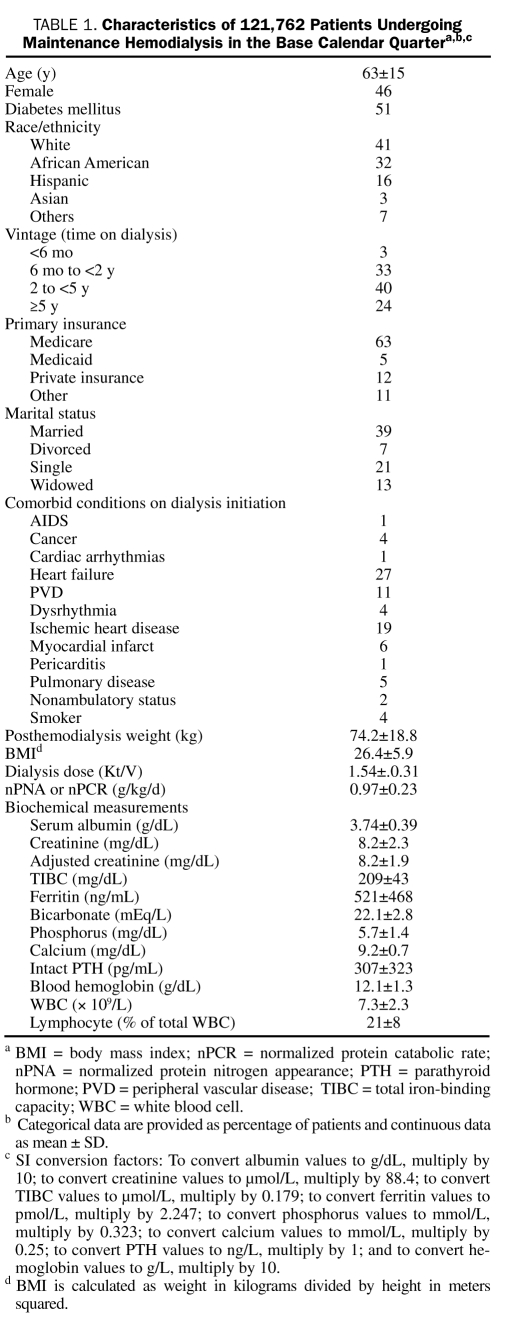
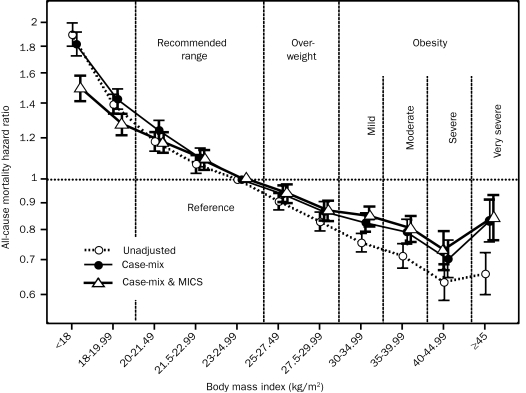
We divided the entire range of BMI into 11 preselected increments (<18, 18-19.99, 20-21.49, 21.5-22.99, 23-24.99 [reference], 25-27.49, 27.5-29.99, 30-34.99, 35-39.99, 40-44.99, and ≥45). As shown in Figure 1, survival analyses exhibited a graded and linear association between higher BMI increments (up to 45) and greater 5-year survival. In 57,247 patients receiving HD who survived through the first 2 calendar quarters of the cohort, all post-HD dry-weight values for the 6 consecutive months were available, enabling calculation of the change in dry weight over this period. Figure 2 shows that, compared with patients with stable weight (dry weight gain or loss of <1%), patients with a graded decline in dry weight had an increased risk of subsequent death, whereas higher weight gain over 6 months was incrementally associated with greater survival over a 5-year period. The association between weight change and mortality was consistent across different race, sex, and age subgroups of patients receiving HD (eFigure 2).
FIGURE 1.
Time-dependent associations between 3-month–averaged dry weight adjusted for height, known as body mass index (BMI), and 5-year (July 1, 2001, through June 30, 2006) mortality in 121,762 patients receiving hemodialysis (HD). Cox regression–based hazard ratios of death are represented by unfilled circles for the unadjusted model, filled circles for the model adjusted for case mix, and unfilled triangles for models adjusted for case mix and the malnutrition-inflammation-cachexia syndrome (MICS). Error bars represent 95% confidence intervals. Case-mix–adjusted models include adjustment for age, sex, diabetes mellitus, standardized mortality ratio, race, vintage, primary insurance, marital status, dialysis dose, dialysis catheter, and baseline comorbid states. The MICS model covariate includes all case-mix covariates plus urea kinetics–calculated protein catabolic rate (normalized protein nitrogen appearance or normalized protein catabolic rate), serum levels of albumin, total iron-binding capacity, white blood cell (WBC) count, percentage of lymphocytes, as well as calcium, phosphorous, bicarbonate, and ferritin levels.
FIGURE 2.
Change in dry weight during the first 6 months of the cohort as a predictor of mortality in 57,247 patients receiving hemodialysis (HD) who survived through the first 2 calendar quarters of the cohort and for whom post-HD dry-weight values for the 6 consecutive months were available. Compared with patients with stable weight (dry weight gain or loss of <1%), a graded decline in dry weight was associated with an increase in the subsequent risk of death, whereas weight gain over 6 months was incrementally associated with a greater 5-year survival rate. Cox regression–based hazard ratios of death are represented by unfilled circles for the unadjusted model, filled circles for the model adjusted for case mix, and unfilled triangles for models adjusted for case mix and the malnutrition-inflammation-cachexia syndrome (MICS). Error bars represent 95% confidence intervals. See legend of Figure 1 for the list of covariates in multivariate adjustment.
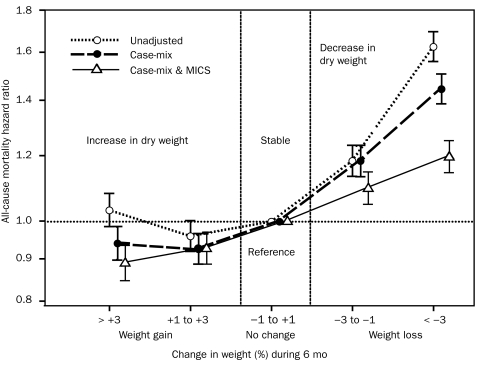
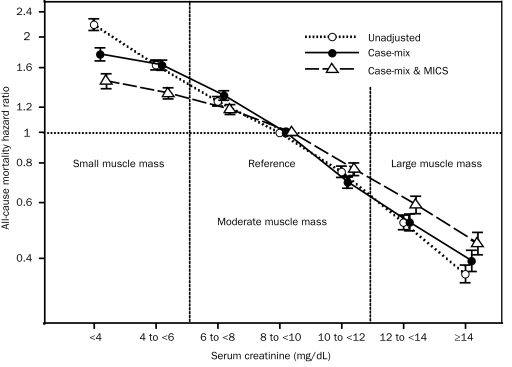
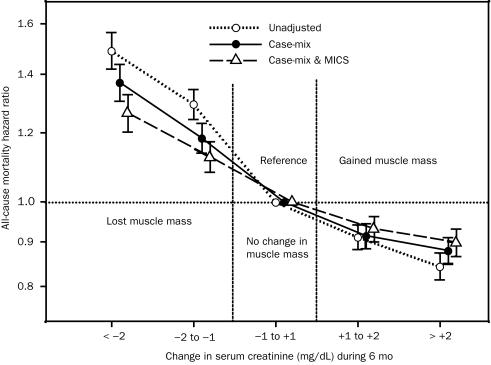
We used the 3-month–averaged pre-HD serum creatinine concentration as the surrogate of muscle mass after we validated its association with DEXA-measured LBM in a substudy of 117 randomly selected patients receiving HD (eFigure 3). As shown in Figure 3, among 107,082 patients receiving long-term HD for whom monthly measured pre-HD serum creatinine concentrations were available, higher levels were incrementally associated with greater survival. An increase or decrease in serum creatinine level during the first 6 months was associated with parallel changes in subsequent survival in the entire cohort (Figure 4) as well as across demographic subgroups (eFigure 4).
FIGURE 3.
Time-dependent associations between 3-month–averaged serum creatinine concentrations before hemodialysis, as a surrogate of muscle mass, and 5-year (July 1, 2001, through June 30, 2006) mortality in 107,082 patients receiving hemodialysis. Cox regression–based hazard ratios of death are represented by unfilled circles for the unadjusted model, filled circles for the model adjusted for case mix, and unfilled triangles for models adjusted for case mix and the malnutrition-inflammation-cachexia syndrome (MICS). Error bars represent 95% confidence intervals. See legend of Figure 1 for the list of covariates in multivariate adjustment.
FIGURE 4.
Change in serum creatinine concentration (a surrogate of change in muscle mass) during the first 6 months of the cohort as a predictor of mortality in 58,201 patients receiving hemodialysis (HD) who survived through the first 2 calendar quarters of the cohort and for whom pre-HD serum creatinine values for the 6 consecutive months were available. Compared with patients with stable serum creatinine concentrations (dry weight gain or loss of <1%), patients with a graded decline in dry weight had an increased risk of subsequent death, whereas weight gain during the 6 months was incrementally associated with greater 5-year survival. An increase or decrease in serum creatinine levels during the first 6 months was associated with parallel changes in subsequent survival in the entire cohort. Cox regression–based hazard ratios of death are represented by unfilled circles for the unadjusted model, filled circles for the model adjusted for case mix, and unfilled triangles for models adjusted for case mix and the malnutrition-inflammation-cachexia syndrome (MICS). Error bars represent 95% confidence intervals. See legend of Figure 1 for the list of covariates in multivariate adjustment.
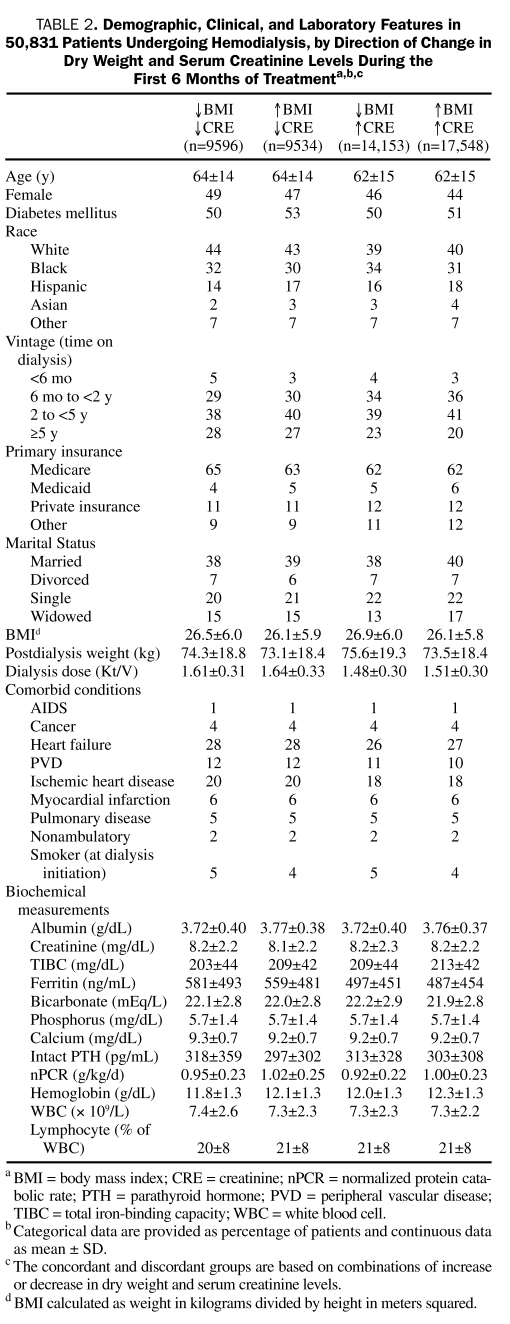
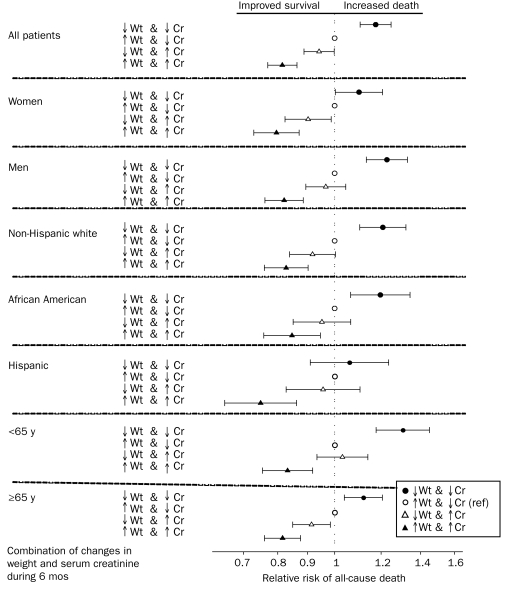
In 50,831 patients receiving HD, we examined how well different combinations of concurrent changes in dry weight and muscle mass (represented by changes in serum creatinine level) during the first 6 months predicted mortality. The demographic and clinical features of the 4 resultant groups can be found in Table 2. A concurrent decrease or increase in both dry weight and serum creatinine level was associated with worse and better survival, respectively. In contrast, among the discordant combinations, an increase in serum creatinine level with concurrent weight loss was associated with greater survival (fully adjusted death hazard ratio, 0.94; 95% confidence interval, 0.89-0.99) than the opposite discordant combination (decrease in serum creatinine level with weight gain [the reference group]). These associations were relatively consistent across subgroups of patients receiving HD (Figure 5). Sensitivity analyses, including using Kt/V-normalized serum creatinine levels, showed similar associations (data not shown).
TABLE 2.
Demographic, Clinical, and Laboratory Features in 50,831 Patients Undergoing Hemodialysis, by Direction of Change in Dry Weight and serum Creatinine Levels During the First 6 Months of Treatmenta,b,c
FIGURE 5.
A combination of changes in dry weight and serum creatinine level during the first 6 months of the cohort as a predictor of mortality in 50,831 patients receiving hemodialysis (HD) across different demographic subgroups. The discordant group of an increase in dry weight accompanied by a decrease in serum creatinine levels is the reference group in all analyses. Cox regression–based hazard ratios of death are represented by unfilled circles for the unadjusted model, filled circles for the model adjusted for case mix, and unfilled triangles for models adjusted for case mix and the malnutrition-inflammation-cachexia syndrome (MICS). Error bars represent 95% confidence intervals. See legend of Figure 1 for the list of covariates in multivariate adjustment. Cr = serum creatinine; ref = reference; Wt = weight.
DISCUSSION
In a contemporary cohort of 121,762 patients receiving HD 3 times weekly for up to 5 years in a single large dialysis organization, we found that higher BMI (up to 45) and a higher serum creatinine level, a likely surrogate of larger muscle mass, are each independently and incrementally associated with greater survival even after extensive multivariate adjustment for available surrogates of nutritional status and inflammation. Loss or gain in dry weight over time exhibited a graded association with greater mortality or survival, respectively, as did changes in serum creatinine level, a surrogate of changes in muscle mass. Changes in both of these body composition surrogates, if in the same direction, maintained the same graded death-predictability. However, for patients with discordant combinations, weight loss accompanied by a gain in muscle mass (as evidenced by a parallel increase in serum creatinine level) was associated with a greater survival benefit than weight gain with muscle loss (as evidenced by a parallel decrease in creatinine level). These associations were relatively robust and consistent across different demographic groups of patients receiving HD.
Patients with CKD have a high mortality rate, and the risk of death increases incrementally with worsening CKD stage.25 Although HD therapy is expected to be life-saving for these patients, about 1 of 5 US patients receiving HD dies each year, representing a 5-year survival of approximately 35%, which is worse than survival for most cancers.1 Among the strongest and most consistent epidemiological risk factors for death due to CKD are markers of poor nutritional status.26 Protein-energy wasting (PEW) is quite common in patients with CKD and appears to be related to the exceptionally high mortality rate in this patient population.27 Lower levels of serum albumin, prealbumin, or transferrin values, the likely PEW biomarkers, are associated with a high mortality rate in patients receiving HD.2,28 Accordingly, better nutritional status may confer survival benefits to patients with CKD.26 However, it remains unclear which type of nutritional store, in particular fat or muscle, is more protective and the extent to which a lower body mass is detrimental in patients with CKD.29 Our findings indicate that both lower BMI, a potential correlate of both smaller skeletal muscle and fat mass, and a lower serum creatinine level, a potential surrogate of smaller muscle mass in the setting of renal failure and stable dietary intake, are incrementally associated with an increased risk of death. Furthermore, the increased mortality rate associated with a decrease in these measures over time, which persisted despite extensive multivariate adjustments in our study, suggests a dose-response association. Hence, it is possible, although not yet proven, that nutritional interventions to correct PEW and sarcopenia improve survival.
We found a seemingly counterintuitive association between obesity (BMI up to 45) and greater survival, a finding that has been referred to as the obesity paradox30 or reverse epidemiology.31 In the United States, as in most industrialized nations, obesity is increasing. Many epidemiological studies in the general population have shown a graded association between obesity and increased risk of death, particularly as a result of an increased risk of the metabolic syndrome and cardiovascular disease. However, recent studies have indicated a shift to the right of the BMI range with the greatest survival,32,33 in that BMI in the 25 to 30 range rather than the 20 to 25 range is associated with the greatest survival. In some studies of healthy adults, a “J” curve has been observed in the association between BMI and death; ie, those with a low BMI also exhibit increased mortality, although not as high as those who are obese.34,35 In contrast to trends seen in the general population, higher BMI has generally not been associated with an increase in mortality rate in patients receiving HD.36-41 Johansen et al40 reported that body fat and muscle mass, surrogates of body size, were both associated with improved survival in obese patients receiving HD, whereas Beddhu et al42 showed that urinary creatinine level as a surrogate of muscle mass has a stronger association with survival than does body fat.39,43 Only a very few studies have failed to confirm the survival advantages of obesity in patients with CKD.44,45 However, these studies did not examine changes of weight over time and their relation to survival. The obesity paradox is not unique to dialysis populations. A risk factor reversal has also been reported in geriatric12 and hospitalized46 populations and in patients with chronic heart failure,10,47,48 coronary artery syndrome,5,49 malignancy,50 or AIDS.51 Hence, a better understanding of the phenomenon of reverse epidemiology in patients with CKD, especially as it pertains to differential body mass components, may help improve the poor outcome in this and other similar but distinct populations and disease states, which together represent more than 20 million Americans.43
Our findings suggest that, in patients receiving HD, a weight gain that is linked to a concurrent increase in muscle mass may be associated with an even greater survival benefit than a weight gain without it. Indeed, we found that losing weight while gaining more muscle mass confers a greater survival than losing both weight and muscle across most subgroups of patients receiving HD (Figure 5). Nevertheless, a concurrent increase in both dry weight and muscle mass was still associated with the greatest survival, whereas reducing any component of body mass, including even fat mass, was associated with increased mortality. Although BMI is often used as an indicator of nutritional status, it is not a good indicator of body composition because it does not differentiate skeletal muscle mass or body water from fat mass.52,53 The LBM can serve as an index of muscle mass and somatic protein storage, whereas fat mass more directly reflects energy storage. A prospective study in 535 patients receiving HD showed that lower body fat or a decline in body fat percentage over time was associated with an increased risk of death.54 In other studies, however, higher visceral fat was associated with an increased risk of death, whereas higher BMI retained its survival benefit.55 Two recent studies found survival advantages with both higher mid-arm muscle circumference, a surrogate of muscle mass, and greater triceps skin fold, a measure of fat.22,56 Hence, whereas higher BMI may be related to larger muscle mass, more body fat, or both, it may be argued that if fat is good, muscle is better.57
Despite the seemingly counterintuitive natures of the obesity paradox in the general population, conditions in certain populations may render them more resistant to poor outcomes if body weight is high. Several explanations have been suggested, including a more stable hemodynamic status in obese individuals, higher concentrations of tumor necrosis factor α receptors and/or adipokines in obesity that can oppose proinflammatory cytokines, neurohormonal stability of obesity, endotoxin-lipoprotein interaction, time discrepancies among competitive risk factors (overnutrition vs undernutrition), and the overwhelming effect of the malnutrition-inflammation complex on traditional cardiovascular risks.26 Because most patients receiving HD die within 5 years of commencing treatment with HD,58 the long-term effects of conventional risk factors on future mortality may be overshadowed by the short-term effects of PEW or malnutrition.
A limitation of our study is the lack of direct lean or muscle mass vs body fat measurements. We assume that muscle mass can be accurately estimated by serum creatinine concentration in patients receiving HD who do not have substantial urinary creatinine excretion, as we have shown in our substudy (eDocument and eTable). Creatinine, which is formed from creatine, is the end product of muscle catabolism, and almost 98% of the creatine pool is stored in muscle.59,60 Nevertheless, variation in residual renal function or recent intake of meats may substantially change serum creatinine levels independently of the patient's muscle mass.61-63 However, the effect of meat intake on circulating creatinine varies with day-to-day diet, and our use of 3-month averaged pre-HD serum creatinine concentrations will likely mitigate their association with diet. Another limitation is the lack of comprehensive data on comorbid conditions and changes in residual renal function over time. However, in patients receiving long-term HD, residual urine usually declines over time, so that an increase in serum creatinine concentration over time in the setting of a stable dialysis dose, if due to further loss in renal function, would be associated with worse outcomes and not greater survival as we have observed. The strengths of our study include its contemporary nature (all patient data were obtained from the 21st century [2001-2006]), uniform laboratory measurements (all laboratory data obtained from a single laboratory facility), large sample size, time-averaged post-HD dry weight and laboratory data (with most values representing means of up to 3 monthly measurements), and a broad temporal scope (studying a 5-year cohort).
CONCLUSION
In patients with CKD who require maintenance HD treatment to survive, larger body size or more muscle mass, represented by a higher BMI or a higher serum creatinine concentration, respectively, is associated with greater survival. A gain in dry weight accompanied by a parallel increase in muscle mass is associated with the greatest survival, whereas weight loss accompanied by a parallel loss in muscle mass bears the highest mortality. A discordant combination of muscle gain and weight loss appears to confer higher survival benefit than does weight gain accompanied by loss of muscle mass. These findings warrant additional studies and controlled trials in patients with CKD and other populations with chronic disease states and wasting syndrome.
Footnotes
Supporting Online Material
www.mayoclinicproceedings.com/content/85/11/991/suppl/DC1
eDocument
eTable
eFigures 1-4
REFERENCES
- 1.United States Renal Data System USRDS 2006 Annual Data Report: Atlas of End-Stage Renal Disease in the United States. In: National Institutes of Health NIoDaDaKD , ed. USRDS Annual Report. Bethesda, MD: NIH/NIDDK; 2008. http://www.usrds.org/atlas_2006.htm Accessed August 6, 2010 [Google Scholar]
- 2.Kovesdy CP, Kalantar-Zadeh K. Review article: biomarkers of clinical outcomes in advanced chronic kidney disease. Nephrology (Carlton). 2009;14(4):408-415 [DOI] [PMC free article] [PubMed] [Google Scholar]
- 3.Chertow GM, Hsu CY, Johansen KL. The enlarging body of evidence: obesity and chronic kidney disease. J Am Soc Nephrol. 2006;17:1501-1502 [DOI] [PubMed] [Google Scholar]
- 4.Lavie CJ, Milani RV, Ventura HO. Obesity and cardiovascular disease: risk factor, paradox, and impact of weight loss. J Am Coll Cardiol. 2009;53:1925-1932 [DOI] [PubMed] [Google Scholar]
- 5.Lavie CJ, Milani RV, Artham SM, Patel DA, Ventura HO. The obesity paradox, weight loss, and coronary disease. Am J Med. 2009;122:1106-1114 [DOI] [PubMed] [Google Scholar]
- 6.Kovesdy CP, Anderson JE, Kalantar-Zadeh K. Paradoxical association between body mass index and mortality in men with CKD not yet on dialysis. Am J Kidney Dis. 2007;49:581-591 [DOI] [PubMed] [Google Scholar]
- 7.Molnar MZ, Lukowsky LR, Streja E, et al. Blood pressure and survival in long-term hemodialysis patients with and without polycystic kidney disease. J Hypertens. doi: 10.1097/HJH.0b013e32833e4fd8. [Published online ahead of print, August 17, 2010] doi: 10.1097/HJH.0b013e32833e4fd8. [DOI] [PMC free article] [PubMed] [Google Scholar]
- 8.Kovesdy CP, Anderson JE, Kalantar-Zadeh K. Inverse association between lipid levels and mortality in men with chronic kidney disease who are not yet on dialysis: effects of case mix and the malnutrition-inflammation-cachexia syndrome. J Am Soc Nephrol. 2007;18:304-311 [DOI] [PubMed] [Google Scholar]
- 9.Kalantar-Zadeh K, Block G, Humphreys MH, McAllister CJ, Kopple JD. A low, rather than a high, total plasma homocysteine is an indicator of poor outcome in hemodialysis patients. J Am Soc Nephrol. 2004;15:442-453 [DOI] [PubMed] [Google Scholar]
- 10.Oreopoulos A, Padwal R, Kalantar-Zadeh K, Fonarow GC, Norris CM, McAlister FA. Body mass index and mortality in heart failure: a meta-analysis. Am Heart J. 2008;156:13-22 [DOI] [PubMed] [Google Scholar]
- 11.Oreopoulos A, Padwal R, Norris CM, Mullen JC, Pretorius V, Kalantar-Zadeh K. Effect of obesity on short- and long-term mortality postcoronary revascularization: a meta-analysis. Obesity (Silver Spring). 2008;16:442-450 [DOI] [PubMed] [Google Scholar]
- 12.Oreopoulos A, Kalantar-Zadeh K, Sharma AM, Fonarow GC. The obesity paradox in the elderly: potential mechanisms and clinical implications. Clin Geriatr Med. 2009;25:643-659 [DOI] [PubMed] [Google Scholar]
- 13.Bross R, Chandramohan G, Kovesdy CP, et al. Comparing body composition assessment tests in long-term hemodialysis patients. Am J Kidney Dis. 2010;55:885-896 [DOI] [PMC free article] [PubMed] [Google Scholar]
- 14.Beddhu S, Samore MH, Roberts MS, Stoddard GJ, Pappas LM, Cheung AK. Creatinine production, nutrition, and glomerular filtration rate estimation. J Am Soc Nephrol. 2003;14:1000-1005 [DOI] [PubMed] [Google Scholar]
- 15.Keshaviah PR, Nolph KD, Moore HL, et al. Lean body mass estimation by creatinine kinetics. J Am Soc Nephrol. 1994;4:1475-1485 [DOI] [PubMed] [Google Scholar]
- 16.Schutte JE, Longhurst JC, Gaffney FA, Bastian BC, Blomqvist CG. Total plasma creatinine: an accurate measure of total striated muscle mass. J Appl Physiol. 1981;51:762-766 [DOI] [PubMed] [Google Scholar]
- 17.Kalantar-Zadeh K, Regidor DL, Kovesdy CP, et al. Fluid retention is associated with cardiovascular mortality in patients undergoing long-term hemodialysis. Circulation. 2009;119:671-679 [DOI] [PMC free article] [PubMed] [Google Scholar]
- 18.Shinaberger CS, Greenland S, Kopple JD, et al. Is controlling phosphorus by decreasing dietary protein intake beneficial or harmful in persons with chronic kidney disease? Am J Clin Nutr. 2008;88:1511-1518 [DOI] [PMC free article] [PubMed] [Google Scholar]
- 19.Shinaberger CS, Kopple JD, Kovesdy CP, et al. Ratio of paricalcitol dosage to serum parathyroid hormone level and survival in maintenance hemodialysis patients. Clin J Am Soc Nephrol. 2008;3:1769-1776 [DOI] [PMC free article] [PubMed] [Google Scholar]
- 20.Miller JE, Kovesdy CP, Nissenson AR, et al. Association of hemodialysis treatment time and dose with mortality and the role of race and sex. Am J Kidney Dis. 2010;55:100-112 [DOI] [PMC free article] [PubMed] [Google Scholar]
- 21.Bross R, Zitterkoph J, Pithia J, et al. Association of serum total iron-binding capacity and its changes over time with nutritional and clinical outcomes in hemodialysis patients. Am J Nephrol. 2009;29:571-581 [DOI] [PMC free article] [PubMed] [Google Scholar]
- 22.Noori N, Kopple JD, Kovesdy CP, et al. Mid-arm muscle circumference and quality of life and survival in maintenance hemodialysis patients. [Published online ahead of print, October 14, 2010]Clin J Am Soc Nephrol. doi: 10.2215/CJN.02080310 [DOI] [PMC free article] [PubMed] [Google Scholar]
- 23.Colman S, Bross R, Benner D, et al. The nutritional and inflammatory evaluation in dialysis patients (NIED) study: overview of the NIED study and the role of dietitians. J Ren Nutr. 2005;15:231-243 [DOI] [PubMed] [Google Scholar]
- 24.Park JC, Kovesdy CP, Duong U, et al. Association of serum alkaline phosphatase and bone mineral density in maintenance hemodialysis patients. Hemodial Int. 2010;14:182-192 [DOI] [PMC free article] [PubMed] [Google Scholar]
- 25.Kovesdy CP, Trivedi BK, Anderson JE. Association of kidney function with mortality in patients with chronic kidney disease not yet on dialysis: a historical prospective cohort study. Adv Chronic Kidney Dis. 2006;13:183-188 [DOI] [PubMed] [Google Scholar]
- 26.Kovesdy CP, Kalantar-Zadeh K. Why is protein-energy wasting associated with mortality in chronic kidney disease? Semin Nephrol. 2009;29:3-14 [DOI] [PMC free article] [PubMed] [Google Scholar]
- 27.Fouque D, Kalantar-Zadeh K, Kopple J, et al. A proposed nomenclature and diagnostic criteria for protein-energy wasting in acute and chronic kidney disease. Kidney Int. 2008;73(4):391-398 [DOI] [PubMed] [Google Scholar]
- 28.Rambod M, Kovesdy CP, Bross R, Kopple JD, Kalantar-Zadeh K. Association of serum prealbumin and its changes over time with clinical outcomes and survival in patients receiving hemodialysis. Am J Clin Nutr. 2008;88:1485-1494 [DOI] [PMC free article] [PubMed] [Google Scholar]
- 29.Ikizler TA. Resolved: being fat is good for dialysis patients: the Godzilla effect: pro. J Am Soc Nephrol. 2008;19:1059-1062 [DOI] [PubMed] [Google Scholar]
- 30.Lavie CJ, Milani RV, Ventura HO, Romero-Corral A. Body composition and heart failure prevalence and prognosis: getting to the fat of the matter in the “obesity paradox”. Mayo Clin Proc. 2010;85:605-608 [DOI] [PMC free article] [PubMed] [Google Scholar]
- 31.Kalantar-Zadeh K, Block G, Humphreys MH, Kopple JD. Reverse epidemiology of cardiovascular risk factors in maintenance dialysis patients. Kidney Int. 2003;63:793-808 [DOI] [PubMed] [Google Scholar]
- 32.Mark DH. Deaths attributable to obesity[editorial]. JAMA. 2005;293:1918-1919 [DOI] [PubMed] [Google Scholar]
- 33.Flegal KM, Graubard BI, Williamson DF, Gail MH. Excess deaths associated with underweight, overweight, and obesity. JAMA. 2005;293:1861-1867 [DOI] [PubMed] [Google Scholar]
- 34.Manson JE, Willett WC, Stampfer MJ, et al. Body weight and mortality among women. N Engl J Med. 1995;333:677-685 [DOI] [PubMed] [Google Scholar]
- 35.Kushner RF. Body weight and mortality. Nutr Rev. 1993;51:127-136 [DOI] [PubMed] [Google Scholar]
- 36.Degoulet P, Legrain M, Reach I, et al. Mortality risk factors in patients treated by chronic hemodialysis: report of the Diaphane collaborative study. Nephron. 1982;31:103-110 [DOI] [PubMed] [Google Scholar]
- 37.Fleischmann E, Teal N, Dudley J, May W, Bower JD, Salahudeen AK. Influence of excess weight on mortality and hospital stay in 1346 hemodialysis patients. Kidney Int. 1999;55:1560-1567 [DOI] [PubMed] [Google Scholar]
- 38.Abbott KC, Glanton CW, Trespalacios FC, et al. Body mass index, dialysis modality, and survival: analysis of the United States Renal Data System Dialysis Morbidity and Mortality Wave II Study. Kidney Int. 2004;65:597-605 [DOI] [PubMed] [Google Scholar]
- 39.Kalantar-Zadeh K, Abbott KC, Salahudeen AK, Kilpatrick RD, Horwich TB. Survival advantages of obesity in dialysis patients. Am J Clin Nutr. 2005;81:543-554 [DOI] [PubMed] [Google Scholar]
- 40.Johansen KL, Young B, Kaysen GA, Chertow GM. Association of body size with outcomes among patients beginning dialysis. Am J Clin Nutr. 2004;80:324-332 [DOI] [PubMed] [Google Scholar]
- 41.Chazot C, Gassia JP, Di Benedetto A, Cesare S, Ponce P, Marcelli D. Is there any survival advantage of obesity in Southern European haemodialysis patients? Nephrol Dial Transplant. 2009;24:2871-2876 [DOI] [PubMed] [Google Scholar]
- 42.Beddhu S, Pappas LM, Ramkumar N, Samore M. Effects of body size and body composition on survival in hemodialysis patients. J Am Soc Nephrol. 2003;14:2366-2372 [DOI] [PubMed] [Google Scholar]
- 43.Kalantar-Zadeh K, Kilpatrick RD, Kuwae N, Wu DY. Reverse epidemiology: a spurious hypothesis or a hardcore reality? Blood Purif. 2005;23:57-63 [DOI] [PubMed] [Google Scholar]
- 44.Kaizu Y, Tsunega Y, Yoneyama T, et al. Overweight as another nutritional risk factor for the long-term survival of non-diabetic hemodialysis patients. Clin Nephrol. 1998;50:44-50 [PubMed] [Google Scholar]
- 45.Kutner NG, Zhang R. Body mass index as a predictor of continued survival in older chronic dialysis patients. Int Urol Nephrol. 2001;32:441-448 [DOI] [PubMed] [Google Scholar]
- 46.Landi F, Onder G, Gambassi G, Pedone C, Carbonin P, Bernabei R. Body mass index and mortality among hospitalized patients. Arch Intern Med. 2000;160:2641-2644 [DOI] [PubMed] [Google Scholar]
- 47.Kalantar-Zadeh K, Block G, Horwich T, Fonarow GC. Reverse epidemiology of conventional cardiovascular risk factors in patients with chronic heart failure. J Am Coll Cardiol. 2004;43:1439-1444 [DOI] [PubMed] [Google Scholar]
- 48.Lavie CJ, Milani RV, Ventura HO. Untangling the heavy cardiovascular burden of obesity. Nat Clin Pract Cardiovasc Med. 2008;5:428-429 [DOI] [PubMed] [Google Scholar]
- 49.Oreopoulos A, McAlister FA, Kalantar-Zadeh K, et al. The relationship between body mass index, treatment, and mortality in patients with established coronary artery disease: a report from APPROACH. Eur Heart J. 2009;30:2584-2592 [DOI] [PMC free article] [PubMed] [Google Scholar]
- 50.Yeh S, Wu SY, Levine DM, et al. Quality of life and stimulation of weight gain after treatment with megestrol acetate: correlation between cytokine levels and nutritional status, appetite in geriatric patients with wasting syndrome. J Nutr Health Aging. 2000;4:246-251 [PubMed] [Google Scholar]
- 51.Chlebowski RT, Grosvenor M, Lillington L, Sayre J, Beall G. Dietary intake and counseling, weight maintenance, and the course of HIV infection. J Am Diet Assoc. 1995;95(4):428-432 [DOI] [PubMed] [Google Scholar]
- 52.Sarkar SR, Kuhlmann MK, Kotanko P, et al. Metabolic consequences of body size and body composition in hemodialysis patients. Kidney Int. 2006;70:1832-1839 [DOI] [PubMed] [Google Scholar]
- 53.Oreopoulos A, Ezekowitz JA, McAlister FA, et al. Association between direct measures of body composition and prognostic factors in chronic heart failure. Mayo Clin Proc. 2010;85:609-617 [DOI] [PMC free article] [PubMed] [Google Scholar]
- 54.Kalantar-Zadeh K, Kuwae N, Wu DY, et al. Associations of body fat and its changes over time with quality of life and prospective mortality in hemodialysis patients. Am J Clin Nutr. 2006;83:202-210 [DOI] [PubMed] [Google Scholar]
- 55.Postorino M, Marino C, Tripepi G, Zoccali C. Abdominal obesity and all-cause and cardiovascular mortality in end-stage renal disease. J Am Coll Cardiol. 2009;53:1265-1272 [DOI] [PubMed] [Google Scholar]
- 56.Huang CX, Tighiouart H, Beddhu S, et al. Both low muscle mass and low fat are associated with higher all-cause mortality in hemodialysis patients. Kidney Int. 2010;77:624-629 [DOI] [PMC free article] [PubMed] [Google Scholar]
- 57.Beddhu S. If fat is good, muscle is better [letter]. Am J Kidney Dis. 2006;47:193. [DOI] [PubMed] [Google Scholar]
- 58.Foley RN, Parfrey PS, Sarnak MJ. Clinical epidemiology of cardiovascular disease in chronic renal disease. Am J Kidney Dis. 1998;32(5 suppl):S112-S119 [DOI] [PubMed] [Google Scholar]
- 59.Flugel-Link RM, Salusky IB, Jones MR, Kopple JD. Enhanced muscle protein degradation and amino acid release from the hemicorpus of acutely uremic rats. Adv Exp Med Biol. 1984;167:545-555 [DOI] [PubMed] [Google Scholar]
- 60.Andrews R, Greenhaff P, Curtis S, Perry A, Cowley AJ. The effect of dietary creatine supplementation on skeletal muscle metabolism in congestive heart failure. Eur Heart J. 1998;19:617-622 [DOI] [PubMed] [Google Scholar]
- 61.Walser M. Creatinine excretion as a measure of protein nutrition in adults of varying age. JPEN J Parenter Enteral Nutr. 1987;11:73S-78S [DOI] [PubMed] [Google Scholar]
- 62.Kopple JD, Greene T, Chumlea WC, et al. Relationship between nutritional status and the glomerular filtration rate: results from the MDRD study. Kidney Int. 2000;57:1688-1703 [DOI] [PubMed] [Google Scholar]
- 63.Jacobsen FK, Christensen CK, Mogensen CE, Andreasen F, Heilskov NS. Postprandial serum creatinine increase in normal subjects after eating cooked meat. Proc Eur Dial Transplant Assoc. 1979;16:506-512 [PubMed] [Google Scholar]


