

Abstract
Despite improvements in outcomes for human islet transplantation, characterization of islet preparations remains poorly defined. This study used both light (LM) and electron microscopy (EM) to characterize 33 islet preparations used for clinical transplants. EM allowed accurate identification and quantification of cell types with measured cell number fractions (mean ± SEM) 35.6 ± 2.1% β-cells, 12.6 ± 1.0% non-β-islet cells, (48.3 ± 2.6% total islet cells), 22.7 ± 1.5% duct cells, and 25.3 ± 1.8% acinar cells. Of the islet cells, 73.6 ± 1.7% were β cells. For comparison to the literature, estimates of cell number fraction, cell volume, and extracellular volume were combined to convert number fraction data to volume fractions applicable to cells, islets, and the entire preparation. The mathematical framework for this conversion was developed. By volume, β cells were 86.5 ± 1.1% of the total islet cell volume and 61.2 ± 0.8% of intact islets (including the extracellular volume), which is similar to that of islets in the pancreas. Our estimates gave 1560 ± 20 cells in an islet equivalent (volume of 150-μm diameter sphere), of which 1140 ± 15 were β cells. To test if LM analysis of the same tissue samples could provide reasonable estimates of purity of the islet preparations, volume fraction islet tissue was measured on thin sections available from 27 of the clinical preparations by point counting morphometrics. Islet purity (islet volume fraction) of individual preparations determined by LM and EM analysis correlated linearly with excellent agreement (R2 = 0.95). However, islet purity by conventional dithizone staining was substantially higher with a 20-30% overestimation. Thus, both EM and LM provide accurate methods to determine the cell composition of human islets preparations and can help us understand many of the discrepancies of islet composition in the literature.
Keywords: beta cells, cell composition, electron microscopy, light microscopy, human islet preparations, islet purity
In spite of important recent progress with islet transplantation in the past decade, recipients typically lose islet function over months to a few years (1, 2). There are still many questions about the exact characteristics of the islet preparations that are transplanted, including critical parameters such as β cell mass and viability. Isolation of human islets has always presented a challenge, in part because, unlike other species from which islets can be isolated with little contamination by other pancreatic cells, human islet preparations typically consist of approximately 50% non-islet elements, mainly acinar and duct cells (3-6).
The correlation of clinical outcome to characteristics of human islet preparations would benefit by having accurate measurements of cell composition and islet volume fraction (purity) of the transplanted material. Cell composition of human islets within the pancreas has been examined in a number of studies (7-15). Measurements have been made with isolated islets that were cultured under conditions favoring β cell enrichment (5), shipped (16), or following dissociation into single cells (3, 17) with inconsistent results. No measurements with freshly isolated islets have been reported. The volume fraction of islets is routinely measured by staining with dithizone (diphenylthiocarbazone, DTZ) and examining by light microscopy (LM) (18) to visually estimate the volume fraction of tissue stained red. The method is operator dependent and usually overestimates islet purity (3). There is a need for development and standardization of assays to facilitate quantitative data analysis of cell composition and islet purity and to permit comparison of results from multiple transplant centers.
In the present study, we used morphological analysis with electron microscopy (EM) of islet preparations and found it to be a valuable tool for assessing the cellular composition of clinical islet preparations. These data, together with estimates of cell size and extracellular volume, provided a means to calculate the islet volume fraction in the preparation. We also verified that LM assessment of volume fraction of islets by stereological point counting on 1μm sections agreed with the more rigorous and labor intensive assessment by EM. Thus, islet purity can be estimated accurately by LM and, with further refinement, may be possible within hours of isolation using frozen sections. These methods should be useful in the development of the much-needed standardized characterization of islets prior to transplantation.
Materials and Methods
Islet isolation method
Cadaver pancreases were obtained from brain-dead donors by the New England Organ Bank after obtaining informed consent from donor relatives. Donor characteristics are described in Table 1. Islets obtained from the 33 pancreases were used for clinical transplants. Pancreases were preserved with University of Wisconsin solution (Barr Pharmaceuticals, Pomona, NY, USA); five were preserved using the two-layer perfluorocarbon (PFC) method (19). Only pancreases with cold ischemia times 12 hr or less (without PFC) or less than 18 hr with PFC preservation were processed for transplantation. Islets were isolated by the Islet Resource Center at Joslin Diabetes Center using the standard collagenase/protease digestion method (20, 21). The pancreatic duct was cannulated and distended with 4°C collagenase/protease solution using Liberase™ HI (Roche Diagnostics, Indianapolis, IN, USA) (22). Islets were separated from exocrine tissue using continuous density gradient centrifugation in a COBE 2991 cell processor (Gambro BCT, Lakewood, CO, USA). Islet purity in each fraction was estimated with representative aliquots stained with DTZ, and the packed cell volume of each fraction was determined. Fractions containing islets with a total packed cell volume of less than 5 ml were combined and resuspended in final wash medium (CMRL, Mediatech, Herndon, VA, USA) to a total volume of 255 ml in a 250 ml tube. The tube was centrifuged (Model RC 3C Plus, Sorvall, Ashville, NC, USA) at 920 rpm (248 ×g) for 1 min at 4°C. Supernatant medium was aspirated carefully to the pellet surface. A 9.0 ml volume of final wash medium was added to the pellet, which was resuspended by mixing without inclusion of bubbles and then carefully aspirated into a 10 ml pipette (Fisher Scientific, Pittsburgh, PA, USA). The packed cell volume was determined as the difference between the final volume in the pipette minus 9.0 ml. The mixture in the pipette was returned to a 250 ml tube, brought to 255 ml with final wash medium, and the cellular aggregates were kept in suspension by repeated inversion of the tube. Aliquots were taken for vital staining, DNA content, membrane integrity, purity and islet enumeration by dithizone staining, and morphological analysis.
Table 1.
Donor characteristics and processing data from 33 clinical islet preparations. For some parameters, data from only 32 preparations are presented, as noted.
| Characteristic | Mean±SEM | Range | N |
|---|---|---|---|
| Donor age | 51.5 ± 1.5 | 31-67 | |
| Donor BMI | 28.7 ± 1.0 | 21.4 - 47.6 | |
| Duration acute Illness (hr) | 37.6 ± 5.9 | 1-129 | |
| Duration brain death (hr) | 15.7 ± 1.1 | 0.7-27 | |
| Cold ischemia time (hr) | 7.5 ± 0.5 | 4-16.3 | |
| Pancreatic weight (g) | 85.5 ± 3.8 | 45-144 | |
| Digestion time (min) | 19.6 ± 0.7 | 12-28 | |
| Undigested tissue remaining (g) | 25.2 ± 2.6 | 2-65 | 32 |
| Packed cell volume (ml) | |||
| Total tissue recovered in all fractions | 42.7 ± 2.5 | 18-92 | |
| Final islet pellet | 1.81 ± 0.19 | 0.60-5.0 | |
| Fraction of islets with impermeable membranes (% PI negative) | 90 ± 1 | 80-95 | 32 |
| Islet equivalents by | 3.27 ± 1.55 × 10⁵ | (2.43 – 8.14) × 105 | |
| DTZ staining (NIE)DTZ |
Morphological analysis
A 0.5 ml aliquot from the final islet preparation was fixed in 2.5% glutaraldehyde in 0.1 M phosphate buffer, pH 7.4, osmicated, divided into two samples, and embedded in plastic (Araldite) in the Joslin Advanced Microscopy Core. Thin (1 μm) sections were stained with toluidine blue for initial evaluation of purity and quality of islets. Secretory granules of islet endocrine cells were too small to be seen with LM, but the zymogen granules of acinar cells were very evident (Figure 1), which allowed acinar contamination to be easily identified. Ultrathin sections to be taken to EM were cut from the same blocks. Sixteen micrographs per sample were taken systematically to cover the section, using 1900× magnification to give a total of 32 micrographs per islet preparation. A magnification of 1900× provided adequate sampling with a minimum of 500 cells; with photographic printing (final magnification 4375×), the granule morphology of the cells could be distinguished on the micrographs. Cell boundaries on each micrograph were determined to indicate the number of cells; then each cell was assigned to a category of β, non-β endocrine, acinar, or ductal cells. Acinar cells, islet cells (β, and the non- β cells α, δ and PP), and duct cells could be definitively identified, and thus, cell composition determined (Figure 2). Occasional dead cells or endothelial cells were also identified and characterized as “other”. The resulting cell composition was based on number, not volume, of cells counted from both samples and yielded the number fraction of each category. Islet volume fraction measurements by LM were made retrospectively on thin sections that were available for 27 of the 33 freshly isolated clinical preparations.
Figure 1.
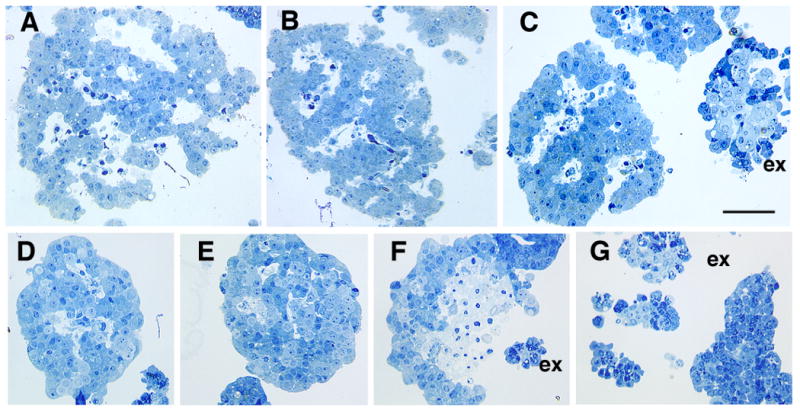
Identification of islet and non-islet tissue by light microscopy with plastic sections. Freshly isolated islet tissue is characterized by its cordlike pattern around vascular spaces (white areas) (A-C). These spaces partially collapse within 24 hr of culture at 37°C (D-G). Initially the vascular spaces of fresh human islets comprise about 14% of the islet volume (Pisania et al, submitted). Acinar cells (C, F,G) are distinguishable from the islets by their large zymogen granules (dark blue); the small terminal ducts (homogenous light blue) are seen surrounded by the acinar cells in these exocrine (ex) clumps (C,F,H). The exocrine clumps are initially compact (C) and do not show volume change with 24 hrs culture (G). Panel F shows necrosis of islet even after 24 hrs in culture. Toluidine blue stained one μm plastic sections of purified human islet preparations. Magnification bar = 50 μm.
Figure 2.

Electron micrographs of pellets of purified islet preparations showing characteristics of the different cell types. (A) β-cells can be definitively identified by electron dense granules, often with crystals, with space between the granule limiting membrane and the hormone giving a typical “halo.” (B) Non-β-cells have granules without halos: the glucagon producing α-cells have homogenous electron dense granules; the somatostatin producing δ-cells are less homogeneous in density of the granules. (C) For the exocrine tissue, the acinar cells contain large dense zymogen granules and large amount of stacked ER whereas the ductal cells contain few organelles, inclusions or granules.
Cell number fraction by EM
Cell composition of an islet preparation was determined by counting the different cell types on the electron micrographs. The number fraction of each cell type was calculated by dividing the number of each cell type by the total number of cells counted. In addition, the number fraction of all cells that were islet (β and non-β) cells and the number fraction of islet cells that were β cells were also calculated (see Equations (1-6, 19) of the Appendix).
Islet purity in a preparation determined by three methods
Volume fraction islets determined using cell number fraction, cell volume, and extracellular volume fraction
Number fraction data was converted to a volume fraction basis in order to compare with data from other techniques and from the literature. The first step was conversion to cell volume fraction (based on the total volume of all cells) for each cell type and for islet and non-islet cells, as well as to the β cell volume fraction based on the total volume of islet cells (see Equations (7-20) of the Appendix). Equation (18) is the key relation for converting between islet cell number fraction and islet cell volume fraction. Estimates of volume per cell used in the calculations are given in Table 2. The second step was calculation of volume fractions based on total tissue volume, including extracellular space (see Equations (21-34) of the Appendix). It is important to appreciate that the volume fraction of islet tissue (i.e., the purity of the preparation) includes consideration of the extracellular spaces, while the islet cell volume fraction does not. Equations (32), (34), and (35) are given in the Appendix for calculating the volume fraction of islet tissue occupied by β cells and the numbers of all cells and β cells in an islet equivalent (IE, the volume of a sphere with a diameter of 150 μm).
Table 2.
Estimated Volume (μm) of Pancreatic Cells
| Symbol | Native Pancreas | Freshly Isolated | |
|---|---|---|---|
| Islet | |||
| Beta | νβ | 1,000 | 950 |
| Non-Beta (Mainly α) | νNβ | 400 | 400 |
| Non-Islet | |||
| Acinar | νA | 1,550 | 1,200 |
| Duct | vD | 200 | 200 |
| Other | vO | 200 | 200 |
Islet volume fraction by LM
The 1-μm sections were analyzed at 420× by stereological point counting (23) with a 90-point grid covering adjacent, non-overlapping fields. The tissue type was determined (Figure 1) at each intercept point over tissue. Freshly isolated islets had large dilated vascular spaces, and two approaches were explored to take this into account: (1) vascular space was included in the islet domain, or (2) vascular space was analyzed separately (see Equations (37-40) in Appendix). The second method was used because it was more reproducible. We counted a total of 500-800 points on one section for each preparation, which yielded a predicted standard error equal to 3-5% of the mean for preparations of about 50% islet purity (23).
Islet volume fraction estimated with dithizone (DTZ) staining
DTZ (Sigma-Aldrich, St. Louis, MO, USA) was used to discriminate islet from non-islet tissue by staining islet cells (18). DTZ was dissolved in dimethylsulfoxide (ICN Biomedicals Inc., Costa Mesa, CA, USA) as a 10× stock solution (2.5 mg/ml) and diluted with Hanks balanced salt solution (Mediatech) for the 1× working solution. An aliquot of 250 μl from the final islet preparation was transferred to a 60-mm diameter Petri dish containing 3 ml of DTZ working solution and incubated with gentle swirling for 3 min. All tissue was examined with LM, and the volume fraction of red-stained islet tissue was visually estimated.
Islet enumeration by conventional counting with DTZ staining
Two representative aliquots of 100 μl each from the final islet preparation were incubated with DTZ working solution as described for volume fraction determination by DTZ staining. Using a light microscope with a Bausch and Lomb micrometer disc (31-16-08) eyepiece reticle containing a grid of squares 50 μm on a side, the number of squares and the area occupied by each stained islet was determined, and the diameter of a circle having about the same surface area was estimated for each islet. The size distribution of the islets was quantified by two independent observers in 50 μm increments (ranges: 50-100, 100-150, 150-200, 200-250, 250-300, 300-350, and > 350 μm). A formula was used to convert the number of islets in each 50 μm increment to a total islet volume by assuming that the islets are spherical (24). The number of IE was calculated as the total islet volume divided by the volume of an IE (1.77 × 106 μm3).
Islet vital staining
A fluorescent dye inclusion/exclusion assay was used to assess membrane integrity. A 250 μl aliquot from the 255-ml islet preparation was resuspended in 5 ml of PBS solution in a 60-mm Petri dish, and 10 μl of a solution containing 9.9 mg/ml fluorescein diacetate and 0.5 mg/ml propidium iodide was added. Tissue was examined immediately. The volume fraction of cells containing nuclei stained red was visually estimated with LM by focusing through the tissue.
Statistics
Data are reported as mean ± SEM. Correlations were made with the Pearson product moment correlation coefficient. Statistical significance was assessed with the two-tailed Student t test.
Results
Determination of cell composition and number fraction by EM
Different cell types within a preparation were definitively identified by their known ultrastructural characteristics (Figure 2). β cells had distinctive granules with an electron dense core containing insulin crystals surrounded by a lighter halo. Additionally, human β cells had characteristic lipid inclusions (25). The non-β cells (α, δ, and PP) in islets had more homogenous granules without the crystalline structure and without the halos of β cells. Although these three non-β islet cells could be distinguished from one another by granule morphology, they were classified together as non-β islet cells for quantitation purposes. Acinar cells had easily identifiable large electron dense zymogen granules and stacks of endoplasmic reticulum. Duct cells were identified by their smaller size, shape, reduced ER and lack of granules. In addition to these cell types, there were small numbers of endothelial cells, stromal cells, leukocytes, dead cells and neuronal elements that together made up less than 5% of the total cell population in these preparations; these are considered as “other”. When cell composition was based on number, rather than volume of cells, the number fraction of each cell type was the number of cells of a given type divided by the total number of cells (Table 3). The fraction of all islet cells that were β cells (Equation (19)) was 73.6 ± 1.7 % with most of the values being close to this number; the coefficient of variation was only 0.13. There was, however, a surprisingly low value of 41.0 % (the only sample that contained significant islet amyloid, suggestive of a type 2 diabetic donor), which was an outlier; the next lowest value was 53.3 %.
Table 3.
Number fraction of cell types in 33 islet preparations determined by EM.
| Cell Category | Definition* | Mean ± SEM | Range | COV |
|---|---|---|---|---|
| Total Islet (fIC) | nIC/nTC | 0.483 ± 0.026 | 0.126 – 0.853 | 0.31 |
| Beta (fβ) | nβ/nTC | 0.356 ± 0.021 | 0.131 – 0.637 | 0.35 |
| Non-Beta (fNβ) | nNβ/nTC | 0.126 ± 0.10 | 0.036 – 0.269 | 0.44 |
| Beta Cells in Islets (fβIC) | nβ/nIC | 0.736 ± 0.017 | 0.410 – 0.839 | 0.13 |
| Total Non-Islet (fNIC) | nNIC/nTC | 0.517 ± 0.026 | 0.026 – 0.833 | 0.29 |
| Acinar (fA) | nA/nTC | 0.253 ± 0.018 | 0.054 – 0.416 | 0.40 |
| Duct (fD) | nD/nTC | 0.227 ± 0.015 | 0.016 – 0.384 | 0.37 |
| Other (fO) | nO/nTC | 0.038 ± 0.004 | 0.004 – 0.118 | 0.64 |
All symbols in tables defined in the Appendix.
Cell volume fraction determination
The cell number fraction data determined by EM (Table 3) and estimates of the volume of each cell type were used with Equations (7-9) and (13-15) of the Appendix to obtain the average cell volume for islet and non-islet cells and for the total of all cells. Over all preparations, the average volume was 805 ± 9 and 679 ± 19 μm3 for islet and non-islet cells, respectively (Table 4). The latter value reflects the mixture of large acinar cells and much smaller duct cells amongst the non-islet cells. The ratio of the average cell volume for islet cells divided by the average cell volume for all of the cells averaged 1.09 ± 0.01. These values and islet cell number fraction data, together with Equations (10-12) and (16-20) of the Appendix, were used to estimate cell volume fractions. The volume fraction of islet cells amongst all cells was 0.522 ± 0.029. Because β cells are larger than islet non-β cells, it is not surprising that the volume fraction of β cells in islet cells was larger, 0.865 ± 0.011 (Table 4), than the number fraction, 0.736 ± 0.017 (Table 3).
Table 4.
Volume fraction of cell types in 33 islet preparations determined by EM and the theoretical number of cells in an islet equivalent (IE).*
| Parameter | Definition | Mean ± SEM | Range | COV |
|---|---|---|---|---|
| Average Cell Volume (μm3) | ||||
| Islet (ν̅IC) | VIC/nIC | 805 ± 9 | 632 – 895 | 0.07 |
| Non-islet (ν̅NIC) | VNIC/nNIC | 679 ± 19 | 490 – 873 | 0.16 |
| Total (ν̅TC) | VTC/nTC | 745 ± 12 | 547 – 878 | 0.09 |
| Size Ratio (ν̅IC/ν̅TC) | 1.09 ± 0.01 | 0.97 – 1.22 | 0.07 | |
| β-Cells in Islets | ||||
| Cell Volume Fraction (φβIC) | Vβ/VIC | 0.865 ± 0.011 | 0.635 – 0.956 | 0.07 |
| Islet Volume Fraction (ΦβI) | Vβ/VI | 0.612 ± 0.008 | 0.449 – 0.676 | 0.07 |
| Islet Cells and Islets | ||||
| Islet Cells in All Cells (φIC) | VIC/VTC | 0.522 ± 0.029 | 0.195 – 0.892 | 0.31 |
| Islet in All Tissue (ΦI)EM | VI/(VI + VNI) | 0.551 ± 0.029 | 0.216 – 0.904 | 0.29 |
| Number of Cells per IE | ||||
| Number of Total Cells (nIE) | 1560 ± 20 | 1430 – 1980 | 0.07 | |
| Number of β-Cells (nβIE) | 1140 ± 15 | 837 – 1260 | 0.07 | |
| Islet Volume Fraction by DTZ | ||||
| Islet Tissue in All Tissue (ΦI)DTZ | 0.68 ± 0.03 | 0.30 – 0.95 | 0.26 |
Symbols are defined in the Appendix.
Islet volume fraction evaluated by consideration of extracellular volume
It is important to make the distinction between the volume of cells in an islet and the total tissue volume of an islet; the latter includes extracellular volume, which results in a larger volume. In order to convert islet cell volume fraction estimates into islet tissue volume fraction estimates, which provide a measure of purity and a basis for comparison with our measurements using DTZ staining and with other values in the literature, the extracellular volumes (both vascular channels and interstitial spaces) within the islet and non-islet tissue domains were accounted for by Equations (21-33) in the Appendix, and the results are summarized in Table 4. The volume of whole islets as a fraction of the total volume of the entire preparation was 0.551, whereas the volume of islet cells as a fraction of the total cell volume in the preparation was 0.522. The volume of β-cells as a fraction of the volume of islet tissue was 0.612 ± 0.002.
Number of islet cells and β cells per IE
The number of islet cells and β cells per IE, calculated with Equations (34) and (35), were 1560 cells (range 1430 – 1980 cells) and 1140 β cells, respectively (Table 4). The range reflected differences in β cell to non-β cell ratio in individual preparations. For example, the value 1980 islet cells came from the preparation with the fewest number of β cells (41%), which means that the majority of cells were the smaller non-β cells.
Estimation of islet and non-islet tissue by LM
LM evaluation of toluidine blue stained 1-μm plastic sections, generated in preparation for EM, provide information about islet purity and state of the tissue (Figure 1). To test if LM analysis of the same sections could provide reasonable estimates of purity of the islet preparations, volume fraction islet tissue was measured on thin sections available from 27 of the clinical preparations by point counting morphometrics. At the LM level, islet tissue was distinguished from non-islet tissue (exocrine or ganglia) by its cordlike pattern of cells often around vascular spaces, lack of visible granulation, and occasional visible small lipid droplets, whereas the exocrine tissue was in the form of either large sheets of simple columnar ductal epithelia or clumps of duct and acinar tissue (Figure 1 c, f, g). The acinar tissue initially was granulated with large stained granules; these were less pronounced after several days of culture. The small ducts were only faintly stained and surrounded by acinar tissue. Notably, freshly isolated islets had large intraislet vascular spaces, which resulted from the collapse of the capillary lumens and dilation of the resulting intraislet vascular channels (Figure 1 a-c).
For LM analysis of the 1-μm sections, the islet volume fraction exclusive of islet vascular spaces and the vascular void fraction were first analyzed separately according to Appendix Equations (38) and (39), respectively; the islet volume fraction, which included all components that comprised the islet tissue domains, was then calculated using Equation (40). Figure 3 shows the frequency distribution of the vascular void volume fraction in fresh islets that was obtained from this analysis. The vascular void volume fraction varied from 0.05 to 0.21 and averaged 0.14 ± 0.01 for 27 clinical preparations. This was similar to the value of 0.14 measured on electron micrographs of rat islets fixed in situ (26). While the transplanted islets were usually in culture for only a couple of hours, islets from other preparations were more compact with residual vascular spaces partially filled with perivascular (endothelial, macrophages, etc) cells and dead endocrine cells after only 24 hr in 37°C culture (Figure 1 d and e). In addition, some areas of necrosis could be discerned after 24 hr in culture (Figure 1f). In contrast, the vascular volume in rat islets collapsed completely after 24 hr of culture (data not shown). The collapse of the vascular channels contributes to the loss of islet mass often seen after islet culture.
Figure 3.
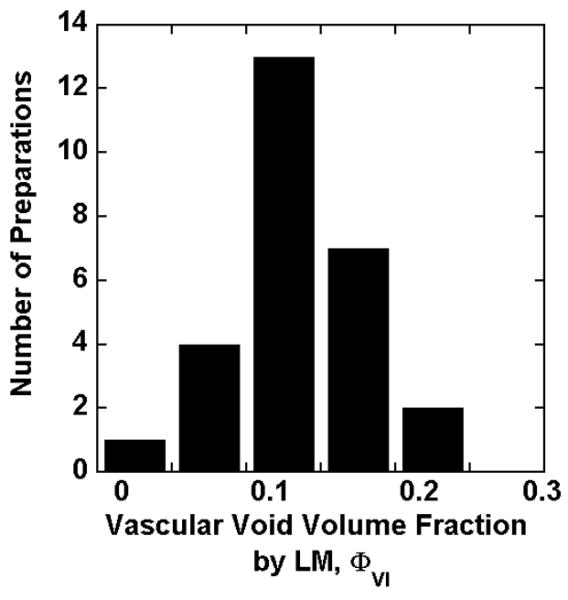
Frequency distribution of the vascular void volume fraction ΦVI by LM for 27 freshly isolated clinical preparations.
Comparison of islet volume fractions determined by three methods
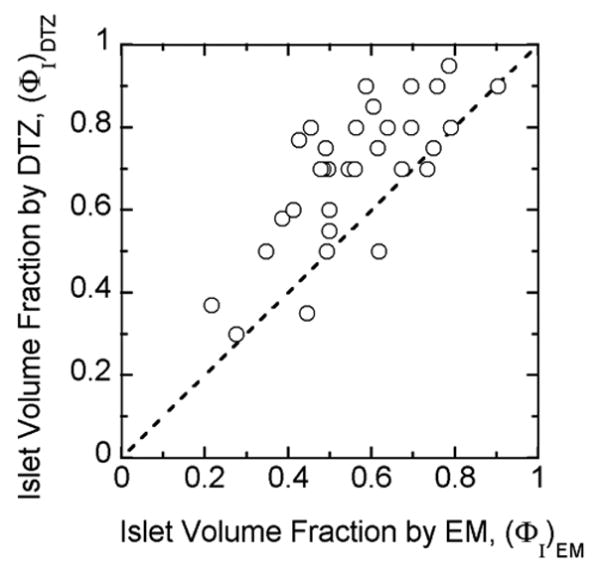
Transplanted human islet preparations are typically accompanied by many acinar and duct cells. Purity has traditionally been estimated by examination of preparations stained with DTZ, a technique that has the advantage of rapid assessment. However, the DTZ method gave erroneously high values (Figure 4) when compared with the more rigorous approach of the whole islet volume fraction based on EM determination of cell composition. The DTZ method gave an average value of 68 ± 3 % while the whole islet volume fraction averaged 55.1 ± 3% (Table 4). In only three of 33 cases was the DTZ estimate lower than that estimated from cell composition measurements using EM. The islet volume fraction data measured from LM was similar to that calculated from EM. The islet volume fraction by EM is plotted against the measured value from LM (Figure 5). All of the data are close to the line of identity for volume fraction by LM greater than about 0.3. The data correlate linearly with R2 = 0.95 if all data are included or R2 = 0.97 if the three preparations with low purity are excluded. These three preparations had a substantial fraction of islets that were embedded in exocrine tissue, making it harder to identify and distinguish islet from exocrine tissue. The islet volume fraction estimated by DTZ staining is plotted against that measured by LM in Figure 6. The data display an upward shift relative to the line of identity. For 24 out of the 27 batches, the estimate from DTZ staining is higher than that from LM, and the two data sets correlate poorly.
Figure 4.
Volume fraction (purity) data for individual islet preparations estimated by visual impressions of DTZ-stained preparations are plotted versus volume fraction estimated from cell composition as determined by EM together with estimates of volume per cell and extracellular volume fractions using Equation (3). The solid line is the line of identity. Data are from all 33 clinical islet preparations.
Figure 5.
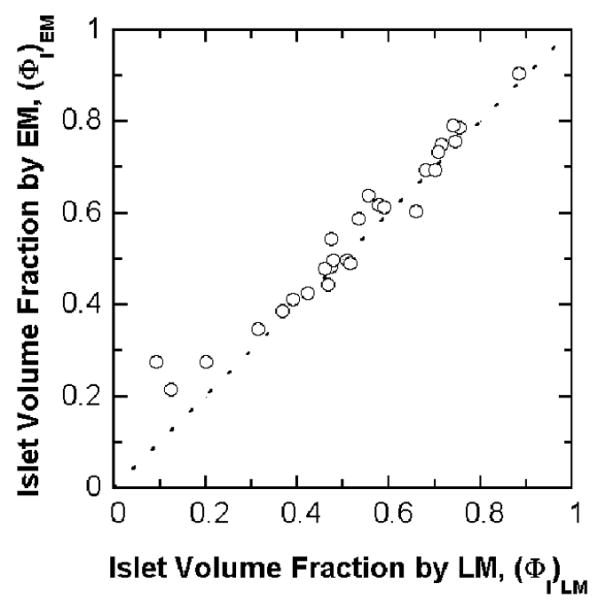
Calculated islet volume fraction by EM is plotted against the measured islet volume fractions by LM for 27 freshly isolated clinical preparations. The dashed line is the line of identity. The calculated islet volume fraction by EM correlates linearly with that measured by LM. Linear regression of the data gives a correlation coefficient R2 = 0.95 for all data and R2 = 0.97 without three data points for (ΦI)LM less than 0.3.
Figure 6.
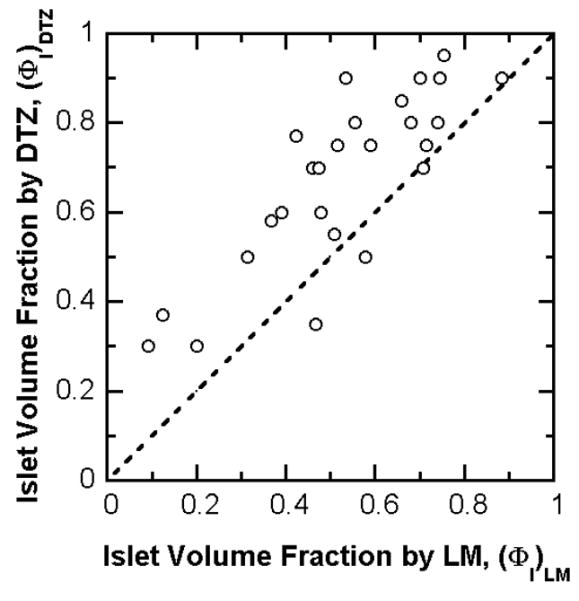
Estimated islet volume fraction by DTZ staining is plotted against the measured islet volume fractions by LM for 27 freshly isolated clinical preparations. The dashed line is the line of identity. In many cases, the measurement from DTZ staining was much higher than that from LM point counting and provided a gross overestimation of islet purity. Linear regression of the data gives a correlation coefficient R2 = 0.67.
The frequency distributions of the islet volume fraction measured by EM, LM, and DTZ staining are shown in Figure 7. The islet volume fractions measured by EM follow a normal distribution. The mode of the distribution corresponds to an islet volume fraction in the range 0.45-0.55. The mode is the same for islet volume fraction obtained by LM, but the data scattered about a normal distribution with more values at the lower end. The distribution of islet volume fractions measured by DTZ staining is skewed to the right with a mode in the range of 0.75-0.85.
Figure 7.
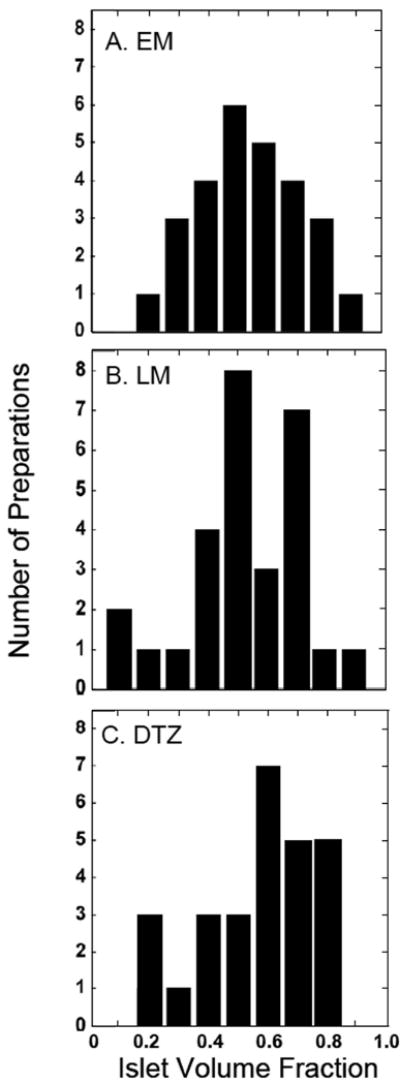
Frequency distribution of the islet volume fraction by (A) EM, (B) LM, and (C) DTZ staining for 27 freshly isolated clinical preparations.
Number fraction of cells by EM and volume fraction of islets by EM, LM, and DTZ staining are summarized in Table 5. The mean islet volume fraction did not differ when based on EM or LM (0.554 ± 0.034 and 0.523 ± 0.038, respectively). The mean islet volume fraction by DTZ, 0.68 ± 0.04, is about 30% greater than that by LM and 23% greater than that by EM, and these findings are significant at p < 0.001. If the three preparations with low purity are excluded, then the mean islet volume fraction by EM and LM are even closer (0.591 ± 0.030 and 0.572 ± 0.030, respectively). The mean islet volume fraction by DTZ, 0.72 ± 0.03, is about 26% higher than that by LM and 22% higher than that by EM (p < 0.001 for EM and for LM).
Table 5.
Number fraction cells by EM and islet volume fractions by EM, LM, and DTZ staining. Data from 27 human islet preparations.
| Number Fraction Cells by EM | Volume Fraction of Islets | ||||
|---|---|---|---|---|---|
| Islet fIC | Non-Islet fNIC | EM (ΦI)EM | LM (ΦI)LM | DTZ (ΦI)DTZ | |
| Mean | 0.484 | 0.516 | 0.554 | 0.523 | 0.68 |
| SD | 0.163 | 0.163 | 0.177 | 0.195 | 0.19 |
| COV | 0.34 | 0.32 | 0.32 | 0.37 | 0.28 |
| SE | 0.031 | 0.031 | 0.034 | 0.038 | 0.04 |
Discussion
The islet transplantation field is challenged with the need of finding better ways to standardize methods for determining the composition of islet preparations. This study focused upon new ways to assess pancreas tissue preparations that have been digested and purified for islet transplantation. Electron microscopy was used to definitively identify β cells, non-β islet cells, acinar cells and duct cells. By counting a sufficient number of cells, reliable estimates of cell composition expressed as number fraction were obtained. We showed how the number fraction data from EM can be converted to a volume basis by use of cell volume estimates from the literature and our own observations. These estimates for cells were then put on a basis of total tissue volume by incorporating estimates of extracellular volume fraction in islet and non-islet tissue, leading to estimates of islet volume fraction, which is the basis for conventional purity estimation. We have used these methods and calculational framework to analyze the properties of 33 freshly isolated human islet preparations used for clinical transplants.
This is the first study to use ultrastructural analysis for quantifying the cell composition of freshly isolated human islet preparations. Previous studies with human islets isolated or within the pancreas have used immunohistochemical staining. A few studies have reported results in terms of number fraction, e.g., the number of β cells relative to the number of all islet cells; most have reported volume fraction, e.g., the volume of β cells relative to the volume of islet tissue (including extracellular space), which is the quantity obtained from our stereological point counting. These different bases arise from methodological differences and have often been ignored in comparing data. In some studies, other volume fraction quantities are reported and manipulation of the data using equations in the Appendix is necessary to convert the data to the volume fraction of β cells within the whole islet volume. The difference between the volume fraction of β cells and the number fraction of β cells is significant because of the large difference in volume of different cell types. The two parameters are related, as shown by Equation (33) in the Appendix, and one can be estimated from the other. Using parameter values measured in this study, the volume fraction of β cells is approximately 0.84 times the number fraction of β cells i.e., about 16% smaller.
The proportion of β cells within human islets, whether isolated or within the pancreas, has been controversial and widely divergent (Table 6). For islets cultured up to 4 wk, Keymeulen et al. (5) reported volume fraction β-cells among islet cells as 0.80 (and the corresponding β-cell volume fraction of whole islet as 0.57), which is 8% lower than our measurements of 0.865. For islets that had been shipped and then cultured for 48 hr, Brissova et al. (16) reported the β-cell volume fraction in islets as 0.54, 12% lower than our result. The reason for these discrepancies is unclear and may reflect a difference between freshly isolated and cultured islets as well as effects of shipping. In a study with dissociated islet cells, Street et al. (3) reported the number fraction of β cells among islet cells was 0.57, 31% lower than our measurement of 0.74. An even lower value of 0.51 was reported with laser scanning cytometry of dissociated islet cells (17). Perhaps shear forces caused by mechanical agitation lead to selective loss of fragile β cells, thus distorting measured islet cell composition. In rodent islets, the dissociation process leads to immediate loss of about 50% of the β cells (29).
Table 6.
Comparison of literature values for β-cell content in human islets
| Volume Fractionβ cells in Whole Islets | Number Fraction β Cells Amongst Islet Cells | |||
|---|---|---|---|---|
| Tissue Examined | Method | ΦβI | fβIC | Reference |
| Freshly Isolated Islets | EM Morphology | 0.61 | 0.74 | This study |
| Cultured Islets | IHC-LSC Microscopy | 0.541 | 0.65 | Brissova et al. (16) |
| Cultured Islets | IHC | 0.572 | 0.68 | Keymeulen et al. (5) |
| Dissociated cells | IHC-LC Cytometry | 0.43 | 0.51 | Ichii et al. (17) |
| Dissociated cells | IHC | 0.47 | 0.57 | Street et al. (3) |
| Pancreatic block | IHC-LSC Microscopy | 0.46 | 0.553 | Cabrera et al. (15) |
| Pancreatic block | IHC | 0.524 | 0.62 | Butler et al. (12) |
| Pancreatic block | IHC | 0.595 | 0.71 | Yoon et al. (11) |
| Pancreatic block | IHC | 0.636 | 0.75 | Sakuraba (14) |
| Pancreatic block | IHC | 0.68 | 0.80 | Kloppel et al. (10) |
| Pancreatic block | IHC | 0.65 | 0.78 | Kloppel et al. (13) |
| Pancreatic block | IHC | 0.70 | 0.73 | Rahier et al. (27) |
| Pancreatic block | IHC | 0.757 | 0.90 | Stefan et al. (28) |
| Pancreatic block | IHC | 0.637 | 0.76 | Malaisse-Lagae et al. (7) |
IHC = Immunohistochemistry with standard fluorescence microscopy unless otherwise noted; LS = Laser scanning; LSC = Laser scanning confocal
Underlined number is data as reported or after conversion of data to ΦβI or fβIC from equations in Appendix. Companion number is calculated using Equation (10).
Islets shipped and cultured for 48 hr total.
Islets cultured 7-14 days under conditions favoring β-cell enrichment.
Only cells that had a clearly labeled nucleus were counted.
Lean, nondiabetic subjects.
Korean subjects
Japanese subjects
Volume-weighted calculated value for 90% glucagon-rich, PP-poor lobes, 10% PP-rich lobes. All other studies with pancreatic blocks did not include PP-rich lobes.
Islet composition within human pancreas has been reported in a number of studies. Using laser scanning confocal microscopy Cabrera et al. (15) found a β cell number fraction of 0.55, 26% lower than our measurement. This difference may result from methodological differences: only cells that had a clearly labeled nucleus were counted (15) because cell borders could not be distinguished on confocal microscopy without specific membrane staining. However, because the nuclear volume is comparable but the total cellular volume of β cells is more than twice that of non-β cells (Table 7), the probability of seeing a nucleus in an arbitrary 1-μm optical section is higher in non-β than in β cells, thereby leading to a measurement of a smaller number fraction of β cells than is actually present. In eight other studies of islets within pancreatic sections, the volume fraction β cells averaged 0.64 ± 0.07 (range 0.52-0.75), which is not significantly different from our result (0.612 ± 0.008). We conclude that the β-cell composition of freshly isolated islets is similar to that of islets in the pancreas.
One potential source of error in all methods for characterizing islet preparations is the extent to which the very small initial sample may not be representative of the much larger volume of the entire preparation. To minimize such error, we followed a consistent procedure to keep the suspension evenly distributed during sampling by repeated inversion of the tube. To minimize errors associated with ultrastructural analysis from EM micrographs, we examined at least 500 cells. The small coefficient of variance for number fraction of β cells in islets (Table 3) and volume fraction of β cells in islets (Table 4), together with the similar mean values of isolated islets and islets within in the pancreas (Table 6), are consistent with our samples being representative of the β-cell content of islets and suggest that the data reflect a reliable value for β-cell proportion of intact, freshly isolated islets.
We also compared islet volume fraction measurements obtained by LM to values estimated from EM cell number fraction measurements. Our results (Figures 5 and 6, Table 5) demonstrate that LM point counting provides accuracy and precision equivalent to that of individual cell counting by EM. In contrast, our results also indicate that the standard method of DTZ staining grossly overestimates the islet volume fraction in the preparation. These findings are important because they show that point counting with LM to analyze 1-μm sections, which is easier to learn and employ, provides data comparable to that obtained by EM and validates the use of LM stereological point counting for determining islet purity.
Purity assessments by visual estimation after DTZ staining were 20-30% higher on average than the value estimated by EM or LM, and individual measurements were often much higher (Figure 4 and 6). A similar overestimation by the DTZ approach was previously found with immunostaining methods (3, 17). This is not surprising since the two-dimensional observations with normal light microscopy used with DTZ staining can lead to an overestimate of the three-dimensional estimate of volume fraction. Furthermore, estimates from DTZ staining are subject to considerable observer variability, as evidenced by experienced individuals trained in the same manner often having differences that are sometimes more than 20%.
We also performed the first quantitative measurements of the vascular void volume fraction in fresh human islets (Figures 3). The average value, 0.14 ± 0.01, was comparable to that previously measured in rat islets (26). This value applies to freshly isolated human islets and will decrease for islets that have been cultured for several days because of the partial collapse of these spaces with time in culture.
Overall this present study introduced new approaches to the accurate assessment of cell composition and purity in islet preparations, which are important for characterizing preparations that are transplanted into patients with diabetes The use of electron microscopy to quantitate the cellular composition is unique and rigorous and serves as a standard to validate the easier to use light microscopic method. While this work relied on analysis of the plastic-embedded tissue done after the transplants, the new quantification approach using LM may be applicable with frozen sections to estimate purity in the hours between isolation and transplantation. The approaches developed in this study should bring us closer to obtaining accurate measurements of the cell composition of islet preparations before they are transplanted into patients with diabetes.
Acknowledgments
We thank Christopher Cahill for invaluable technical assistance with both EM and LM.
Sources of support: This study was supported by grants from the NIH (NCRR ICR U4Z RR 16606, RO1-DK063108, the Joslin Diabetes and Endocrinology Research Center [DERC] DK36836), the JDRF Center for Islet Transplantation at Harvard Medical School, and the Diabetes Research and Wellness Foundation.
Notation
- fA
Number fraction of acinar cells among all cells
- fD
Number fraction of duct cells among all cells
- fi
Number fraction of cell type i
- fIC
Number fraction of all islet cells
- fO
Number fraction of all “other” cell types among all cells
- fNβ
Number fraction of non-β cells among all cells
- fNIC
Number fraction of all non-islet cells
- fβ
Number fraction of β cells among all cells
- fβIC
Number fraction of β cells among all islet cells
- nA
Number of acinar cells
- nD
Number of duct cells
- ni
Number of cells of type i
- nIC
Number of islet cells
- nIE
Number of cells in an islet equivalent volume
- NIE
Number of islet equivalents
- (NIE)DTZ
Number of IE calculated from DTZ staining data
- nNIC
Number of non-islet cells
- nNβ
Number of non-β-cells
- nO
Number of other cells
- nTC
Total number of cells
- nβ
Number of β-cells
- nβIE
Number of β cells in an islet equivalent volume
- PI
Number of points falling within the domain of islets
- PNI
Number of points falling within the domain of non-islets tissue
- PV
Number of points falling within the domain of islet vascular space
- VA
Volume of acinar cells
- VD
Volume of duct cells
- VI
Total volume of the islet domain
- VIC
Volume of islet cells
- VI
Volume of an islet equivalent (1.77 × 106 μm3)
- VIEC
Extracellular volume within islet domain
- VINT
Volume of interstitial space in islet
- VIXV
Volume of islet cells and interstitial space within the islet domain
- VM
Total volume of the non-islet domain
- VNIC
Volume of non-islet cells
- VNIEC
Extracellular volume within the non-islet domain
- VNβ
Volume of non-β-cells
- VQ
Volume of other cells
- VTC
Total volume of all islet and non-islet cells
- VV
Vascular volume within the islet domain
- VVI
Volume of vascular voids in islet
- Vβ
Volume of β-cells
- φIC
Volume fraction of islet cells among all cells
- φNIC
Volume fraction of non-islet cells among all cells
- φβIC
Volume fraction of β cells among all islet cells
- ΦD
Fractional distribution volume
- ΦI
Volume fraction of islets
- ΦIC
Volume fraction of islet cells within the islets
- ΦIEC
Volume fraction of islet extracellular space within the islets
- ΦIXV
Volume fraction of islets exclusive of islet vascular spaces
- ΦNIC
Volume fraction of non-islet cells based on the total non-islet volume
- ΦNIEC
Volume fraction of non-islet extracellular space based on the total non-islet volume
- ΦVI
Volume fraction of vascular voids within islets
- ΦβI
Volume fraction of β cells within whole islet volume
- (φIC)EM
φIC calculated from electron microscopy ultrastructural analysis
- (ΦI)DTZ
ΦI calculated from DTZ staining data
- (ΦI)EM
ΦI calculated from electron microscopy ultrastructural analysis
- νA
Cell volume of acinar cells
- νD
Cell volume of duct cells
- νNβ
Cell volume of non-β-cells
- νO
Cell volume of other cells
- νβ
Cell volume of β-cells
- ν̅IC
Average cell volume for islet cells
- ν̅NIC
Average cell volume for non-islet cells
- ν̅TC
Average cell volume for all of the cells
Appendix
Number fraction and volume fraction relationships in islet preparation
Our objective is to develop a framework of equations and parameters for conversion between number fraction and volume fraction measurements with human pancreatic islet preparations. We begin with development of the basic number-volume relationships for cells. We then examine volume definitions and relationships applicable to tissues, in which extracellular volume is included. The third section provides estimates of parameter values used in these relationships. We conclude with use of packed cell volume measurements for estimating the total islet volume in a preparation.
Cells
Cell composition measurements from EM provide data on the number ni of each type of cell in the sample, where i represents the cell type. The islet cells (IC) include β-cells and non-β-cells (Nβ). The non-islet cells (NIC) include acinar (A), duct (D), and other (O) cells. The individual cell counts are summed to give the number of islet, non-islet, and total cells (TC),
| (1) |
| (2) |
| (3) |
from which the islet and non-islet cell number fraction is calculated as the number of cells of each type divided by the total number of cells in the sample
| (4) |
| (5) |
In general, the number fraction fi of any cell type i in the islet preparations is determined from
| (6) |
Recognizing that the volume of each cell type Vi is the product of the number of cells ni and the volume per cell νi of that type, analogous equations can be written for the volumes of islet, non-islet, and total cells in the preparation,
| (7) |
| (8) |
| (9) |
The fractions φ of total cell volume occupied by islet and non-islet cells is defined by
| (10) |
| (11) |
and the volume fraction of any cell type i is given by
| (12) |
In order to relate cell number fractions to cell volume fractions, we make use of the average volume per cell for different combinations of cells. For example, the average volume per cell for islet cells ν̅IC is the volume of islet cells divided by the number of islet cells in the preparation. Using this definition, together with Equations (4), (6), and (7), yields
| (13) |
The sequential substitutions and manipulations show how the final result is expressed entirely in terms of cell number fractions and individual cell volumes. Similar expressions are obtained for non-islet and total cell average volumes
| (14) |
| (15) |
The volume of islet cells is the product of the number of islet cells and the average volume of islet cells, ν̅IC
| (16) |
Similarly, for the total cells
| (17) |
The volume fraction islet cells φIC can be related to the number fraction islet cells fIC by combining Equations (10), (16), and (17) to yield
| (18) |
Equation (18) is the key equation for converting between islet cell number fraction fIC and islet cell volume fraction φIC. If the ratio of islet cell to total cell average volumes ν̅IC/ν̅TC is unity, meaning all islet cells have the same average volume as all non-islet cells, then φIC = fIC.
Also of interest are the β-cell number fraction fbIC, i.e. the fraction of islet cells that are β-cells,
| (19) |
and the β-cell volume fraction, i.e. the fraction of the islet cell volume comprised of β-cells,
| (20) |
To this point, all volume fractions denoted by lower case are based upon the volume of the cells without other tissue spaces.
Tissues
Next we develop expressions for volume fractions based upon the total tissue volumes, VI and VNI, the components of which are shown schematically in Figure 9.
| (21) |
| (22) |
We denote by capital Φ the volume fractions that are based upon the total volumes, which include both the cell and the extracellular volume in each tissue. The volume fraction of extracellular space in islet tissue is defined as
| (23) |
and the volume fraction islet cells is given by
| (24) |
Analogous expressions for the volume fractions of extracellular space and cells of non-islet tissue are given by
| (25) |
| (26) |
Components of the extracellular space, i.e., the interstitial and vascular spaces, are shown separately for islets in Figure 8 because the vascular void volume fraction
Figure 8.
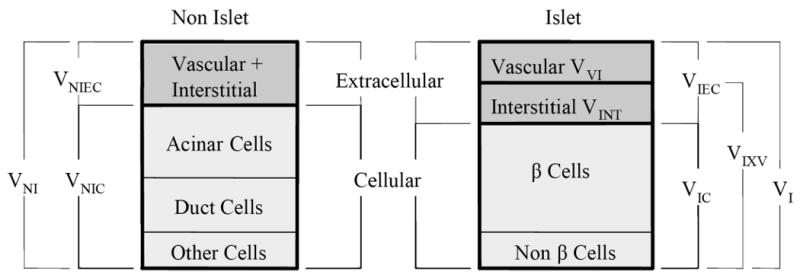
Volume definitions and relationships in islet preparations. Other cells refer to the endothelial and connective tissue cells as well as cells that could not be classified.
| (27) |
constitutes a significant fraction of the total. However, the calculations in this paper make use only of the total islet extracellular volume fractions.
The volume fraction islets based upon the total tissue volume ΦI, which is equivalent to the purity of an islet preparation, is defined as
| (28) |
Substituting for VI and VNI from Equations (23) and (25), respectively, yields
| (29) |
Division of numerator and denominator by the total cell volume VTC, followed by substitution of Equations (10) and (11) for the quantities VIC/VTC and VNIC/VTC leads to
| (30) |
This key equation shows how the volume fraction of islets in the preparation ΦI may be calculated from the volume fraction of islet cells φIC and the volume fractions of extracellular space in the islet (ΦIEC) and non-islet (ΦNIEC) tissues. The quantity φIC, in turn, is calculated from the islet cell number fraction fIC (from EM cell composition data) using Equation (18).
Other quantities of interest related to the entire islet volume can be calculated from expressions developed to this point. The islet volume fraction, ΦβI, i.e., the volume fraction of the entire islet occupied by β-cells, is defined by
| (31) |
Substituting Equations (20) and (24) into (31) leads to
| (32) |
Combining Equations (19) and (20), with (32) yields
| (33) |
which shows how ΦβI and fβIC are related. By combining Equations (31) and (32), one obtains
| (34) |
ΦIEC is a constant. If fβIC, the volume fraction of β-cells among all islet cells is constant, then the volume (and number) of β-cells is directly proportional to the islet volume (or number of islet equivalents) in an islet preparation.
An islet equivalent (IE), a sphere of diameter 150 μm, has a volume VIE = 1.77 × 106 μm3. The total number of cells in an IE is given by the volume of cells (the product of (1-ΦIEC) and VIE) divided by the average volume per islet cell,
| (35) |
and the number of β-cells in an IE is
| (36) |
Parameters
Estimates of the cell volumes and tissue extracellular volumes are needed to carry out the calculations described here. The cell volume estimates used in carrying out calculations are summarized in Table 2. Values for β and non-β cells (assumed to have properties of α cells) are taken from measurements with freshly isolated and purified rat islets (30, 31). The β-cell volume for freshly isolated islets reflects an estimated 5% loss from the commonly accepted value of about 1,000 μm3 for the native pancreas (32, 33), which is consistent with a partial degranulation during isolation and dispersion. Acinar volume in the mature pancreas on average is within the 1,300 to 1,800 μm3 range reported for the adult rat (34-36) and it is assumed that about 20 to 25% of the volume in freshly isolated preparations is lost from degranulation. Estimates for duct and other cells are from our observations (Bonner-Weir, S., unpublished). After several days in culture, surviving β cells partially regranulate. Acinar cells are more prone to death when cultured and are not as well studied.
Available data for estimating the extracellular volume fractions ΦIEC and ΦNIEC are limited. In one study (37), the extracellular spaces in islet and non-islet tissue of the mouse in vivo were determined by sorbitol distribution experiments to be 39 and 26% of tissue water, respectively, based on an estimated tissue water content of 75%, which corresponds to ΦIEC = 0.29 and ΦNIEC = 0.19 when based on total tissue volume. We reanalyzed the original data (37) and obtained ΦIEC = 0.288 ± 0.062 (mean ± SD, n = 3). In a study using stereological point counting with electron micrographs of rat islets (26), the extracellular volume fraction averaged 0.203 ± 0.088 (n = 3). These estimates are not significantly different (p < 0.05). In this study, we estimated the vascular volume fraction ΦVI of human islets to be about 0.14 using stereological point counting with light microscopy, which represents the lower bound for estimation of ΦIEC because interstitial space is not included. The larger value of 0.29 (37) was used in the calculations. If a value lower than 0.29 had been used, only modest changes would have occurred in calculated quantities. For example, the islet volume fraction calculated from Equation (30) would have values of about 0.55, 0.53, and 0.51 for values of ΦIEC equal to 0.29, 0.203, and 0.14, respectively. After 24 hours in culture, the vascular volume of isolated islets collapses, completely for rodent islets and incompletely for human islets, leading to a substantial reduction in islet volume (Bonner-Weir S, unpublished).
Islet volume fraction by point counting with LM
We define the number of points falling on islet tissue as PI, non-islet tissue as PNI, and vascular space as PV. If the vascular space is included as part of the islet, the volume fraction of islets ΦI can be calculated from
| (37) |
where the numerator is the number of points falling within the domain of islets and the denominator is the total number of points over tissue. If the vascular space is analyzed separately, then we first ignore the vascular space and calculate the islet volume fraction exclusive of islet vascular spaces from
| (38) |
The tissue is then reanalyzed at higher magnification (830×) to obtain the vascular void fraction, ΦVI in the islets from
| (39) |
The islet volume fraction can then calculated from
| (40) |
Equation (40) is equivalent to Equation (37), as can be verified by substituting Equation (38) and (39) into Equation (40). The second method, Equations (38) through (40), was employed here because it provided more consistent results.
Footnotes
Disclosure/Duality of Interest: None of the authors have a conflict of interest.
References
- 1.Hering BJ, Kandaswamy R, Ansite JD, Eckman PM, Nakano M, Sawada T, et al. Single-donor, marginal-dose islet transplantation in patients with type 1 diabetes. JAMA. 2005;293:830–5. doi: 10.1001/jama.293.7.830. [DOI] [PubMed] [Google Scholar]
- 2.Ryan EA, Paty BW, Senior PA, Bigam D, Alfadhli E, Kneteman NM, et al. Five-year follow-up after clinical islet transplantation. Diabetes. 2005;54:2060–9. doi: 10.2337/diabetes.54.7.2060. [DOI] [PubMed] [Google Scholar]
- 3.Street CN, Lakey JR, Shapiro AM, Imes S, Rajotte RV, Ryan EA, et al. Islet graft assessment in the Edmonton Protocol: implications for predicting long-term clinical outcome. Diabetes. 2004;53:3107–14. doi: 10.2337/diabetes.53.12.3107. [DOI] [PubMed] [Google Scholar]
- 4.Goto M, Eich TM, Felldin M, Foss A, Kallen R, Salmela K, et al. Refinement of the automated method for human islet isolation and presentation of a closed system for in vitro islet culture. Transplantation. 2004;78:1367–75. doi: 10.1097/01.tp.0000140882.53773.dc. [DOI] [PubMed] [Google Scholar]
- 5.Keymeulen B, Ling Z, Gorus FK, Delvaux G, Bouwens L, Grupping A, et al. Implantation of standardized beta-cell grafts in a liver segment of IDDM patients: graft and recipient characteristics in two cases of insulin-independence under maintenance immunosuppression for prior kidney graft. Diabetologia. 1998;41:452–9. doi: 10.1007/s001250050929. [DOI] [PubMed] [Google Scholar]
- 6.Sever CE, Demetris AJ, Zeng J, Carroll P, Tzakis A, Fung JJ, et al. Composition of human islet cell preparations for transplantation. Acta Diabetol. 1992;28:233–8. doi: 10.1007/BF00779005. [DOI] [PMC free article] [PubMed] [Google Scholar]
- 7.Malaisse-Lagae F, Orci L, Perrelet A. Anatomic and hormonal markers for the ventral primordium in the human pancreas. NEnglJMed. 1979;300:436. doi: 10.1056/NEJM197902223000818. [DOI] [PubMed] [Google Scholar]
- 8.Stefan Y, Grasso S, Perrelet A, Orci L. The pancreatic polypeptide-rich lobe of the human pancreas: definitive identification of its derivation from the ventral pancreatic primordium. Diabetologia. 1982;23:141–2. doi: 10.1007/BF01271177. [DOI] [PubMed] [Google Scholar]
- 9.Rahier J, Wallon J, Loozen S, Lefevre A, Gepts W, Haot J. The pancreatic polypeptide cells in the human pancreas: The effects of age and diabetes. JClinEndocrinolMetab. 1983;56:441–4. doi: 10.1210/jcem-56-3-441. [DOI] [PubMed] [Google Scholar]
- 10.Kloppel G, Lohr M, Habich K, Oberholzer M, Heitz PU. Islet pathology and the pathogenesis of type 1 and type 2 diabetes mellitus revisited. SurvSynthPatholRes. 1985;4:110–25. doi: 10.1159/000156969. [DOI] [PubMed] [Google Scholar]
- 11.Yoon KH, Ko SH, Cho JH, Lee JM, Ahn YB, Song KH, et al. Selective beta-cell loss and alpha-cell expansion in patients with type 2 diabetes mellitus in Korea. J Clin Endocrinol Metab. 2003;88:2300–8. doi: 10.1210/jc.2002-020735. [DOI] [PubMed] [Google Scholar]
- 12.Butler AE, Janson J, Bonner-Weir S, Ritzel R, Rizza RA, Butler PC. Beta-cell deficit and increased beta-cell apoptosis in humans with type 2 diabetes. Diabetes. 2003;52:102–10. doi: 10.2337/diabetes.52.1.102. [DOI] [PubMed] [Google Scholar]
- 13.Oberholzer M, Heitz PU, Kloppel G, Ehrsam RE. Morphometry in endocrine pathology. Pathol Res Pract. 1984;179:220–4. doi: 10.1016/S0344-0338(84)80133-8. [DOI] [PubMed] [Google Scholar]
- 14.Sakuraba H, Mizukami H, Yagihashi N, Wada R, Hanyu C, Yagihashi S. Reduced beta-cell mass and expression of oxidative stress-related DNA damage in the islet of Japanese Type II diabetic patients. Diabetologia. 2002;45:85–96. doi: 10.1007/s125-002-8248-z. [DOI] [PubMed] [Google Scholar]
- 15.Cabrera O, Berman DM, Kenyon NS, Ricordi C, Berggren PO, Caicedo A. The unique cytoarchitecture of human pancreatic islets has implications for islet cell function. Proc Natl Acad Sci U S A. 2006;103:2334–9. doi: 10.1073/pnas.0510790103. [DOI] [PMC free article] [PubMed] [Google Scholar]
- 16.Brissova M, Fowler MJ, Nicholson WE, Chu A, Hirshberg B, Harlan DM, et al. Assessment of human pancreatic islet architecture and composition by laser scanning confocal microscopy. J Histochem Cytochem. 2005;53:1087–97. doi: 10.1369/jhc.5C6684.2005. [DOI] [PubMed] [Google Scholar]
- 17.Ichii H, Inverardi L, Pileggi A, Molano RD, Cabrera O, Caicedo A, et al. A novel method for the assessment of cellular composition and beta-cell viability in human islet preparations. Am J Transplant. 2005;5:1635–45. doi: 10.1111/j.1600-6143.2005.00913.x. [DOI] [PubMed] [Google Scholar]
- 18.Latif ZA, Noel J, Alejandro R. A simple method of staining fresh and cultured islets. Transplantation. 1988;45:827–30. [PubMed] [Google Scholar]
- 19.Fraker CA, Alejandro R, Ricordi C. Use of oxygenated perfluorocarbon toward making every pancreas count. Transplantation. 2002;74:1811–2. doi: 10.1097/00007890-200212270-00032. [DOI] [PubMed] [Google Scholar]
- 20.Ricordi C, Lacy PE, Finke EH, Olack BJ, Scharp DW. Automated method for isolation of human pancreatic islets. Diabetes. 1988;37:413–20. doi: 10.2337/diab.37.4.413. [DOI] [PubMed] [Google Scholar]
- 21.Shapiro AM, Lakey JR, Ryan EA, Korbutt GS, Toth E, Warnock GL, et al. Islet transplantation in seven patients with type 1 diabetes mellitus using a glucocorticoid-free immunosuppressive regimen. NEnglJMed. 2000;27:230–8. doi: 10.1056/NEJM200007273430401. [DOI] [PubMed] [Google Scholar]
- 22.Linetsky E, Bottino R, Lehmann R, Alejandro R, Inveradi L, Ricordi C. Improved human islet isolation using a new enzyme blend, liberase. Diabetes. 1997;46:1120–3. doi: 10.2337/diab.46.7.1120. [DOI] [PubMed] [Google Scholar]
- 23.Weibel ER. Stereological Methods. Vol. 1. London: Academic Press; 1979. Practical methods for biological morphometry. [Google Scholar]
- 24.Ricordi C, Gray DW, Hering BJ, Kaufman DB, Warnock GL, Kneteman NM, et al. Islet isolation assessment in man and large animals. Acta Diabetol Lat. 1990;27:185–95. doi: 10.1007/BF02581331. [DOI] [PubMed] [Google Scholar]
- 25.Cnop M, Grupping A, Hoorens A, Bouwens L, Pipeleers-Marichal M, Pipeleers D. Endocytosis of low-density lipoprotein by human pancreatic beta cells and uptake in lipid-storing vesicles, which increase with age. AmJPathol. 2000;156:237–44. doi: 10.1016/s0002-9440(10)64724-4. [DOI] [PMC free article] [PubMed] [Google Scholar]
- 26.Bonner-Weir S. Anatomy of the islets of Langerhans. In: Samols E, editor. The Endocrine Pancreas. New York: Raven Press; 1990. pp. 15–28. [Google Scholar]
- 27.Rahier J, Goebbels RM, Henquin JC. Cellular composition of the human diabetic pancreas. Diabetologia. 1983;24:366–71. doi: 10.1007/BF00251826. [DOI] [PubMed] [Google Scholar]
- 28.Stefan Y, Orci L, Malaisse-Lagae F, Perrelet A, Patel Y, Unger RH. Quantitation of endocrine cell content in the pancreas of nondiabetic and diabetic humans. Diabetes. 1982;31:694–700. doi: 10.2337/diab.31.8.694. [DOI] [PubMed] [Google Scholar]
- 29.Weir GC, Halban PA, Meda P, Wollheim CB, Orci L, Renold AE. Dispersed adult rat pancreatic islet cells in culture: A, B, and D cell function. Metabolism. 1984;33:447–53. doi: 10.1016/0026-0495(84)90146-x. [DOI] [PubMed] [Google Scholar]
- 30.Pipeleers DG, Pipeleers-Marichal MA. A method for the purification of single A, B, and D cells and for the isolation of coupled cells from isolated rat islets. Diabetologia. 1981;20:654–63. doi: 10.1007/BF00257436. [DOI] [PubMed] [Google Scholar]
- 31.Pipeleers DG. The biosociology of pancreatic B-cells. Diabetologia. 1987;30:277–91. doi: 10.1007/BF00299019. [DOI] [PubMed] [Google Scholar]
- 32.Dean PM. Ultrastructural morphometry of the pancreatic β-cell. Diabetologia. 1973;9:115–9. doi: 10.1007/BF01230690. [DOI] [PubMed] [Google Scholar]
- 33.Bonner-Weir S, Deery D, Leahy JL, Weir GC. Compensatory growth of pancreatic B-cells in adult rats after short-term glucose infusion. Diabetes. 1989;38:49–53. doi: 10.2337/diab.38.1.49. [DOI] [PubMed] [Google Scholar]
- 34.Aughsteen AA, Cope GH. Changes in the size and number of secretion granules in the rat exocrine pancreas induced by feeding or stimulation in vitro. A morphometric study. Cell Tissue Res. 1987;249:427–36. doi: 10.1007/BF00215527. [DOI] [PubMed] [Google Scholar]
- 35.Sato T, Herman L. Morphometry and elemental analysis of rat exocrine pancreas following administration of trypsin inhibitor. Acta Anat (Basel) 1990;137(1):65–76. doi: 10.1159/000146860. [DOI] [PubMed] [Google Scholar]
- 36.Aughsteen AA, Kataoka K, Shair SA. Correlative morphometric and biochemical study on pancreatic amylase in normal and streptozotocin-diabetic rats. Pancreas. 1996;13:295–303. doi: 10.1097/00006676-199610000-00013. [DOI] [PubMed] [Google Scholar]
- 37.Matschinsky FM, Ellerman JE. Metabolism of glucose in the islets of Langerhans. J Biol Chem. 1968;243:2730–6. [PubMed] [Google Scholar]