

Abstract
An adequate effector response against pathogens and its subsequent inactivation after pathogen clearance are critical for the maintenance of immune homeostasis. This process involves an initial phase of T-cell effector (Teff) activation followed by the expansion of regulatory T cells (Tregs), a unique cell population that limits Teff functions. However, significant questions remain unanswered about the mechanisms that regulate the balance between these cell populations. Using an in vitro system to mimic T-cell activation in human peripheral blood mononuclear cells (PBMC), we analysed the patterns of Treg and Teff activation, with special attention to the role of type I interferon (IFN-I). Interestingly, we found that IFN-α, either exogenously added or endogenously induced, suppressed the generation of CD4+ FoxP3HIIFN-γNeg activated Tregs (aTregs) while simultaneously promoting propagation of CD4+ FoxP3Low/NegIFN-γPos activated Teffs (aTeffs). We also showed that IFN-α-mediated inhibition of interleukin (IL)-2 production may play an essential role in IFN-α-induced suppression of aTregs. In order to test our findings in a disease state with chronically elevated IFN-α, we investigated systemic lupus erythematosus (SLE). Plasma from patients with SLE was found to contain IFN-I activity that suppressed aTreg generation. Furthermore, anti-CD3 activated SLE PBMCs exhibited preferential expansion of aTeffs with a very limited increase in aTreg numbers. Together, these observations support a model whereby a transient production of IFN-α (such as is seen in an early antiviral response) may promote CD4 effector functions by delaying aTreg generation, but a chronic elevation of IFN-α may tip the aTeff:aTreg balance towards aTeffs and autoimmunity.
Keywords: activation, autoimmunity, innate immunity, regulatory T cells (Tregs), viruses/viral immunity
Introduction
Regulatory T cells (Tregs) are a distinct thymically derived or inducible subset of T cells with unique abilities to suppress immune responses and to maintain immunological unresponsiveness to self-antigens.1 The absence of Tregs in knock-out or antibody depletion mouse models leads to systemic autoimmunity.2 Natural Tregs (nTregs) develop in the thymus and are detected in the periphery, and are characterized by stable expression of the Foxp3 gene encoding the FoxP3 transcriptional regulator, as well as by distinctively high surface expression of CD25 [interleukin (IL)-2 receptor alpha chain].3 While Foxp3 gene expression is limited to Tregs in mice, it can also be expressed by activated human effector T cells (Teffs).4–6 In this regard, recent evidence suggests that human CD4+ FoxP3+ T cells are composed of at least three phenotypically and functionally distinct subpopulations: FoxP3Low resting Tregs (rTregs), FoxP3HI activated Tregs (aTregs) (both of which are suppressive in vitro), and cytokine-secreting (i.e. IL-2 and IFN-γ) FoxP3Low non-suppressive T cells.4,6
Although the relevance of human FoxP3 cell subsets remains to be established in health and disease, it is generally considered that a decrease in the number and/or function of Tregs plays a role in autoimmune disease pathogenesis by allowing uncontrolled immune effector activities.6–8 In contrast, an abnormal increase in Treg number and/or function may result in abnormal suppression of immune effector functions and defective clearance of pathogens or tumours.9,10 Maintaining a tight control of Treg activities appears critical to (i) ensuring an adequate immune response against pathogens, (ii) avoiding excessive immune activation which may be deleterious to the host, and (iii) maintaining immune tolerance against self-antigens.
Recent evidence suggests that, upon stimulation of the immune system, there is an initial phase of Teff expansion (first 1–2 weeks) followed by a second phase (weeks 3–4) of expansion of Tregs which then control the Teff response.11 Expansion of Teffs and expansion of Tregs both require the same conditions of antigen stimulation, but express distinct kinetics. Thus, effectors predominate early to achieve pathogen clearance, without the interference of regulatory cells.12 Once the pathogen has been cleared from the host, increased numbers of regulatory cells (resulting from the second phase of expansion) can suppress the effectors, and the immune system can return to its steady state. Pro-inflammatory cytokines, such as IL-1, IL-6 and tumour necrosis factor alpha (TNF-α), have been found to promote Treg proliferation/expansion, and in parallel to support proliferation of Teffs.13,14 In addition, all three cytokines have been shown to make Teffs relatively resistant to suppression by Tregs.15–17 Not previously described, however, is a cytokine that can preferentially promote activation of Teffs while inhibiting Treg expansion.
Type 1 interferons (IFN-I) are innate cytokines that are transiently induced during viral infection and have unique roles in defence against viruses, but their persistent stimulation may contribute to autoimmune disorders such as systemic lupus erythematosus (SLE), inflammatory myositis and Sjögren's syndrome.18 Early during acute viral infection, a transient wave of high levels of systemic IFN-I is triggered, peaking at days 3–5 and returning to basal levels at days 5–7 post-infection.19,20 The peak of IFN-I induces an almost global acquisition of a partial activation phenotype in T and B cells which reverts to a resting phenotype within 5 days.19,21 Interestingly, this process is followed by a transient period of partial immune-unresponsiveness (between 5 and 9 days after an acute primary viral episode),22 in which a post-viral expansion of Tregs has been proposed to play a role.23 Although the production of IFN-I after acute infection has a significant role in the acquisition of immune effector functions, whether the transience in IFN-I production may also contribute to the late generation of Tregs is still unknown.
In this study, we found that IFN-α alters the pattern of aTreg (CD4+ FoxP3HIIFN-γNeg) and aTeff (CD4+ FoxP3Low/NegIFN-γPos) cell generation in anti-CD3 activated peripheral blood mononuclear cells (PBMC), by exerting a negative effect on Treg activation and proliferation while favouring Teff activation. We also demonstrated that IL-2, a critical cytokine involved in Treg survival and proliferation, was significantly down-regulated by IFN-α, and that the addition of IL-2 was able to reverse IFN-α-induced suppression of Tregs. Finally, we found that the generation of aTregs was suppressed in PBMC from patients with SLE, a condition characterized by chronic IFN-α stimulation and low IL-2 production.24–26 Taken together, these findings provide evidence to suggest that IFN-α has a negative effect on Treg activation and proliferation (probably through inhibition of IL-2 production by activated Teffs), and that unique patterns of IFN-α production may play a role in defining the balance between Teffs and Tregs in acute and chronic inflammatory conditions.
Materials and methods
Ethics
The study was approved by The Johns Hopkins Medicine Institutional Review Board (IRB) and all individuals signed an informed consent form.
Subject selection
After IRB approval had been obtained, normal controls were recruited and informed consent obtained. Alternatively, for two of the donors, leucopacks were obtained from the New York Blood Center (New York, NY). Patients with SLE were recruited through the Johns Hopkins SLE cohort, an ongoing, National Institutes of Health (NIH)-funded prospective study.
Cell culture
PBMC were purified from healthy controls using Ficoll-Hypaque density-gradient centrifugation. Our system for recapitulating the normal in vivo expansion of Tregs upon immune activation is based on the work of Gavin et al.,4 who described the use of a combination of cell surface and intracellular markers to specifically follow and distinguish CD4+ Tregs from CD4+ Teffs. Purified PBMC were plated at 1 × 10⁶ cells/ml with 5% heat-inactivated human AB serum (Mediatech, Manassas, VA) and stimulated with soluble anti-CD3 (100 ng/ml; OKT3; BD Biosciences, San Jose, CA). Where indicated, IFN-I [human leucocyte IFN (predominantly IFN-α) (R&D Systems, Minneapolis, MN) or human recombinant IFN-β 1b (PBL InterferonSource, Piscataway, NJ)] was added at 100–500 (IFN-β) or 100–1000 (IFN-α) units/ml, or 100 units/ml human recombinant IL-2 (Proleukin; Chiron Corp, Emeryville, CA) was added. IFN-I concentrations were used within the physiological range generated upon acute viral infection in humans.27,28 For Toll-like receptor 3 (TLR3) agonism experiments, poly(I:C) (InvivoGen, San Diego, CA) was added at 20–40 μg/ml overnight prior to adding anti-CD3. IFN-α production in poly(I:C)-stimulated culture supernatants (16 hr) was measured using a VeriKine™ Human IFN-α ELISA Kit (PBL InterferonSource). For SLE plasma experiments, 5% SLE patient plasma or normal donor plasma was added overnight prior to adding anti-CD3. IFN-α/β receptor neutralizing antibody (IFNRAB; PBL InterferonSource) was used where indicated at a concentration of 5 μg/ml, either at the same time as poly(I:C) or 1 hr prior to adding 5% SLE (or normal) plasma; alternatively, neutralizing antibodies against IL-6 (5 μg/ml; AB-206-NA; R&D Systems) or TNF-α (5 μg/ml; clone 6401; R&D Systems) were added with poly(I:C). On day zero (freshly isolated cells) and on subsequent days of culture, cells were permeabilized and fixed (using Fix/Perm solution and diluent; EBioscience, San Diego, CA) and frozen at −80° in RPMI/20% fetal bovine serum (FBS)/10% dimethyl sulphoxide (DMSO) for later staining for flow cytometry analysis. For intracellular cytokine staining (IFN-γ or IL-2), cells were restimulated with phorbol 12-myristate 13-acetate (PMA)/ionomycin/GolgiStop for 5 hr (day 0) or 3 hr (cultured PBMC) before fixation and storage at −80°.
Flow cytometry
Thawed and phosphate-buffered saline (PBS)-washed cells were re-suspended in 1× Ebioscience FoxP3 Perm buffer and non-specific binding was blocked with rat serum for 10 min. Cells were then stained with fluorescent-labelled antibodies to different cell surface and intracellular proteins for flow cytometry analysis. Monoclonal anti-human antibodies were purchased from BD Bioscience: peridinin chlorophyll protein (PerCP) Cy5·5 CD4 (clone SK3), fluorescein isothiocyanate (FITC) IFN-γ (clone 4S.B3), FITC Ki-67 (clone B56), phycoerythrin (PE) Cy7 IL-2 (clone MQ1-17H12), and allophycocyanin (APC) CD25 (clone M-A251); and from EBioscience: PE FoxP3 (clone PCH101). Flow cytometry was conducted using a BD FACsCalibur machine. Single stained cells were used to achieve the appropriate compensation settings, and isotype controls were used to ensure veracity of positive staining results (data not shown). Statistical analyses were performed using a paired t-test (using Microsoft Excel software).
As the total number of cells and the percentage of lymphocytes (gated from forward- and side-scatter plots) recovered after anti-CD3 activation did not vary significantly among the different conditions (e.g. minus or plus IFN) (data not shown), the number of lymphocyte subtypes was determined from a total of 25 000 gated lymphocytes.
IL-2 assay
IL-2 levels in supernatants of cultured PBMC were quantified in duplicate using a DuoSet enzyme-linked immunosorbent assay (ELISA) from R&D Systems. The concentration (in pg/ml) was determined using a standard curve with known amounts of IL-2 added to the ELISA plate.
Results
Anti-CD3-mediated stimulation of PBMC induces activation of Tregs and Teffs
While sustained Foxp3 gene expression is required for the suppressive function of natural Tregs,29 its expression is also up-regulated in activated human Teffs.4–6 Thus, a challenge in the study of Tregs in humans is the difficulty in discriminating between recently activated CD25+ FoxP3+ Teffs and the subset of resting Tregs in which FoxP3 can be expressed at similar levels. In this regard, other markers that help to discriminate Tregs from Teffs can be used in combination with FoxP3 expression for the study of freshly isolated and ex vivo activated T cells.4,30 We used unfractionated PBMC rather than purified Tregs/Teffs in order to study them within the context of a broader population of immune cells.
To study the relationship between human natural Tregs and Teffs upon polyclonal activation, total PBMC were stimulated with anti-CD3 (5, 100 or 1000 ng/ml) and the expression of FoxP3, IFN-γ and IL-2 was determined on CD4+ cells by flow cytometry at days 3, 7 and 10, as previously reported.4 This system relies on ‘presentation’ of anti-CD3 antibody to T cells by Fc receptors on antigen-presenting cells, a situation that resembles T-cell receptor (TCR) activation in response to its natural ligand [i.e. peptide/major histocompatibility complex (MHC) complexes] in vivo.4 In addition, as the assay is performed on total PBMC, it avoids the requirement of T-cell purification, a condition that may affect the activation state of the cells.
In the absence of TCR stimulation, rTregs (defined as CD4+ FoxP3lowIFN-γNegIL-2Neg) remained fairly stable at day 3 of culture (compare Figs 1a and 1d). In contrast, as previously described,4 anti-CD3 activation of PBMC induced a dramatic increase in the percentage of FoxP3-positive cells, peaking at day 3 post-stimulation (compare Figs 1d and g, and data not shown). Furthermore, among these cells, two novel cell populations were distinguished based on the expression levels of FoxP3 and the effector cytokines IFN-γ and IL-2. These cells were identified as CD4+ FoxP3HI IFN-γNeg IL-2Neg and CD4+ FoxP3Low IFN-γPos IL-2Pos (Fig. 1g,h), representing activated Tregs and Teffs, respectively.4,6 From these experiments, the highest expression of FoxP3 was observed at day 3 using 100 ng/ml of anti-CD3 (Fig. 1g and data not shown); this concentration was used in the subsequent assays. In addition, aTeffs were further defined as IFN-γPos, which include both FoxP3Neg and FoxP3Low cells.
Figure 1.

Analysis of FoxP3, IFN-γ, IL-2 and Ki-67 expression in CD4+ cells from anti-CD3 activated human PBMC. Freshly isolated PBMC on day 0 (a–c) were incubated in the absence (d–f) or presence of soluble anti-CD3 at 100 (g–i), 5 and 1000 ng/ml (data not shown). Cells were stained for CD4 and FoxP3, as well as IFN-γ (a, d, g), IL-2 (b, e, h) or Ki-67 (c, f, i). Numbers in quadrants indicate the per cent of CD4 T cells. Data are representative of three separate experiments. IFN-γ, interferon-γ; IL-2, interleukin-2; PBMC, peripheral blood mononuclear cells.
In order to address the mechanism of CD4+ FoxP3HI cell generation, we determined the expression of Ki-67, a marker of cell proliferation.31 At day 3 post-TCR stimulation, 20% of CD4+ FoxP3HI cells were Ki-67 positive (Fig. 1i), supporting the conclusion that this cell population is expanded through proliferation.6 Furthermore, to ensure that aTregs emerged from pre-existing ‘natural’ Tregs rather than de novo expression of FoxP3 in non-Tregs, the generation of this cell population was further examined in anti-TCR activated PBMC in which rTregs (i.e. CD25+ cells) were depleted before activation (Fig. 2a; compare whole versus CD25-depleted populations on day 0). In contrast to control PBMC, depletion of CD25+ cells resulted in loss of CD4+ FoxP3HI cells at day 3 post-activation (Fig. 2a; compare whole versus CD25-depleted populations on day 3). Moreover, if carboxyfluorescein succinimidyl ester (CFSE)-labelled CD25Neg cells were reintroduced into these polyclonally activated PBMC, there was significantly greater Teff proliferation in PBMC depleted of Tregs (Fig. 2b). Together, these data provide evidence to support the conclusion that aTregs derive from a starting pool of rTregs within PBMC.
Figure 2.

The distinct CD4+ FoxP3HI cell population in activated PBMC is generated from nTregs. (a) ‘Whole’ or ‘CD25-depleted’ (using magnetic beads; Miltenyi Biotec, Auburn, CA) PBMC were anti-CD3 activated. After 3 days, CD4+ T cells were analysed for CD25 and FoxP3 expression. (b) CFSE-labelled CD25Neg cells were tested by FACS for division by CFSE dilution at day 6 or 9 of culture in anti-CD3-activated whole or CD25-depleted PBMC from (a). Numbers indicate the per cent of cells that have undergone division based on CFSE dilution. Data are representative of two separate experiments. CFSE, carboxyfluorescein succinimidyl ester; FACS, fluorescence-activated cell sorting; nTregs, natural regulatory T cells; PBMC, peripheral blood mononuclear cells.
IFN-α suppresses Treg activation while favouring Teff generation
To study the effect of IFN-I on the generation of aTregs, freshly isolated PBMC were stimulated with anti-CD3 in the absence or presence of human leucocyte IFN (predominantly IFN-α) at 100 or 1000 U/ml or purified recombinant human IFN-β. Then, the total number of CD4 T cells and the generation of aTregs (CD4+ FoxP3HIIFN-γNeg) and aTeffs (CD4+ FoxP3Low/NegIFN-γPos) were analysed for separate normal donors after 3 days of polyclonal activation without or with added IFN-α (Fig. 3) or IFN-β (Fig. S1). While there was no consistent inhibitory or stimulatory effect of IFN-α on total CD4 cell numbers (Fig. 3a,b), there was an average of 42% (P = 0·03) and 50% (P = 0·005) inhibition of aTreg generation in the presence of 100 and 1000 U/ml of IFN-α, respectively (Fig. 3c,d). In contrast, the presence of IFN-α tended to increased the number of aTeff cells with an average of 53% increase in the number of aTeff cells using 1000 Units IFN-α (P = 0·06) (Fig. 3e,f). In contrast, although IFN-β significantly suppressed Treg activation, this cytokine also tended to decrease Teff activation at the higher concentration (Fig. S1). Although the number of donor PBMC tested with IFN-β was limited, the results may suggest that IFNs α and β may exert distinct effects on lymphocyte homeostasis during cell activation.
Figure 3.

IFN-α suppresses Treg activation while increasing the number of activated IFN-γPos Teffs in anti-CD3-stimulated PBMC. PBMC were incubated with medium alone (data not shown), or with anti-CD3 in the absence (control) or presence of 100 or 1000 U/ml of IFN-α. After 3 days, the cells were stained and analysed by FACS for FoxP3 and IFN-γ expression in CD4+ lymphocytes. The numbers of total CD4 T cells, CD4+ FoxP3HIIFN-γNeg aTregs, and CD4+ FoxP3Low/NegIFN-γPos aTeffs are shown in the bar graphs in (a), (c) and (e), respectively. In order to compare the effects of IFN-α between the donors, the data were normalized to controls (which were set as 100%), and averaged over all seven donors for total CD4 T cells (b), aTregs (d), and Teffs (f). The error bars represent the standard deviation. aTregs, activated regulatory T cells; FACS, fluorescence-activated cell sorting; IFN-α, Interferon-alpha; IFN-γ, Interferon-gamma; PBMC, peripheral blood mononuclear cells; Teffs, effector T cells; Treg, regulatory T cell.
As a result of the opposite effects of IFN-α on aTreg and aTeff, there was an alteration in the balance between regulatory and effector cells as represented by the aTreg:aTeff ratio. Across all seven donors, this balance tended to favour aTregs in the absence of IFN-α (average aTreg:aTeff ratio = 1·4). However, the substantial suppression of aTreg generation induced by IFN-α caused a statistically significant shift in the mean aTreg:aTeff ratio for all seven donors [ratio = 0·7 for 100 U IFN-α (P = 0·05) and 0·5 for 1000 U IFN-α (P = 0·01)] such that aTeffs outnumbered aTregs on average by 2:1.
Together, these data suggest that IFN-α significantly suppresses generation of activated Tregs in polyclonally activated PBMC, and at the same time promotes an increase in IFNγ-producing aTeffs.
TLR3 agonism suppresses Treg expansion in an IFN-I-dependent fashion
Viruses commonly stimulate IFN-I production in a variety of target cells by activating several pattern recognition receptors, including TLRs, via their single- and double-stranded DNA and RNA genomes.32 TLR agonists are therefore potent stimulants of IFN-I release by antigen-presenting cells.33 To mimic the immune response observed during viral infections, PBMC were treated overnight with poly(I:C) in order to induce endogenous production of IFN-I. In a preliminary study, we confirmed that poly(I:C) treatment of PBMC from several donors resulted in IFN-α secretion ranging between 30 and 200 pg/ml (data not shown). The addition of poly(I:C) 24 hr prior to anti-CD3 activation led to an average decrease of 40% (P = 0·007) in the production of aTregs (Fig. 4; for cell numbers see Fig. S2). However, in contrast to IFN-α, poly(I:C) had an inconsistent effect on aTeffs (Figs 4 and S2), which may result from the effects of other cytokines (e.g. IFN-β) induced by TLR3 ligation.
Figure 4.

TLR3 agonism suppresses anti-CD3-mediated Treg expansion in an IFN-I-dependent fashion. Prior to the addition of anti-CD3, PBMC were incubated overnight with medium alone (control), or poly(I:C) (n = 8) in the absence or presence of IFNRAB (n = 6), anti-IL-6 (n = 3) or anti-TNF-α (n = 3). After 3 days of anti-CD3 stimulation, the cells were stained and analysed by FACS for FoxP3 and IFN-γ expression in CD4+ cells. The data were normalized to controls (i.e. anti-CD3 alone, which was set as 100%) and averaged to show the per cent change in total CD4 T cells, aTregs and aTeffs. The error bars represent the standard deviation. Cell numbers for total CD4 T cells, aTregs and aTeffs are shown in Fig. S2. aTeffs, activated effector T cells; aTregs, activated regulatory T cells; FACS, fluorescence-activated cell sorting; IFN-I, interferon-I; IL-6, interleukin-6; PBMC, peripheral blood mononuclear cells; TLR3, Toll-like receptor 3; TNF, tumour necrosis factor; Treg, regulatory T cell.
To further address the role of endogenously produced IFN-I in the suppression of aTregs, these assays were also performed in the presence of an antibody that blocks binding of IFN-I to cellular receptors, as well as neutralizing antibodies against TNF-α and IL-6 (Figs 4 and S2). Blocking of IFNα/β receptor produced a significant (P = 0·0001) normalization of Treg activation, with an average recovery of 92% in Treg activation. In contrast, the presence of antibodies against TNF-α and IL-6 had a minimal effect on the suppression of Treg activation induced by poly(I:C).
Taken together, these data suggest that innate signals that mimic the immune response to viral infections are able to suppress Treg activation, and that IFN-I probably plays a major role during this process.
Inhibition of IL-2 production plays an essential role in IFN-α-induced suppression of Treg activation
As IL-2 plays a critical role in Treg development and proliferation,34,35 and because it has previously been shown that IFN-α is a potent inhibitor of IL-2 production,36 we addressed whether the reduced expansion of Tregs in the presence of IFN-α might result from a decrease in IL-2 production in the polyclonally stimulated PBMC cultures. To that end, IL-2 levels in the culture supernatants were measured by ELISA at 24 and 48 hr post anti-CD3 activation of PBMC in the absence or presence of exogenous IFN-α (1000 U/ml) (Fig. 5). IFN-α reduced the production of IL-2 in polyclonally activated PBMC by an average of 45% in the first 24 hr (P = 0·01) and by an average of 55% after 48 hr (P = 0·05) (Fig. 5a). This reduction in IL-2 production correlated with a 66% (P = 0·04) reduction in the generation of aTregs (Fig. 5b). In order to address whether IL-2 inhibition by IFN-α could be reversed in activated PBMC, we tested whether suppression of Treg activation was reversed by exogenous IL-2 (100 Units/ml). Indeed, Treg activation in the presence of IFN-α was improved almost threefold (P = 0·01) by the addition of IL-2 (Fig. 5b), strongly suggesting that down-regulation of endogenous IL-2 production may play a critical role in IFN-α-mediated suppression of Treg activation.
Figure 5.

IFN-α suppresses Treg expansion by inhibiting IL-2 production. (a) PBMC from three separated donors were activated with anti-CD3 without (control) or with 1000 U/ml of IFN-α, and IL-2 was determined in the supernatants by ELISA at 24 and 48 hr post-activation. Values are shown as percentages in which 100% represents IL-2 production in control anti-CD3-stimulated PBMC. Quantification of IL-2 (pg/ml) by ELISA was as follows. Donor 1 at 24 hr minus IFN-α, 202; plus IFN-α, 101; 48 hr minus IFN-α, 34; plus IFN-α, 24. Donor 2 at 24 hr minus IFN-α, 1546; plus IFN-α, 1023; 48 hr minus IFN-α, 1416; plus IFN-α, 452. Donor 3 at 24 hr minus IFN-α, 1020; plus IFN-α, 641; 48 hr minus IFN-α, 597; plus IFN-α, 208. (b) Exogenous IL-2 can restore Treg expansion in the presence of IFN-I. PBMC from three separate donors were activated with anti-CD3 in the absence (control) or presence of 1000 U/ml of IFN-α, or 1000 U/ml of IFN-α plus 100 U/ml of IL-2. After 3 days, the cells were stained and analysed by FACS for FoxP3 and IFN-γ expression in CD4+ cells. The number and mean values of CD4+ FoxP3HIIFN-γNeg Tregs are shown. The error bars represent the standard deviation. ELISA, enzyme linked immunosorbent assay; FACS, fluorescence-activated cell sorting; IFN-α, interferon-alpha; IL-2, interleukin-2; PBMC, peripheral blood mononuclear cells; Treg, regulatory T cell.
SLE as a potential model for IFN-I-mediated Treg imbalance
Cumulative evidence suggests that an abnormal chronic production of IFN-α plays an important role in a number of autoimmune disorders,18,37 probably via several mechanisms.38 Serum from patients with active SLE is known to induce the differentiation of normal monocytes into dendritic cells, and IFN-α is the factor responsible for this effect.39 Following our observations that IFN-α suppresses Treg expansion and, in particular, causes a Teff:Treg imbalance, we sought to determine the effect of the IFN-I activity in SLE plasma on the aTreg:aTeff ratio. In addition, we also sought to reverse the potential effects of SLE plasma on the aTreg:aTeff ratio by blocking the IFN α/β receptor.
To address the question of IFN-I potential within SLE plasma, PBMC from a healthy donor were stimulated with anti-CD3 in the presence of 5% control or SLE plasma. In some experiments, IFN-α/β receptor blocking antibody (IFNRAB) was added 1 hr prior to and then concurrent with the SLE plasma so that it could block signalling from both pre-existing and newly formed IFN-I. Interestingly, SLE plasma induced cell activation more markedly skewed towards aTeffs, resulting in a noticeable drop in aTreg:aTeff ratios (which ranged from 0·13 to 0·43) compared with control plasma from healthy donors (which gave ratios of 0·54 and 0·75) (Fig. 6a). More importantly, the addition of IFNRAB could specifically skew the aTreg:aTeff ratio in favour of aTregs for all four of the SLE plasmas without causing any change in the aTreg:aTeff ratio for the normal plasma (Fig. 6a). These observations suggest that IFN-I is an essential component in SLE plasma which suppresses the activation of Tregs.
Figure 6.
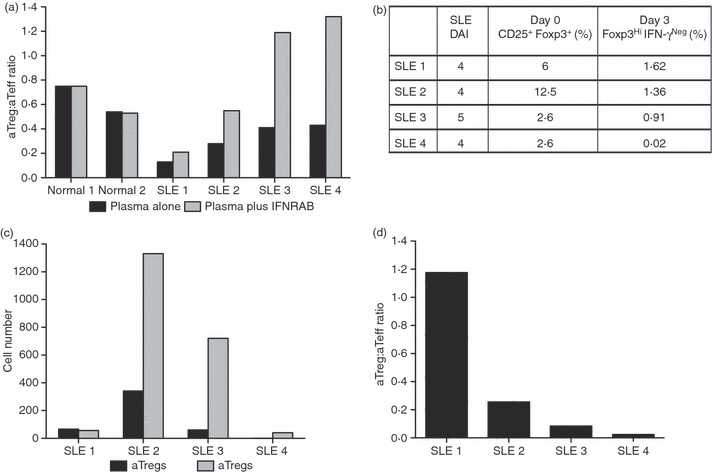
The aTreg:aTeff ratio is altered by the IFN-I environment in SLE. (a) Prior to anti-CD3 activation, PBMC from a healthy donor were incubated overnight with plasma from four patients with SLE with moderate disease activity [SLEDAI shown in (b)] or from two healthy donors, in the absence or presence of IFNRAB. The expansion of Tregs versus Teffs was determined by FACS at day 3 post-anti-CD3 stimulation. The aTreg:aTeff ratio in the absence or presence of IFNRAB is shown in (a). (b–d) PBMCs from the same SLE donors shown in (a) were activated with anti-CD3 to determine Treg and Teff activation. The number of CD4+ CD25+ FoxP3+ cells in freshly isolated cells (day 0) and the expanded Tregs and Teffs at day 3 post-anti-CD3 activation were determined by FACS. The CD4+ CD25+ FoxP3+ starting Treg population and generated CD4+ FoxP3HiIFN-γNeg aTregs (day 0 and day 3, respectively) are expressed in (b) as a percentage of total CD4 T cells. The numbers of aTregs and aTeffs at day 3 post-activation are shown in (c), and the aTreg:aTeff ratio is shown in (d) for each of four SLE donors. aTeff, activated effector T cell; aTreg, activated regulatory T cell; FACS, fluorescence-activated cell sorting; IFN-I, interferon-I; PBMC, peripheral blood mononuclear cells; SLE, systemic lupus erythematosus.
Because immune cells from patients with SLE are chronically exposed to IFN-α,18,24,25 we directly addressed whether the pattern of aTreg:aTeff expansion may be altered in ex vivo activated SLE PBMC. In this regard, it is important to highlight that, considering that the SLE cells had already been exposed to IFN-αin vivo, these assays were performed in freshly isolated SLE PBMC without further addition of exogenous IFN-α. Thus, PBMC from the same four patients with SLE whose plasma showed IFN-I-dependent Treg suppression were stimulated with anti-CD3 antibody as described above. The frequency of cells with aTreg phenotype was determined at day 3 post-activation, as compared with the starting population of CD4+ CD25+ FoxP3+ cells on day 0 (Fig. 6b,c). Surprisingly, although the basal numbers of Tregs as defined by CD4+ CD25+ FoxP3+ in SLE PBMC were within normal limits (Fig. 6b; ranging from 2·6 to 12·5% of total CD4+ cells), there was little to no generation of aTregs at day 3 post-anti-CD3 activation in the SLE PBMC cultures (Fig. 6c). In one patient (SLE 4), essentially no FoxP3HI Tregs were detected at the end of the 3-day culture, even though there appeared to be 2·6% CD4+ CD25+ FoxP3+‘nTregs’ in freshly isolated PBMC (Fig. 6b), strongly suggesting that, in active SLE, aTregs are inefficiently generated from Tregs in response to anti-CD3 stimulation. In contrast, in the same cultures, there was abundant IFN-γPos Teff expansion, resulting on day 3 in very low aTreg:aTeff ratios ranging from 0·02 to 1·2 (Fig. 6d).
Together, these data provide evidence to suggest that both in vitro and in vivo exposure to IFN-α can potentially cause an unbalanced generation of activated Teffs at the expense of Treg activation.
Discussion
The maintenance of immune homeostasis relies on the co-existence of different cell types with unique and sometimes divergent functions, which are co-ordinately activated to achieve initial effector functions in response to pathogens and subsequent immune inactivation after pathogen clearance. However, the mechanisms that define the sequential activation/expansion of effector and regulatory cells are still incompletely understood. In this study, we focused on the potential role of IFN-I in controlling the dynamic balance between Treg and Teff activation during polyclonal T-cell activation in human PBMC. The main findings in the study are that (i) anti-CD3 activation of PBMC induces prominent FoxP3 expression on CD4+ cells and the generation of two major subtypes of FoxP3+ cells, CD4+ FoxP3HIIFN-γNegIL-2Neg aTregs and CD4+ FoxP3Low/NegIFN-γPosIL-2Pos aTeffs; (ii) IFN-I, either exogenously added or endogenously generated by double-stranded RNA stimulation or from plasma of patients with SLE, limits the generation of aTregs, (iii) IFN-α (but not IFN-β) favours Teff expansion, leading to a reduced aTreg:aTeff ratio; (iv) inhibition of IL-2 production during T-cell activation is a potential mechanism involved in IFN-α-induced suppression of aTreg induction; and (v) the in vivo exposure to IFN-α tilts the balance between aTregs and aTeffs towards Teff upon ex vivo expansion of PBMC. Taken together, these findings provide evidence to suggest that, by inhibiting Treg activation and proliferation, the transient IFN-α production in response to a viral infection may co-ordinate the sequential generation of aTeffs and aTregs, and that the Teff:Treg balance may be altered under conditions of chronic IFN-α stimulation.
A potential role of IFN-α in controlling the dynamic generation of regulatory T cells in vivo, both in humans and in mice, is supported by different observations. (i) The transient period of immunosuppression that follows the recovery of primary viral infections coincides with the decline in the production of IFN-I and an increase in the number of Tregs;22,23 (ii) when measles virus is introduced into a mouse deficient in the IFNα/β receptor, this results in significantly higher numbers of Tregs;40 (iii) in vivo treatment of mice with poly(I:C) leads to a decrease in the number of Tregs,41 and (iv) chronic disorders characterized by persistent IFN-α stimulation are frequently associated with low numbers of Tregs and with autoimmunity.18,42–44 Together, these observations and the findings obtained in this study provide a logical and plausible explanation for the negative correlation between IFN-I production and aTreg generation.
The central role of Treg cells in maintaining immune self-tolerance has generated the concept that both Treg number and function represent key factors required for the efficient regulatory effect of Tregs. Thus, a decrease in the number and/or function of these cells is associated with autoimmunity in many instances,6–8 and an abnormal increase in Treg number and/or function may lead to immunosuppression and defective clearance of pathogens or tumours.9,10 In this study, we found that IFN-α alters the balance between Tregs and Teffs by affecting the number of aTregs that are generated upon T-cell activation. Interestingly, in preliminary studies using purified Tregs and Teffs in in vitro suppression assays, we found that IFN-α had no effect on the function of Tregs (data not shown). Similarly, it has also been found that IFN-I does not account for inhibition of Treg function by TLR-ligand-activated dendritic cells.45 Thus, in contrast to other cytokines such as TNF-α which down-modulate Treg function by directly affecting its activity,46 IFN-α appears to modulate Tregs indirectly by containing their activation/proliferation. Indeed, the finding that IL-2 is substantially down-regulated by IFN-α, and that the exogenous addition of IL-2 reverses IFN-α-induced suppression of aTregs, strongly supports the conclusion that IFN-α restrains Treg expansion indirectly via inhibition of IL-2 production, probably from Teffs. In this regard, whereas common γ-chain cytokines such as IL-15 and IL-7 may somewhat compensate for lack of IL-2 in thymic development of Tregs, IL-2 remains the dominant cytokine necessary for maintenance, activation, FoxP3 induction and expansion of Tregs in the periphery.34,35,47–49 Thus, although we cannot discount the possibility that other cytokines relevant for Treg homeostasis may also be inhibited by IFN-α, as our assays are based on activation/expansion of peripheral Tregs (but not thymic Treg development) in which IL-2 (but no other cytokine) appears to play a dominant role,35,47 we strongly believe that IL-2 inhibition is a major mechanism by which IFN-α suppresses Treg activation. Furthermore, as IL-2 is not mandatory to establish Teff functions,35 it may explain the selective effect of IFN-α in suppressing Treg but not Teff activation.
In recent years, the study of patients with SLE has revealed a central role for IFN-α in autoimmune disease pathogenesis. Specifically, it has been proposed that IFN-α causes differentiation of monocytes into myeloid-derived dendritic cells39 and activation of autoreactive T and B cells.19 In a parallel manner, cumulative studies have found that Tregs are decreased in subjects with active SLE,8,50,51 and more recently a fine analysis of CD4+ FoxP3-expressing cells demonstrated that aTregs, but not rTregs, are the prominent population of regulatory T cells that is decreased in SLE.6 However, evidence to suggest whether the two defects (i.e. IFN-α production and Treg number) may be mechanistically related has been missing. The data presented here provide evidence in favour of a model where IFN-α potentially drives the decreased number of aTregs in SLE, a process that may contribute to autoimmunity by preventing the normal activation and expansion of Tregs in response to inflammation. In this regard, the observation that the therapeutic use of IFN-α can lead to autoimmune manifestations52 suggests that such a mechanism may be more broadly applicable to other autoimmune syndromes in which IFN-α plays a pathogenic role.
In summary, this study suggests that IFN-α may play a central role in defining the homeostatic equilibrium between aTeffs and aTregs in response to infection and autoimmunity.
Acknowledgments
This work was supported by the Lupus Research Institute (F.A.) and NIH Grant P30 AR053503 (A.R.). The Hopkins Lupus Cohort is supported by NIH Grant AR 43727 and by the Institute for Clinical and Translational Research (UL1RR025005). A.G. was supported by the T32 Fellowship Grant NIH AR48522-06. We thank Tatiana Romantseva for technical assistance on quantification of IFN-α in tissue culture supernatants and Dr Hana Golding for a critical review of the manuscript.
Disclosures
No disclosures.
Supporting Information
Additional Supporting Information may be found in the online version of this article:
Figure S1. IFN-β suppresses Treg activation in anti- CD3 activated PBMC. PBMC were incubated with medium alone (data not shown), or with anti-CD3 in the absence (control) or presence of 100 or 500 U/ml of IFNβ. After 3 days, the cells were stained and analysed by FACS for FoxP3 and IFN-γ expression in CD4+ lymphocytes. The cell numbers for total CD4 T cells, aTregs and aTeffs are shown for three normal donors in the bar graphs (a), (b) and (c), respectively. In order to compare the effects of IFN-β for different donors, the data were normalized to controls (which were set as 100%), and averaged over all three donors for total CD4 T cells, aTregs and Teffs (d). The error bars represent the standard deviation. aTregs, activated regulatory T cells; aTeffs, activated effector T cells; FACS, fluorescence-activated cell sorting; IFN-beta, interferon-β IFN-α, Interferon-gamma; PBMC, peripheral blood mononuclear cells; Treg, regulatory T cell.
Figure S2. TLR3 agonism suppresses anti-CD3-mediated Treg expansion in an IFN-dependent fashion. Prior to the addition of anti-CD3, PBMC were incubated overnight with medium alone (control), or poly(I:C) (n = 8) in the absence or presence of IFNRAB (n = 6), anti-IL-6 (n = 3) or anti-TNF-α (n = 3). After 3 days of anti-CD3 stimulation, the cells were stained and analysed by FACS for FoxP3 and IFN-γ expression in CD4+ cells. The numbers of total CD4 T cells, aTregs and aTeffs are shown in (a), (b) and (c), respectively. aTeffs, activated effector T cells; aTregs, activated regulatory T cells; FACS, fluorescence- activated cell sorting; IL-6, interleukin-6; IFN, interferon; PBMC, peripheral blood mononuclear cells; Treg, regulatory T cell; TLR3, Toll-like receptor 3; TNF, tumour necrosis factor.
Please note: Wiley-Blackwell are not responsible for the content or functionality of any supporting materials supplied by the authors. Any queries (other than about missing material) should be directed to the corresponding author for the article.
References
- 1.Tang Q, Bluestone JA. The Foxp3+ regulatory T cell: a jack of all trades, master of regulation. Nat Immunol. 2008;9:239–44. doi: 10.1038/ni1572. [DOI] [PMC free article] [PubMed] [Google Scholar]
- 2.Sakaguchi S, Ono M, Setoguchi R, et al. Foxp3+ CD25+ CD4+ natural regulatory T cells in dominant self-tolerance and autoimmune disease. Immunol Rev. 2006;212:8–27. doi: 10.1111/j.0105-2896.2006.00427.x. [DOI] [PubMed] [Google Scholar]
- 3.Hori S, Nomura T, Sakaguchi S. Control of regulatory T cell development by the transcription factor Foxp3. Science. 2003;299:1057–61. doi: 10.1126/science.1079490. [DOI] [PubMed] [Google Scholar]
- 4.Gavin MA, Torgerson TR, Houston E, et al. Single-cell analysis of normal and FOXP3-mutant human T cells: FOXP3 expression without regulatory T cell development. Proc Natl Acad Sci U S A. 2006;103:6659–64. doi: 10.1073/pnas.0509484103. [DOI] [PMC free article] [PubMed] [Google Scholar]
- 5.Ziegler SF. FOXP3: not just for regulatory T cells anymore. Eur J Immunol. 2007;37:21–3. doi: 10.1002/eji.200636929. [DOI] [PubMed] [Google Scholar]
- 6.Miyara M, Yoshioka Y, Kitoh A, et al. Functional delineation and differentiation dynamics of human CD4+ T cells expressing the FoxP3 transcription factor. Immunity. 2009;30:899–911. doi: 10.1016/j.immuni.2009.03.019. [DOI] [PubMed] [Google Scholar]
- 7.Ochs HD, Ziegler SF, Torgerson TR. FOXP3 acts as a rheostat of the immune response. Immunol Rev. 2005;203:156–64. doi: 10.1111/j.0105-2896.2005.00231.x. [DOI] [PubMed] [Google Scholar]
- 8.Valencia X, Lipsky PE. CD4+ CD25+ FoxP3+ regulatory T cells in autoimmune diseases. Nat Clin Pract Rheumatol. 2007;3:619–26. doi: 10.1038/ncprheum0624. [DOI] [PubMed] [Google Scholar]
- 9.Zou W. Regulatory T cells, tumour immunity and immunotherapy. Nat Rev Immunol. 2006;6:295–307. doi: 10.1038/nri1806. [DOI] [PubMed] [Google Scholar]
- 10.Belkaid Y, Tarbell K. Regulatory T cells in the control of host-microorganism interactions (*) Annu Rev Immunol. 2009;27:551–89. doi: 10.1146/annurev.immunol.021908.132723. [DOI] [PubMed] [Google Scholar]
- 11.Lohr J, Knoechel B, Abbas AK. Regulatory T cells in the periphery. Immunol Rev. 2006;212:149–62. doi: 10.1111/j.0105-2896.2006.00414.x. [DOI] [PubMed] [Google Scholar]
- 12.Zelinskyy G, Kraft AR, Schimmer S, Arndt T, Dittmer U. Kinetics of CD8+ effector T cell responses and induced CD4+ regulatory T cell responses during Friend retrovirus infection. Eur J Immunol. 2006;36:2658–70. doi: 10.1002/eji.200636059. [DOI] [PubMed] [Google Scholar]
- 13.Kubo T, Hatton RD, Oliver J, Liu X, Elson CO, Weaver CT. Regulatory T cell suppression and anergy are differentially regulated by proinflammatory cytokines produced by TLR-activated dendritic cells. J Immunol. 2004;173:7249–58. doi: 10.4049/jimmunol.173.12.7249. [DOI] [PubMed] [Google Scholar]
- 14.Chen X, Baumel M, Mannel DN, Howard OM, Oppenheim JJ. Interaction of TNF with TNF receptor type 2 promotes expansion and function of mouse CD4+ CD25+ T regulatory cells. J Immunol. 2007;179:154–61. doi: 10.4049/jimmunol.179.1.154. [DOI] [PubMed] [Google Scholar]
- 15.Pasare C, Medzhitov R. Toll pathway-dependent blockade of CD4+ CD25+ T cell-mediated suppression by dendritic cells. Science. 2003;299:1033–6. doi: 10.1126/science.1078231. [DOI] [PubMed] [Google Scholar]
- 16.O'Sullivan BJ, Thomas HE, Pai S, Santamaria P, Iwakura Y, Steptoe RJ, Kay TW, Thomas R. IL-1 beta breaks tolerance through expansion of CD25+ effector T cells. J Immunol. 2006;176:7278–87. doi: 10.4049/jimmunol.176.12.7278. [DOI] [PubMed] [Google Scholar]
- 17.Shen H, Goldstein DR. IL-6 and TNF-alpha synergistically inhibit allograft acceptance. J Am Soc Nephrol. 2009;20:1032–40. doi: 10.1681/ASN.2008070778. [DOI] [PMC free article] [PubMed] [Google Scholar]
- 18.Banchereau J, Pascual V. Type I interferon in systemic lupus erythematosus and other autoimmune diseases. Immunity. 2006;25:383–92. doi: 10.1016/j.immuni.2006.08.010. [DOI] [PubMed] [Google Scholar]
- 19.Alsharifi M, Lobigs M, Regner M, Lee E, Koskinen A, Mullbacher A. Type I interferons trigger systemic, partial lymphocyte activation in response to viral infection. J Immunol. 2005;175:4635–40. doi: 10.4049/jimmunol.175.7.4635. [DOI] [PubMed] [Google Scholar]
- 20.Zuniga EI, Hahm B, Oldstone MB. Type I interferon during viral infections: multiple triggers for a multifunctional mediator. Curr Top Microbiol Immunol. 2007;316:337–57. doi: 10.1007/978-3-540-71329-6_16. [DOI] [PubMed] [Google Scholar]
- 21.Jiang J, Lau LL, Shen H. Selective depletion of nonspecific T cells during the early stage of immune responses to infection. J Immunol. 2003;171:4352–8. doi: 10.4049/jimmunol.171.8.4352. [DOI] [PubMed] [Google Scholar]
- 22.Alsharifi M, Regner M, Blanden R, Lobigs M, Lee E, Koskinen A, Müllbacher A. Exhaustion of type I interferon response following an acute viral infection. J Immunol. 2006;177:3235–41. doi: 10.4049/jimmunol.177.5.3235. [DOI] [PubMed] [Google Scholar]
- 23.Yu XL, Cheng YM, Shi BS, et al. Measles virus infection in adults induces production of IL-10 and is associated with increased CD4+ CD25+ regulatory T cells. J Immunol. 2008;181:7356–66. doi: 10.4049/jimmunol.181.10.7356. [DOI] [PubMed] [Google Scholar]
- 24.Bennett L, Palucka AK, Arce E, Cantrell V, Borvak J, Banchereau J, Pascual V. Interferon and granulopoiesis signatures in systemic lupus erythematosus blood. J Exp Med. 2003;197:711–23. doi: 10.1084/jem.20021553. [DOI] [PMC free article] [PubMed] [Google Scholar]
- 25.Baechler EC, Batliwalla FM, Karypis G, et al. Interferon-inducible gene expression signature in peripheral blood cells of patients with severe lupus. Proc Natl Acad Sci U S A. 2003;100:2610–5. doi: 10.1073/pnas.0337679100. [DOI] [PMC free article] [PubMed] [Google Scholar]
- 26.Alcocer-Varela J, Alarcon-Segovia D. Decreased production of and response to interleukin-2 by cultured lymphocytes from patients with systemic lupus erythematosus. J Clin Invest. 1982;69:1388–92. doi: 10.1172/JCI110579. [DOI] [PMC free article] [PubMed] [Google Scholar]
- 27.Moulin F, Raymond J, Iniguez JL, Ravilly S, Lebon P, Gendrel D. Serum alpha-interferon in lower respiratory tract infections of children. Pediatr Infect Dis J. 1996;15:883–6. doi: 10.1097/00006454-199610000-00010. [DOI] [PubMed] [Google Scholar]
- 28.De BD, Lebon P, Badoual J, Bompard Y, Dupont C. Rotavirus induces alpha-interferon release in children with gastroenteritis. J Pediatr Gastroenterol Nutr. 1993;16:29–32. doi: 10.1097/00005176-199301000-00006. [DOI] [PubMed] [Google Scholar]
- 29.Wan YY, Flavell RA. Regulatory T-cell functions are subverted and converted owing to attenuated Foxp3 expression. Nature. 2007;445:766–70. doi: 10.1038/nature05479. [DOI] [PubMed] [Google Scholar]
- 30.Popmihajlov Z, Smith KA. Negative feedback regulation of T cells via interleukin-2 and FOXP3 reciprocity. PLoS ONE. 2008;3:e1581. doi: 10.1371/journal.pone.0001581. [DOI] [PMC free article] [PubMed] [Google Scholar]
- 31.Gerdes J, Lemke H, Baisch H, Wacker HH, Schwab U, Stein H. Cell cycle analysis of a cell proliferation-associated human nuclear antigen defined by the monoclonal antibody Ki-67. J Immunol. 1984;133:1710–5. [PubMed] [Google Scholar]
- 32.Randall RE, Goodbourn S. Interferons and viruses: an interplay between induction, signalling, antiviral responses and virus countermeasures. J Gen Virol. 2008;89(Pt 1):1–47. doi: 10.1099/vir.0.83391-0. [DOI] [PubMed] [Google Scholar]
- 33.Kamath AT, Sheasby CE, Tough DF. Dendritic cells and NK cells stimulate bystander T cell activation in response to TLR agonists through secretion of IFN-alpha beta and IFN-gamma. J Immunol. 2005;174:767–76. doi: 10.4049/jimmunol.174.2.767. [DOI] [PubMed] [Google Scholar]
- 34.Malek TR, Yu A, Zhu L, Matsutani T, Adeegbe D, Bayer AL. IL-2 family of cytokines in T regulatory cell development and homeostasis. J Clin Immunol. 2008;28:635–9. doi: 10.1007/s10875-008-9235-y. [DOI] [PubMed] [Google Scholar]
- 35.Malek TR. The biology of interleukin-2. Annu Rev Immunol. 2008;26:453–79. doi: 10.1146/annurev.immunol.26.021607.090357. [DOI] [PubMed] [Google Scholar]
- 36.Zella D, Romerio F, Curreli S, Secchiero P, Cicala C, Zagury D, Gallo CR. IFN-alpha 2b reduces IL-2 production and IL-2 receptor function in primary CD4+ T cells. J Immunol. 2000;164:2296–302. doi: 10.4049/jimmunol.164.5.2296. [DOI] [PubMed] [Google Scholar]
- 37.Baechler EC, Batliwalla FM, Reed AM, Peterson EJ, Gaffney PM, Moser KL, Gregersen PK, Behrens TW. Gene expression profiling in human autoimmunity. Immunol Rev. 2006;210:120–37. doi: 10.1111/j.0105-2896.2006.00367.x. [DOI] [PubMed] [Google Scholar]
- 38.Marshak-Rothstein A. Toll-like receptors in systemic autoimmune disease. Nat Rev Immunol. 2006;6:823–35. doi: 10.1038/nri1957. [DOI] [PMC free article] [PubMed] [Google Scholar]
- 39.Blanco P, Palucka AK, Gill M, Pascual V, Banchereau J. Induction of dendritic cell differentiation by IFN-alpha in systemic lupus erythematosus. Science. 2001;294:1540–3. doi: 10.1126/science.1064890. [DOI] [PubMed] [Google Scholar]
- 40.Sellin CI, Jegou JF, Renneson J, Druelle J, Wild TF, Marie JC, et al. Interplay between virus-specific effector response and Foxp3 regulatory T cells in measles virus immunopathogenesis. PLoS ONE. 2009;4:e4948. doi: 10.1371/journal.pone.0004948. [DOI] [PMC free article] [PubMed] [Google Scholar]
- 41.Scaglione BJ, Salerno E, Gala K, et al. Regulatory T cells as central regulators of both autoimmunity and B cell malignancy in New Zealand Black mice. J Autoimmun. 2009;32:14–23. doi: 10.1016/j.jaut.2008.10.001. [DOI] [PubMed] [Google Scholar]
- 42.Eggena MP, Barugahare B, Jones N, Okello M, Mutalya S, Kityo C, Mugyenyi P, Cao H. Depletion of regulatory T cells in HIV infection is associated with immune activation. J Immunol. 2005;174:4407–14. doi: 10.4049/jimmunol.174.7.4407. [DOI] [PubMed] [Google Scholar]
- 43.Sedaghat AR, German J, Teslovich TM, Cofrancesco J, Jr, Jie CC, Talbot CC, Jr, Siliciano RF. Chronic CD4+ T-cell activation and depletion in human immunodeficiency virus type 1 infection: type I interferon-mediated disruption of T-cell dynamics. J Virol. 2008;82:1870–83. doi: 10.1128/JVI.02228-07. [DOI] [PMC free article] [PubMed] [Google Scholar]
- 44.Chase AJ, Yang HC, Zhang H, Blankson JN, Siliciano RF. Preservation of FoxP3+ regulatory T cells in the peripheral blood of human immunodeficiency virus type 1-infected elite suppressors correlates with low CD4+ T-cell activation. J Virol. 2008;82:8307–15. doi: 10.1128/JVI.00520-08. [DOI] [PMC free article] [PubMed] [Google Scholar]
- 45.Peng G, Guo Z, Kiniwa Y, et al. Toll-like receptor 8-mediated reversal of CD4+ regulatory T cell function. Science. 2005;309:1380–4. doi: 10.1126/science.1113401. [DOI] [PubMed] [Google Scholar]
- 46.Valencia X, Stephens G, Goldbach-Mansky R, Wilson M, Shevach EM, Lipsky PE. TNF downmodulates the function of human CD4+ CD25hi T-regulatory cells. Blood. 2006;108:253–61. doi: 10.1182/blood-2005-11-4567. [DOI] [PMC free article] [PubMed] [Google Scholar]
- 47.D’Cruz LM, Klein L. Development and function of agonist-induced CD25+ Foxp3+ regulatory T cells in the absence of interleukin 2 signaling. Nat Immunol. 2005;6:1152–9. doi: 10.1038/ni1264. [DOI] [PubMed] [Google Scholar]
- 48.Bayer AL, Lee JY, de la BA, Surh CD, Malek TR. A function for IL-7R for CD4+ CD25+ Foxp3+ T regulatory cells. J Immunol. 2008;181:225–34. doi: 10.4049/jimmunol.181.1.225. [DOI] [PMC free article] [PubMed] [Google Scholar]
- 49.Wuest TY, Willette-Brown J, Durum SK, Hurwitz AA. The influence of IL-2 family cytokines on activation and function of naturally occurring regulatory T cells. J Leukoc Biol. 2008;84:973–80. doi: 10.1189/jlb.1107778. [DOI] [PMC free article] [PubMed] [Google Scholar]
- 50.Miyara M, Amoura Z, Parizot C, et al. Global natural regulatory T cell depletion in active systemic lupus erythematosus. J Immunol. 2005;175:8392–400. doi: 10.4049/jimmunol.175.12.8392. [DOI] [PubMed] [Google Scholar]
- 51.Suen JL, Li HT, Jong YJ, Chiang BL, Yen JH. Altered homeostasis of CD4(+) FoxP3(+) regulatory T-cell subpopulations in systemic lupus erythematosus. Immunology. 2009;127:196–205. doi: 10.1111/j.1365-2567.2008.02937.x. [DOI] [PMC free article] [PubMed] [Google Scholar]
- 52.Borg FA, Isenberg DA. Syndromes and complications of interferon therapy. Curr Opin Rheumatol. 2007;19:61–6. doi: 10.1097/BOR.0b013e328010c547. [DOI] [PubMed] [Google Scholar]
Associated Data
This section collects any data citations, data availability statements, or supplementary materials included in this article.