

Abstract
Background
Although TRIzol is widely used for preservation and isolation of RNA, there is suspicion that prolonged sample storage in TRIzol may affect array-based gene expression profiling (GEP), via premature termination during reverse transcription (RT).
Methods
GEP on Illumina arrays compared paired aliquots (cryopreserved or stored in TRIzol) of primary samples of multiple myeloma (MM) and acute myeloid leukemia (AML). Data were analyzed at the “probe level” (a single consensus value) or “bead level” (multiple measurements provided by individual beads).
Results
TRIzol storage does not affect standard probe-level comparisons between sample groups: different preservation methods did not generate differentially-expressed probes (DEPs) within MM or AML sample groups, or substantially affect the many DEPs distinguishing between these groups. Differences were found by gene set enrichment analysis, but were dismissible because of instability with permutation of sample labels, unbalanced restriction to TRIzol aliquots, inconsistency between MM and AML groups, and lack of biological plausibility. Bead-level comparisons found many DEPs within sample pairs, but most (73%) were <2-fold changed. There was no consistent evidence that TRIzol causes premature RT termination. Instead, a subset of DEPs were systematically due to increased signals in TRIzol-preserved samples from probes near the 5’ end of transcripts, suggesting better mRNA preservation with TRIzol.
Conclusions
TRIzol preserves RNA quality well, without a deleterious effect on GEP. Samples stored frozen with and without TRIzol may be compared by GEP with only minor concern for systematic artifacts.
Impact
The standard practice of prolonged sample storage in TRIzol is suitable for GEP.
Keywords: gene expression profiling, RNA preservation, microarray, TRIzol
Introduction
The TRIzol® reagent from Invitrogen is a mono-phasic solution of phenol and guanidine isothiocyanate, based on the single-step RNA isolation method developed by Chomczynski and Sacchi.(1) TRIzol is widely used for the isolation of RNA, and investigators often use it for preservation as well, placing fresh samples into TRIzol for freezing and storage at -80 °C, then thawing the samples later for completion of the RNA isolation procedure. However, there is undocumented suspicion that prolonged storage of tissues prior to RNA isolation, even at -80 °C, can cause chemical modification (depurination) of RNA. In theory, this could result in early termination during reverse transcription (RT) of mRNA molecules, potentially affecting gene expression profiling (GEP) more strongly for transcripts with probes located farther from the 3’ end. We decided to investigate effects of long-term TRIzol storage by comparing paired aliquots of primary tumor samples collected for research purposes and frozen in TRIzol or viably-frozen with dimethyl sulfoxide (DMSO).
Materials and Methods
Samples
Bone marrow aspirate samples of acute myeloid leukemia (AML) were collected and processed by the Leukemia Sample Bank at MDACC between 1997 and 2006 under an Institutional Review Board (IRB) approved protocol, and stored in liquid nitrogen freezers. Informed consent was obtained in accordance with the Declaration of Helsinki. Primary tumor samples of multiple myeloma (MM) were similarly collected for processing and storage under an IRB-approved protocol by the Myeloma Tissue Bank since its inception in 2007. From these banks we selected samples of AML (Ficoll-purified, CD3- and CD19-depleted) and MM (CD138+) for which paired aliquots had been stored frozen in TRIzol (“Tri”) or cryopreservation medium (“Cryo”, RPMI + 20% fetal calf serum + 10% DMSO) since the time of initial isolation (range, 1-9 years).
RNA isolation, cRNA generation, and microarray data generation
Cryo aliquots were quickly thawed, washed, and placed in TRIzol, then total RNA was isolated from all aliquots as per the TRIzol manufacturer’s instructions (Invitrogen). RNA quality was assessed with a Bioanalyzer 2100 (Agilent). RNA from 12 sample pairs (6 AML, 6 MM), all with an RNA integrity number (RIN) > 7, was further purified with Qiagen RNAeasy columns. From 300 ng of total RNA, the Illumina® TotalPrep RNA Amplification Kit (Ambion) was used to generate amplified, biotinylated cRNA after RT by the Eberwine procedure. 750 ng of cRNA was hybridized overnight to Illumina HT-12 BeadArrays, which were then washed and stained with streptavidin-Cy3 (Amersham-Pharmacia Biotech) as per the Illumina protocol. Arrays were scanned on a BeadArray Reader (Illumina) at the Biomarker Core Laboratory Services at the University of Texas Health Science Center at Houston. The 6 MM Tri/Cryo paired samples were hybridized to one HT-12 array, and the 6 AML paired samples to another array.
Probe-level GEP data processing
Specific transcripts within the biotinylated cRNA are measured by fluorescent imaging after direct hybridization to HT-12 bead arrays, which contain 12 arrays per slide, each with an average of 15 beads for each of 48,803 probes measuring 37,846 annotated genes and additional transcripts. Raw measurements of each bead’s intensity were captured directly and processed as “bead-level” for the MM samples, as described below. For both MM and AML samples, measurements were processed as “probe-level” data by GenomeStudio software (Illumina). GenomeStudio checks that a probe has ≥3 beads present on the array (if not, the probe is considered to be missing), performs a local background subtraction for each bead, then condenses bead-level data to a single probe-level value per probe by removing outliers greater than 3 median absolute deviations (MADs) from the median, recalculating the mean of the remaining values.(2) Raw probe-level values were extracted from GenomeStudio, without using its correction or normalization options, but using its option for imputing missing values. Values for each were then corrected using the model-based background correction (MBCB) method, which uses values for negative control probes to estimate and remove the nonspecific signal component for each transcript probe, with non-parametric estimation.(3) Corrected values from the two arrays were combined into an integrated array, containing 12 Tri/Cryo pairs, and quantile-normalized.(4) Non-significantly detected probes are defined by GenomeStudio as having intensity no greater than that of a negative control probe (p<=0.05), based on the normal distribution and the mean and SD of negative control probes.(5) Intensities of non-significantly detected probes in a particular sample aliquot were reset to the p = 0.05 value of the negative control distribution, i.e., the detection threshold, so that fold-change differences between paired significant and non-significantly detected probes were kept to a conservative minimum. We further excluded control probes and the ~20% of probes whose sequences are not perfect or good matches to actual transcripts,(6) and log2-transformed the probe-level data.
Bead-level GEP data processing
To process bead level data from the MM sample array, and take advantage of the statistical power inherent in many measurements of each transcript, i.e., one for each bead, we employed a procedure using open-source and original software, modified from the approach of Dunning et al.(7):
Extract bead level data.
Perform local background correction.
Discard outlier beads > 3 MAD from the median of transcript probes.
Perform MBCB correction of bead values.
Discard transcript probes with < 3 remaining beads.
Perform quantile normalization of bead values for the entire integrated array.
Exclude control probes (for biotin, housekeeping genes, Cy3 hybridization, labeling, low stringency hybridization, and negative controls).
Exclude the ~20% of probes which are not perfect or good matches to actual transcripts.(6)
Perform log2 of bead-level data.
Comparative analysis of TRIzol effect
Exploratory analysis to find differentially-expressed probes (DEPs) was done separately for probe-level and bead-level data. Probe-level data from groups of MM and AML samples were compared by t tests with false discovery rate (FDR) correction for multiple comparisons,(8) and included paired t tests where appropriate. For bead-level data, comparisons were made between Tri/Cryo pairs for each of the 6 MM samples by t tests with FDR control, excluding probe comparisons in which the bead summary value (defined as the mean) for both arrays of a pair was beneath the detection threshold (calculated similarly to the GenomeStudio method).
Analysis of TRIzol effect relative to probe location
For all probes, we determined the distance between the probe target sequence and the 5’ end of its target transcript, the “5-prime end distance”, which is simply the start site nucleotide number of the probe (from “PROBE_START” in GenomeStudio). We also calculated the distance between the probe target sequence and the 3’ end, the “3-prime end distance”, by subtracting the start site nucleotide number from the full length of the mRNA (from human.rna.gpff, downloaded from NCBI FTP). These were then used to examine a positional effect of TRIzol by 3 methods of analysis: 1) Bead-level DEPs were divided into Up-DEPs and Down-DEPs according to whether the bead summary value was higher or lower, respectively, in Tri versus Cryo. The Wilcoxon rank-sum test was then used to determine whether the distribution of 3-prime end distances differed between the Up-DEPs and Down-DEPs.
2) Differences in probe intensity between Tri and Cryo sample pairs were examined as a function of the probe distance from the 5’ or 3’ transcript end. For a given sample pair, absolute differences between probe-level intensity values for all probes with at least one significantly-detected value were summed in a running cumulative score with increasing distance from the 5’ or 3’ end.
3) Pairs of probes recognizing the same transcript were examined as to whether the ratio of their probe-level intensities (5’/3’) for Tri arrays differed from those for the corresponding Cryo arrays. For each gene, it was required that all 4 measurements (2 probes each for both Tri and Cryo) were significantly detected. For genes in which there were more than 2 probes meeting these criteria, a single comparison was made between the most 5’ probe and the most 3’ probe.
Results
TRIzol helps to preserve RNA quality
The RNA integrity number (RIN), a measure of RNA quality generated by the Agilent Bioanalyzer 2100, was ≥ 9 for all 12 AML Tri, 6 of 12 AML Cryo, all 6 MM Tri, and 3 of 6 MM Cryo samples (Supplemental Table S1). 6 pairs of AML samples with high RIN values, and all 6 MM pairs, were processed further to generate cRNA.
TRIzol does not negatively affect cRNA generation
Bioanalyzer-generated histograms assessing cRNA quality were similar for all sample aliquots, suggesting no early termination of RT due to TRIzol (data not shown). cRNA quantity was generally slightly higher from Tri samples, but Cryo samples also yielded well more than the 750 ng required for array hybridization (data not shown).
Probe-level comparisons show little effect of TRIzol storage
Table 1 shows the results of t and paired t tests comparing probe-level data from groups of samples, arranged by disease (MM or AML) and preservation method (Tri or Cryo). At an FDR of 0.1, no DEPs were found by within-disease comparisons, whether by group or paired t tests, whereas many DEPs were found by between-disease comparisons, with substantial overlap (Table S2). We also compared within-disease gene expression profiles between Tri and Cryo aliquots by gene set enrichment analysis (GSEA), an increasingly-used method to identify sets of genes that implicate biological processes or other explanations of differences, even when fold-changes of individual genes are too low to be significant by t tests.(9) Perhaps due to this lesser requirement for fold change, a large number of gene sets were enriched among genes more highly expressed in Tri aliquots of the 6 MM samples (data not shown), even with an FDR of 0.25 commonly used for GSEA. However, the validity of these GSEA findings was questioned by several observations: the enriched gene sets did not support a plausible or consistent biological interpretation; they were substantially affected by permutation of sample labels; no gene sets were enriched among genes less highly expressed in Tri aliquots of MM samples; and of the few gene sets enriched in the 6 AML samples, only 2 were also enriched in MM samples.
Table 1.
Number of DEPs by found in probe-level comparisons between samples, grouped by disease and preservation method, by t tests with FDR <0.1.
| t test | Group#1 | Group#2 | Down-DEPs | Up-DEPs | Total probes | Total DEPs, % |
|---|---|---|---|---|---|---|
| Paired | MM/Tri | MM/Cryo | 0 | 0 | 13976 | 0 |
| Paired | AML/Tri | AML/Cryo | 0 | 0 | 15972 | 0 |
| Group | MM/Tri | MM/Cryo | 0 | 0 | 13976 | 0 |
| Group | AML/Tri | AML/Cryo | 0 | 0 | 15972 | 0 |
| Group | MM/Tri | AML/Tri | 3613 | 2803 | 15990 | 40.13 |
| Group | MM/Tri | AML/Cryo | 3341 | 2697 | 16016 | 37.70 |
| Group | MM/Cryo | AML/Cryo | 3468 | 2995 | 15971 | 40.47 |
| Group | MM/Cryo | AML/Tri | 3704 | 3093 | 16033 | 42.39 |
We also considered the effect of length of storage in TRIzol, which for AML samples varied from 2 to 9 years (all MM samples had been stored for < 2 years). The correlation coefficient for pairs of AML samples, considering all eligible probes (those with at least one significantly-detected value), ranged from 0.957 to 0.988 with no consistent effect of storage time. There was a slight decrease in the slope of the Cryo/Tri regresssion line over time, from 0.982 to 0.956.
Bead-level comparison of MM samples shows an effect of TRIzol on GEP results
To test further whether TRIzol storage has an effect on GEP results, we then employed the greater statistical power of comparisons based on processed bead-level data, available only for the 6 MM samples. As shown in Table 2, we found a surprisingly large number of DEPs when Tri/Cryo MM sample pairs were compared by t tests, for all eligible probes. Comparisons of GEP data usually consider not just the number of DEPs but their fold-change. As shown in Figure 1, the log2 magnitude of fold-change in DEPs between MM pairs was generally small, with the majority being less than 1, i.e. either a 2-fold increase or decrease. Figure 1 also shows that with some exceptions, the DEPs of highest fold-change were mostly in the Up-DEP group, i.e. those higher in the Tri aliquot.
Table 2.
Number of DEPs by found in bead-level comparisons between paired MM samples, by t tests with FDR <0.1.
| Pair | Up-DEPs (%)1 | Down-DEPs (%)1 | Farther from 3’ end2 | p value3 |
|---|---|---|---|---|
| 1 | 1212 (8.8) | 1130 (8.2) | Up-DEPs | <2.2e-16 |
| 2 | 745 (5.6) | 1126 (8.4) | Up-DEPs | 1.9e-13 |
| 3 | 1174 (8.6) | 2594 (19.0) | Down-DEPs | <2.2e-16 |
| 4 | 821 (7.0) | 712 (6.0) | Up-DEPs | 2.5e-5 |
| 5 | 164 (1.2) | 109 (0.8) | Down-DEPs | 0.06 |
| 6 | 894 (6.6) | 767 (5.6) | Up-DEPs | <2.2e-16 |
Number of DEPs in the indicated direction; “Up” means higher mean value in Tri than in Cryo, “Down” is lower in Tri. Value in parentheses is the percentage of DEPs among the total number of eligible filtered probes.
Indicates which DEP set (Up or Down) is significantly farther from the transcript 3’ end.
p value of the Wilcoxon rank test in comparing Up- vs. Down-DEPs in distance from the transcript 3’ end.
Figure 1.
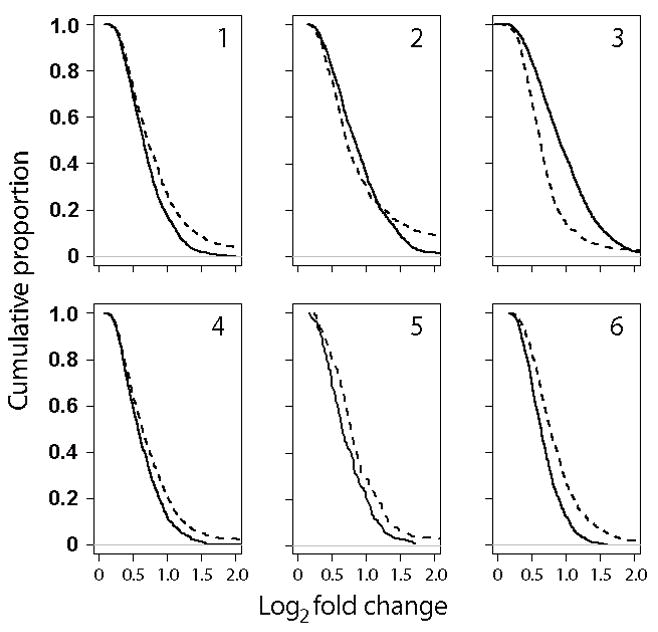
Cumulative frequency of log2 fold-change magnitude of DEPs between MM sample pairs. Absolute values are shown for Up-DEPs (higher in Tri, dashed line) and Down-DEPs (lower in Tri, solid line).
To assess whether these differences in bead-level were “real”, as opposed to being an artifact of excessive statistical power, we subdivided bead-level data for eligible probes, and at least 10 beads on each array, randomly assigning the beads into 2 subarrays. Comparisons showed many DEPs for between-sample subarrays, but not for within-sample subarrays, confirming the difference in data between sample pairs (Table 3).
Table 3.
Number of DEPs found after subviding bead-level data. For each MM sample pair, and each eligible probe with at least 10 bead values in each pair, Tri and Cryo GEP data (designated as “1” or “2”, respectively) were each randomly assigned to either “A” or “B” subarrays. Subarrays were then compared by t tests with FDR <0.1.
| 1A vs. 1B | 2A vs. 2B | 1A vs. 2A | 1B vs. 2A | 1A vs. 2B | 1B vs. 2B | |
|---|---|---|---|---|---|---|
| Pair 1 | 0 | 0 | 482 | 519 | 619 | 584 |
| Pair 2 | 1 | 0 | 460 | 506 | 422 | 474 |
| Pair 3 | 0 | 0 | 1182 | 1089 | 1093 | 1137 |
| Pair 4 | 0 | 0 | 291 | 268 | 261 | 222 |
| Pair 5 | 0 | 0 | 17 | 15 | 12 | 12 |
| Pair 6 | 0 | 0 | 370 | 384 | 362 | 405 |
Next, to determine whether the particular DEPs observed were systematic, i.e., occurring in multiple sample comparisons more frequently than expected from chance, we used hypergeometric distribution tests to examine the overlap of DEPs found in pairs of sample comparisons. The number of eligible probes used for the DEP determinations differed between samples, and evaluation of the likelihood significance of overlap was done using the most conservative denominator, i.e. the intersection of eligible probes from each sample. The overlap of DEPs was highly significant for almost all pairwise comparisons of samples 1, 2, 4, and 6 (Table S3). Although further analysis showed that the number of overlapping DEPs between these 4 samples declined considerably as the number of samples compared was increased (data not shown), and DEPs were generally not overlapping in combinations involving samples 3 or 5 (Table S3), these results suggest that there was some systematic basis for the DEPs found by bead-level comparisons.
In order to understand the systematic basis of DEP overlap in samples 1, 2, 4, and 6, we examined DEP intensities with respect to probe location. The distance from the transcript 3’ end potentially provides information about the efficiency of RT, and therefore whether the “TRIzol hypothesis” of premature termination of RT is correct. Table 2 showed that for all sample pairs except #5, the Up-DEPs (higher in TRIzol) and Down-DEPs differed significantly in their “3-prime end distance”. In pairs 1, 2, 4, and 6, the Up-DEPs were located farther from the 3’ end of their target transcript. This is the opposite of what is expected if the “TRIzol hypothesis” of premature RT termination is correct. An alternative hypothesis is that the effect of probe location may be due to the positional tendency of mRNA degradation. This is not straightforward, since mRNA degradation can be a specific process by which mRNA stability is regulated in living cells, or a potentially artifactual process occurring in cells damaged during preservation and handling. Furthermore, in living eukaryotes, general pathways of mRNA degradation can proceed from either end, although the most frequently cited pathway involves initial shortening of the 3’ poly(A) tail followed by decapping of the 5’ methylguanosine cap, exposing the mRNA body to 5’-to-3’ exonuclease digestion.(10-13) In theory, initial shortening of the 3’ poly(A) tail would apply to all transcripts regardless of length, and the effect on the GEP methods used here would be a global reduction on cRNA yield. However, 5’-to-3’ exonuclease digestion would have a biased effect, reducing the intensity for probes near the 5’ transcript end. Perhaps as a result, the GEP literature generally states that mRNA degradation starts at the 5’ end of transcripts,(14, 15) and the 3’/5’ intensity ratios for multiprobed “housekeeping” genes on Affymetrix arrays has been used for assessing RNA quality.(16-19) These observations specify an alternate hypothesis: that there is less mRNA degradation in TRIzol-preserved samples than in cryopreserved samples, with better preservation of the 5’ portions of transcripts. This is consistent with the Bioanalyzer RIN values, which were higher in the Tri samples. By this hypothesis, the preservation method with less degradation is expected to have artifactual Up-DEPs for probes closer to the 5’ end of transcripts, which on average are farther from the transcript 3’ end, and this is what was observed for Tri in samples 1, 2, 4, and 6. Quantile normalization would not eliminate this effect, although it may reduce its magnitude.
To test this alternate hypothesis further, we compared probe-level normalized intensities for all eligible probes, as to whether the Tri or Cryo value was higher, as a function of the distance from the 5’ end of the corresponding transcripts. A running cumulative score of the intensity differences shows that Tri values were higher near the 5’ end for MM samples 1, 2, 4, and 6 (Figure 2), supporting the alternate hypothesis for these sample pairs. Sample 5 showed little position effect, whereas sample 3 showed a mixed effect of position. Position effects were inconsistent when using the 3-prime end distance, and among AML samples (data not shown).
Figure 2.

Effect of preservation method on probe intensity, as a function of the distance of the probe from the 5’ end of the targeted transcript. For each MM sample pair and eligible probe, the intensity difference between probe level data (Tri – Cryo) is calculated, then a cumulative sum is calculated over increasing distance.
In a third analysis of the relationship between probe position and preservation method, we examined probe-level data for pairs of DEPs that measured the same transcript. For each sample probe pair and preservation method (Tri or Cryo), we divided the intensity of the probe farther from the 3’ end (5’) by that of the probe nearer to the 3’ end (3’). The rationale behind this analysis is that the same object (i.e., the expressed transcript) is being measured by the two probes; if the 5’/3’ ratio is different between the two preservation methods, it provides evidence for differences in the lengths of cRNA generated from the two samples. We limited this analysis to the 325 pairs of probes that targeted the same transcript and exceeded the detection threshold for all 48 measurements (12 samples, 2 arrays each, 2 probes per transcript). For these 325 pairs, we computed the 5’/3’ intensity ratio for each of the 12 samples and preservation methods, and then compared the median of the ratios of Tri arrays to that of Cryo arrays. 209 pairs had higher median ratios for Tri than Cryo, which was significantly more than the 116 pairs with higher Cryo ratios (p = 1.4E-07 by the binomial distribution). We then compared the 5’/3’ Tri and Cryo median ratios for each of the 325 probes, creating a “ratio of ratios” (RR). For the 209 probes with a higher Tri 5’/3’ ratio (RR1), we divided the Tri array ratio by that of the Cryo array, and for the 116 probes with a higher Cryo 5’/3’ ratio (RR2), we divided the Cryo ratio by that of the Tri array. Figure 3 shows that RR1 is consistently higher than RR2. Therefore, not only is the RR more often higher for Tri arrays than for Cryo arrays (209 vs. 116), the magnitude of its increases are greater than those of its decreases. Again, this is the opposite of what is predicted by the TRIzol hypothesis of premature RT termination, and supports the alternative hypothesis that there is less mRNA degradation in TRIzol-preserved samples than in cryopreserved samples.
Figure 3.
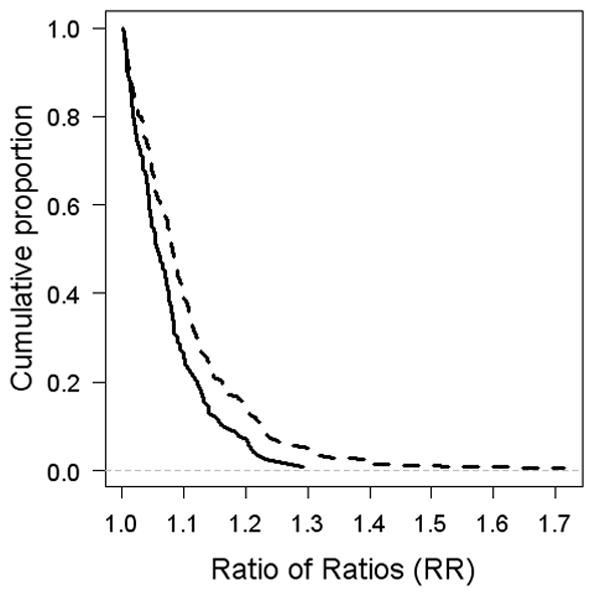
“Ratio of ratios” for pairs of probes recognizing the same transcript. 325 pairs of probes were significantly detected in all MM and AML samples, on both Tri and Cryo arrays. For each probe pair, the intensity ratios of 5’ and 3’ probes were calculated for each sample and preservation method, then the medians for Tri vs. Cryo compared. For the 209 probes with a higher Tri 5’/3’ ratio, the Tri array ratio is divided by that of the Cryo array (dashed line). For the 116 probes with a higher Cryo 5’/3’ ratio, the Cryo ratio is divided by that of the Tri array (solid line).
Discussion
Our results support 3 conclusions:
1) TRIzol preservation should not produce artifactual differences in the usual way by which gene expression profiling is done
Gene expression data are usually at the probe level, i.e., a single value per probe in each sample, and are commonly analyzed by comparisons between groups of samples, e.g., using t tests. We found that comparisons between groups of paired samples differing in preservation method, even using paired t tests, failed to generate DEPs at the FDR level of 0.1. We found significant enrichment of gene sets by GSEA, which is more sensitive to changes of low fold-change; however, certain unusual features of these (sensitivity to permutation, lack of biological plausibility, etc.) should serve to prevent their being interpreted as true differences.
2) TRIzol preservation may produce differences by bead-level comparisons to samples not preserved in TRIzol, but those differences are mostly of low fold-magnitude
The number of DEPs in paired Tri vs. Cryo bead-level comparisons was surprisingly high, although generally of low fold-magnitude. Splitting of the data confirmed that this was not the result of high-power bead-level comparison, i.e., there were actual differences in the bead-level data. Because we did not perform technical replicates with the same sample and preservation method, we cannot exclude that the origin of these differences is methodologic, i.e., introduced at or downstream of the point of RNA isolation in the GEP process. However, that seems unlikely given the evidence, at least for some samples, that differences were related to probe position. Therefore, our data suggest that bead-level comparisons may be made, with caution (use of fold-change threshold, etc.) and consideration of potential position-dependent effects, between samples irrespective of whether or not they have been preserved in TRIzol.
3) To the extent that bead-level differences between samples attributable to preservation method (with TRIzol vs. without TRIzol) are consistent and of higher fold-magnitude, they may be the result of better RNA preservation with TRIzol
Where we did observe a consistent TRIzol effect in bead-level comparisons, it supported the hypothesis that TRIzol has a beneficial effect on RNA quality, with a particular effect on enhancing the intensity of signals from probes near the 5’ end of transcripts. At the least, this is evidence against the hypothesis of depurination and premature RT termination. We compared TRIzol-preserved specimens to their cryopreserved counterparts, the latter of which unavoidably had to undergo thawing and washing before being placed in TRIzol for RNA isolation. This provided an opportunity for RNA degradation not experienced by the TRIzol-preserved specimens, and therefore differences may have resulted from this process, rather than during prolonged low-termperature storage. A better comparison would have been between TRIzol aliquots vs. aliquots snap-frozen and stored without TRIzol, then thawed in TRIzol. However, such paired samples were not available to us, and we wanted to test the effects of long-term storage in the “real-world” context of samples from tissue banks whose quality has been shown in studies of other types. Our results suggest that rather than being a potential source of artifacts in GEP analysis, sample preservation in TRIzol may be an optimal method, and should be continued by those who have been using it for many years.
Supplementary Material
Acknowledgments
Grants supporting the sample/tissue bank cores include NIH grants 2P01 CA55164-05A1 and P50 CA100632-01.
Abbreviations
- GEP
gene expression profiling
- Tri
TRIzol
- Cryo
cryopreserved
- AML
acute myeloid leukemia
- MM
multiple myeloma
- RT
reverse transcription
- DEP
differentially-expressed probe
- MDACC
University of Texas-M. D. Anderson Cancer Center
- IRB
Institutional Review Board
- RIN
RNA integrity number
- MAD
median absolute deviation from the median
- MBCB
model-based background correction
- FDR
false discovery rate
References
- 1.Chomczynski P, Sacchi N. The single-step method of RNA isolation by acid guanidinium thiocyanate-phenol-chloroform extraction: twenty-something years on. Nat Protoc. 2006;1:581–5. doi: 10.1038/nprot.2006.83. [DOI] [PubMed] [Google Scholar]
- 2.Dunning MJ, Thorne NP, Camilier I, Smith ML, Tavaré S. Quality control and low-level statistical analysis of Illumina beadarrays. REVSTAT Statistical Journal. 2006;4:1–30. [Google Scholar]
- 3.Ding LH, Xie Y, Park S, Xiao G, Story MD. Enhanced identification and biological validation of differential gene expression via Illumina whole-genome expression arrays through the use of the model-based background correction methodology. Nucleic Acids Res. 2008;36:e58. doi: 10.1093/nar/gkn234. [DOI] [PMC free article] [PubMed] [Google Scholar]
- 4.Bolstad BM, Irizarry RA, Astrand M, Speed TP. A comparison of normalization methods for high density oligonucleotide array data based on variance and bias. Bioinformatics. 2003;19:185–93. doi: 10.1093/bioinformatics/19.2.185. [DOI] [PubMed] [Google Scholar]
- 5.Illumina Corporation. GenomeStudio™ Gene Expression Module v1.0 User Guide. [Google Scholar]
- 6.Barbosa-Morais NL, Dunning MJ, Samarajiwa SA, et al. A re-annotation pipeline for Illumina BeadArrays: improving the interpretation of gene expression data. Nucleic Acids Res. 2010;38:e17. doi: 10.1093/nar/gkp942. [DOI] [PMC free article] [PubMed] [Google Scholar]
- 7.Dunning MJ, Barbosa-Morais NL, Lynch AG, Tavaré S, Ritchie ME. Statistical issues in the analysis of Illumina data. BMC Bioinformatics. 2008;9:85. doi: 10.1186/1471-2105-9-85. [DOI] [PMC free article] [PubMed] [Google Scholar]
- 8.Hochberg Y, Benjamini Y. More powerful procedures for multiple significance testing. Stat Med. 1990;9:811–8. doi: 10.1002/sim.4780090710. [DOI] [PubMed] [Google Scholar]
- 9.Subramanian A, Tamayo P, Mootha VK, et al. Gene set enrichment analysis: a knowledge-based approach for interpreting genome-wide expression profiles. Proc Natl Acad Sci U S A. 2005;102:15545–50. doi: 10.1073/pnas.0506580102. [DOI] [PMC free article] [PubMed] [Google Scholar]
- 10.Wilusz CJ, Wormington M, Peltz SW. The cap-to-tail guide to mRNA turnover. Nat Rev Mol Cell Biol. 2001;2:237–46. doi: 10.1038/35067025. [DOI] [PubMed] [Google Scholar]
- 11.Parker R, Song H. The enzymes and control of eukaryotic mRNA turnover. Nat Struct Mol Biol. 2004;11:121–7. doi: 10.1038/nsmb724. [DOI] [PubMed] [Google Scholar]
- 12.Meyer S, Temme C, Wahle E. Messenger RNA turnover in eukaryotes: pathways and enzymes. Crit Rev Biochem Mol Biol. 2004;39:197–216. doi: 10.1080/10409230490513991. [DOI] [PubMed] [Google Scholar]
- 13.Yamashita A, Chang TC, Yamashita Y, et al. Concerted action of poly(A) nucleases and decapping enzyme in mammalian mRNA turnover. Nat Struct Mol Biol. 2005;12:1054–63. doi: 10.1038/nsmb1016. [DOI] [PubMed] [Google Scholar]
- 14.Popova T, Mennerich D, Weith A, Quast K. Effect of RNA quality on transcript intensity levels in microarray analysis of human post-mortem brain tissues. BMC Genomics. 2008;9:91. doi: 10.1186/1471-2164-9-91. [DOI] [PMC free article] [PubMed] [Google Scholar]
- 15.Auer H, Lyianarachchi S, Newsom D, Klisovic MI, Marcucci G, Kornacker K. Chipping away at the chip bias: RNA degradation in microarray analysis. Nat Genet. 2003;35:292–3. doi: 10.1038/ng1203-292. [DOI] [PubMed] [Google Scholar]
- 16.Li M, Reilly C. Assessing the quality of hybridized RNA in Affymetrix GeneChips using linear regression. J Biomol Tech. 2008;19:122–8. [PMC free article] [PubMed] [Google Scholar]
- 17.Archer KJ, Dumur CI, Joel SE, Ramakrishnan V. Assessing quality of hybridized RNA in Affymetrix GeneChip experiments using mixed-effects models. Biostatistics. 2006;7:198–212. doi: 10.1093/biostatistics/kxj001. [DOI] [PubMed] [Google Scholar]
- 18.Copois V, Bibeau F, Bascoul-Mollevi C, et al. Impact of RNA degradation on gene expression profiles: assessment of different methods to reliably determine RNA quality. J Biotechnol. 2007;127:549–59. doi: 10.1016/j.jbiotec.2006.07.032. [DOI] [PubMed] [Google Scholar]
- 19.Croner RS, Guenther K, Foertsch T, et al. Tissue preparation for gene expression profiling of colorectal carcinoma: three alternatives to laser microdissection with preamplification. J Lab Clin Med. 2004;143:344–51. doi: 10.1016/j.lab.2004.03.003. [DOI] [PubMed] [Google Scholar]
Associated Data
This section collects any data citations, data availability statements, or supplementary materials included in this article.