The movement of blood or of material in the blood through a given segment of the circulation can be defined in terms of a “transport function” which describes completely the delay and dispersion occurring in the flowing blood. For any inert, indestructible, nondiffusible indicator in the blood, the convolution integral of the transport function and the indicator concentration-time curve at the upstream end of a segment should exactly equal the concentration-time curve at the downstream end of the segment. The transfer function is defined simply as a distribution of transit times. It is the purpose of this paper to provide some insight into the meaning and utility of the process of convolution by using simple examples to illustrate the fundamental principles on which all dye-dilution techniques depend.
All of the illustrations shown in this paper are idealized curves generated in and plotted by a digital computer. However, the form of the injection and the transport functions of the circulatory and sampling systems are all representative of an abundance of actual experimental situations.1–4 Because of the fluctuations in aortic or peripheral blood flow occurring randomly and with each cardiac and respiratory cycle, a sequence of injections of different form could not, except by rare chance, have yielded responses (dye curves) that could be closely compared to one another. Therefore, the theoretical curves are preferable for this presentation since they are free of noise and are unmarred by biologic and experimental aberration.
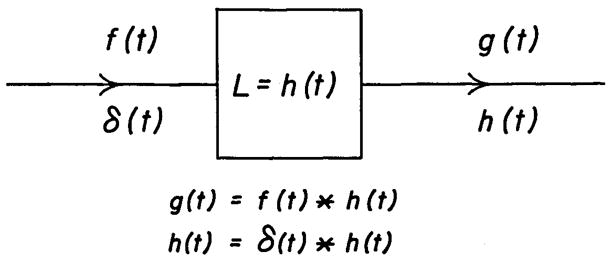
A segment of the circulatory system can be represented as in Figure 1. The concentration-time curve of an injected indicator or of a normal blood constituent at the upstream end of the segment can be treated as the input, f(t). The transport function, h(t), is defined for circulatory transport as the frequency distribution of transit times for particles to travel from the beginning to the end of the segment. The concentration-time curve at the downstream end of the segment, g(t), is the “convolution” of the input curve, f(t), and the transport function, h(t). This relationship is expressed in abbreviated form as:
Fig. 1.
Block diagram of a linear system. When the input is an ideal impulse, δ(t), the response is the transport function, h(t). The ideal impulse, δ(t) or delta function, has area of one unit at time zero and the input is zero at all other times—that is, it is a tall, slim spike. This is illustrated in the left upper panel of Figure 3. When the input is any function which is not an impulse, f(t), the output, g(t), is formed by the convolution of f(t) and h(t). The asterisk denotes the process of convolution.
| (equation 1a) |
or
| (equation 1b) * |
or, more formally, as:
| (equation 1c) |
which is the convolution integral, where λ is a variable whose values run from 0 to t for computing the integral. The asterisks in equations la and lb represent the process of convolution; the equivalence of the two equations indicates that the operation is commutative (just as a·b = b·a)—either f(t) or h(t) can be considered as input to the other; this will be illustrated later.
BASIC ASSUMPTIONS
The assumptions that Stewart5 made 70 years ago still form the basis of our usual methods for estimating cardiac output and mean transit times in the circulation. The indicator was assumed6 to (1) mix with the blood at the injection site and (2) move in the same manner as the blood. It is also assumed that (3) the distribution of transit times of the blood through various pathways does not change (stationarity of flow) and (4) the volume of blood sampled from high-velocity streamlines is in the same proportion of the total volume flow in those streamlines as is the volume sampled from low-velocity streamlines. None of these basic assumptions is completely valid, but the calculations of flow and mean transit time in the circulation are not much in error.
These requirements are fulfilled if the circulation is a mathematically linear, lumped system or if, because of the labelling and sampling requirements, the three-dimensional, complex, tubular, vascular system can be considered analogous to a one-dimensional line along which particles move at varying rates, as Zierler6 has assumed. Formally, a system whose output response is g(t) to an input, f(t), is linear when the response to [a1 f(t) + a2 f(t−t0)] is [a1g(t) + a2g (t−t0)]. The transport function is a frequency distribution (as in Figure 2, left panel) giving the relative number of particles (ordinate), h(t), requiring a certain time (abscissa), t, to travel through the segment. Existence of a transport function for a segment of the arterial system requires only that assumption 3 be true, but, in order to investigate transport functions, one must label the blood appropriately (assumption 2) and sample the stream appropriately (assumption 4). Assumption 3 implies constant blood flow, but the pulsatile nature of arterial flow does not vitiate the use of transport functions because, when the pulsations recur frequently within the passage time of the transport function, they may be considered simply as noise. For example, at a heart rate of 80/min, about 15 beats would have occurred in the 11 sec between the transit times of the fastest particles (6 sec) and the slowest (17 sec) indicated in Figure 2.
Fig. 2.
Example of transport function of the arterial system. The ideal curve (see text) is shown in the left panel. The rectangular areas show the form of this curve if the sampling periods had been 2 sec (middle panel) or 0.4 sec (right panel). The total area of each transport function is 1.0 and therefore the ordinate scale is shown as dependent on the number of readings per second. The area of the curve can be represented accurately by the frequency histograms of the center and right panels, but the actual shape, mean transit time, and standard deviation of the curve cannot. The representation is improved by decreasing the time interval between readings. For example, the mean transit time, t̄, for the histogram of the center panel is 10.1 sec instead of the correct value, 10.0 sec. The error would be greater if the curve were more skewed to the right. For the histogram of the right panel, t̄ = 10.01 sec.
THE IDEALIZED DYE CURVE
In order to obtain the idealized dye curve, it is assumed that the injection is instantaneous and does not disturb the flow but yet the indicator mixes with or labels the blood in each part of the cross section in proportion to the flow through that part of the stream (“flow-tagging” according to González-Fernández).7 This is the ideal delta function, δ(t), or impulse input, but it is not achievable experimentally. It must be also assumed that the concentration of indicator at the sampling site can be recognized without any delay and that the flow is steady. The result is the idealized indicator-dilution curve seen in Figure 2, left panel; when one unit of dye is injected as a single pulse at time zero and there is no recirculation of indicator, the recorded concentration-time curve is proportional to the frequency distribution of transit times between the injection and sampling sites (Fig. 2 left panel). This is the transport function, h(t), of that segment of circulation. The mean transit time of this particular transport function is 10.0 sec, its standard deviation (dispersion) is 1.74 sec, and its skewness* is 1.2. This transport function shows that, for example, 8.34% of the dye particles arrive at the sampling point between 6.0 and 8.0 sec after injection (first shaded area, Fig. 2) and 31% between 10 and 12 sec (second shaded area, Fig. 2).
For computational purposes, unless an analog computer or a planimeter is used, the curve is treated statistically as a frequency histogram. Grouping at large intervals provides a poor representation of the form of the curve and results in overestimation of mean transit time, dispersion, and skewness (2-sec intervals, Fig. 2 middle panel). When the groups are small, the error is reduced and the form is improved. A transport function of the form shown in the right panel of Figure 2 (0.4-sec intervals) was used for the computations resulting in the following figures. Parenthetically, since the ideal injection is not achievable, recorded dye curves do not represent the transport function. However, the transport function can be determined experimentally by injecting somewhere upstream from the input to the segment and sampling simultaneously at the beginning and end of the segment to obtain f(t) and g(t), from which h(t) can be computed by a variety of methods. These include (1) assumption of a transport function, h(t), computation of f(t).h(t), comparison of the result with the observed g(t), readjustment of h(t), and repetition of computation of f(t).h(t) until a close approximation to g(t) is obtained in either an analog or a digital computer;3, 4 (2) use of the inverse of the convolution integral; (3) use of the finite Fourier series transforms of f(t) and g(t) to calculate h(t)1; and (4) solutions of sets of simultaneous linear differential equations after assuming a transport function of a chosen order.
Influence of the Form of Injection on the Primary Curve
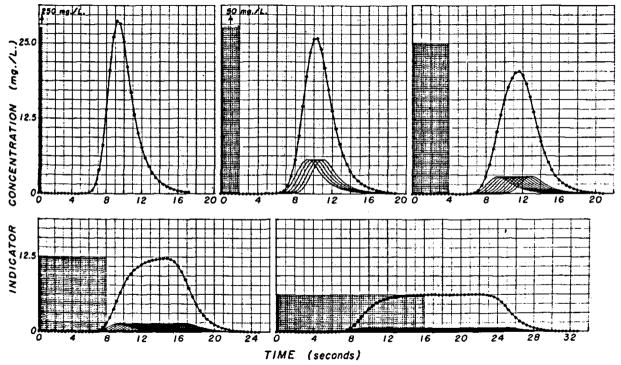
The data of Figure 3 concern the response of the segment of the arterial system to different constant-rate injections of a total of 10 mg of indicator when the flow rate is 100 ml/sec. The transport function of the segment is that shown in Figure 2. In all panels the area of the input (stippled) is the same as the area of the output response (circles) and is 100 mg sec/liter.
Fig. 3.
Responses of model of vascular segment to injection of same total amount (10 mg) of indicator at different constant rates. The total flow through the vascular segment, 100 ml/sec, was constant during injection and during inscription of each curve. Each injection was considered as a sequence of 0.4-sec pulses, the amplitudes of which were inversely related to the number of pulses required to inject the 10 mg. In the five panels, there were 1, 5, 10, 20, and 40 pulses so that the injection rates were 25.0, 5.0, 2.5, 1.25, and 0.625 mg/sec, respectively. On the assumption that the input has ideal mixing at the injection site, the curves at the arterial end of the segment are represented by the stippled rectangular areas. The responses to each of these pulses individually have the shape of the transport function and are shown by the continuous lines in each panel. The sum of these responses (circles) is the output curve, g(t), resulting from the convolution. The slower injection rates resulted in primary concentration-times curves, g(t), from which flow can be estimated by either the constant-rate or sudden-single injection methods.
If the injection were very rapid (0.4 sec) the output concentration-time curve, g(t), would be essentially the same as the transport function (Fig. 3 upper left panel). Such a pulse injection is unattainable and an impulse input, δ(t), is even more unrealistic. Although the injection rate (250 mg/sec) is achievable, high injection rates cause dispersion in the blood in the region of the catheter tip and may actually cause more longitudinal spread of the indicator than will occur with a more prolonged injection into the flowing stream.
An injection of 2-sec duration (Fig. 3 upper middle panel) may be considered to be five pulses, each of which is 2.0 mg and lasts 0.4 sec, and, assuming idealized mixing (flow-tagging), results in a concentration of 50 mg/liter at the injection site during the period of the injection. The response of the vascular segment to each of these pulses is theoretically the same as in the upper left panel except that the amplitude is one fifth; these five responses are shown as five curves, each having a peak concentration of 5.7 mg/liter. The actual output response or dye curve (circles) is the sum of the five and approximates the convolution integral, which is merely the sum of a sequence of responses to impulse inputs. This output curve is broader and has a lower peak than that for the single pulse type of injection (upper left panel).
Halving of the injection rate to 2.5 mg/sec for 4 sec (Fig. 3 upper right panel) is equivalent to providing as input a sequence of 10 pulses, each having an area of 10 mg sec/liter. The individual responses to the 10 input pulses have the same shape as before but with diminished amplitude, and their sum, g(t), the convolution integral (circles), is a still broader output curve.
With an 8-sec injection period (Fig. 3 lower left panel) the individual responses to each 0.4-sec pulse have a peak concentration of only 1.5 mg/liter, and the summed (output) curve is very flattened. It is apparent that an injection of only slightly greater duration would have resulted in a plateaued output curve.
The evolution to the constant-rate indicator-dilution technique is completed in the lower right panel by using a prolonged injection (0.625 mg/sec for 16 sec) which is equivalent to 40 0.4-sec pulses containing 0.25 mg each. The flow through the vascular segment may be calculated from the output curve by using either the plateau concentration of 6.25 mg/liter or the total area. The plateau concentration is reached only when the slowest indicator particle from the first pulse has reached the sampling site. Therefore, when recirculation occurs in the body, the plateau concentration can be used to estimate flow only when recirculation begins so long after the completion of the response to the first pulse that the existence of a plateau can be recognized. Generally, therefore, it is most useful when the response to a short slug-injection shows complete clearance to the base line before recirculation occurs.
Calculations based on the hypothetical data of Figure 3 will serve to illustrate the standard formulae. For any of the injection forms, flow (liters/sec) equals amount injected (10 mg) divided by the area (100 mg sec/liter) or 0.1 liter/sec. For the prolonged injections of the lower right panel, flow equals injection rate (0.625 mg/sec) divided by the plateau concentration (6.25 mg/liter) or 0.1 liter/sec. It is emphasized that the basic assumptions of the constant-rate dye-injection method are no different from those governing the slug-injection method. The 16-sec injection (lower right panel) has the practical disadvantage that, in animals, recirculation would have occurred and obscured the plateau and the tail of the curve.
The mean transit times of the input and output curves of the five panels are related8 by:
| (equation 2) |
where t̄f, t̄h, and t̄g are the mean transit times for f(t), h(t), and g(t), respectively, as calculated by the standard formula for the first moment:
| (equation 3) |
| (equation 4) |
Equation 4 is valid when ti–ti-1 is a constant time interval. In Figure 3, the midpoint of each stippled area, f(t), is its mean transit time, t̄f; t̄g may be found either from equation 4 or by adding t̄h (10.0 sec in this case) to t̄f as in equation 2.
Influence of Sampling System on Recorded Curves
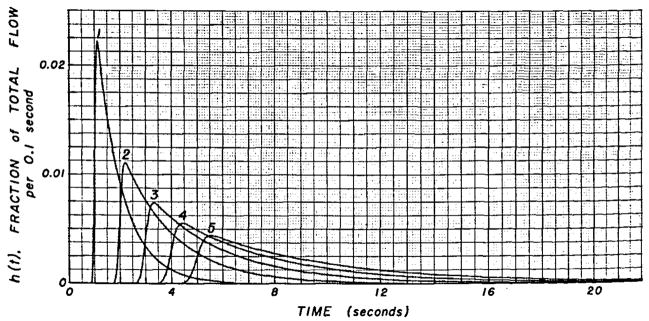
The sampling of the blood through a catheter or needle at a constant rate results in further dispersion of the indicator in the sampled blood. This effect is characterized precisely by the transport function of the catheter, the form of which is dependent on flow rate (Fig. 4). The curves are idealized but typical of those obtained in this laboratory. At slow sampling flow rates, the transport function has greater temporal dispersion than at fast rates—that is, the pulse response is more spread out.
Fig. 4.
Transport function typical of a catheter-densitometer system at various flow rates. Sampling system volume = 2.0 ml. Sampling flow rates were: curve 1, 60 ml/min; curve 2, 30 ml/min; curve 3, 20 ml/min; curve 4, 15 ml/min; and curve 5, 12 ml/min.
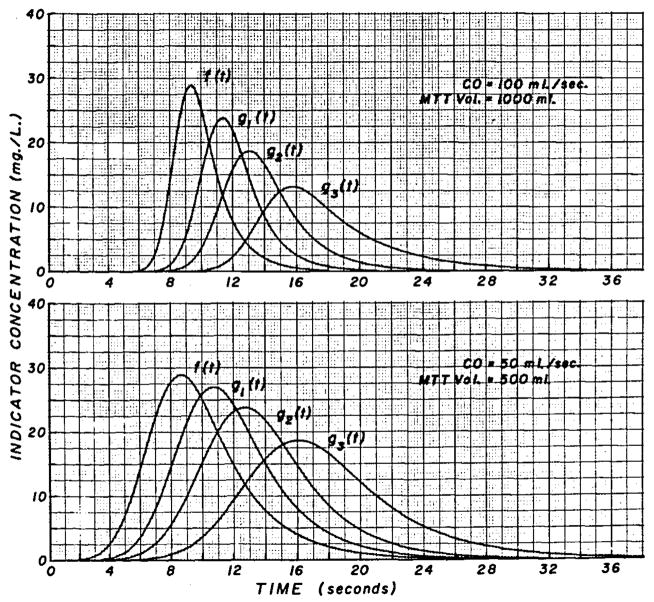
A given sampling system has much more effect on an arterial dilution curve with rapid time components than on a slower curve (Fig. 5 lower panel) and the distortion is much greater when the sampling rate is slow or the volume of the sampling system is large. In a practical sense, the sampling system is a low-pass filter: low-frequency, gradual concentration changes are little affected in shape and are merely delayed, but rapid changes in concentration (high-frequency information) are greatly attenuated or lost altogether. In a similar fashion, the high-frequency step-changes in concentration that occur with ventricular injection are quite smoothed out a few inches downstream in the aorta.
Fig. 5.
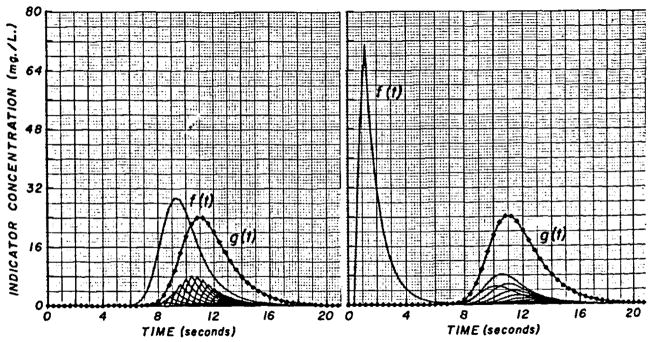
Distortion of arterial curves at various flow rates through the sampling system. Upper Panel, Ten milligrams of indicator injected; cardiac output = 100 ml/sec; volume between injection and sampling sites = 1.0 liter; f (t) = arterial curve at tip of sampling catheter; and g1(t) = curve recorded at densitometer when flow rate through the catheter was 1 ml/sec (curve 1, Fig. 4). For g2(t), rate was 0.5 ml/sec and for g3(t), it was 0.25 ml/sec or 15 ml/min. Each g(t) has the same area as f(t) (100 mg sec/liter). Lower Panel, Ten milligrams of indicator injected; cardiac output = 50 ml/sec; the volume between injection site and sampling sites = 500 ml. The results of convolution of f(t) with transport functions shown as curves 1, 2, and 4 of Figure 4 are labelled g1(t), g2(t), and g3(t). This slower arterial curve is distorted much less by the sampling system than is the f (t) of the upper panel.
CONVOLUTION IS COMMUTATIVE
Equations la and lb imply that it does not matter whether one considers the input curve as being distorted by the sampling system or the impulse response (transport function) of the sampling system as being acted on by a changing concentration at the tip; the operation is commutative. The details can be seen in Figure 6; the same result, g(t), is obtained whether the arterial curve is called f(t) and the sampling-system transport function, h(t), or vice versa. This result can also be proved mathematically.8
Fig. 6.
The convolution integral is commutative. Left Panel, When the arterial curve is considered as f(t) and the sampling-system transport function as h(t) (similar to curve 1 of Figure 4 and shown as f (t) of the right panel), the output of the convolution, g(t), represents the recorded curve (the same curve as g1(t), Fig. 5, upper panel) and is the sum of the sampling system responses (at bottom of graph) to the sequence of pulses of varying amplitude forming f(t). Right Panel, The sampling-system transport function scaled to the same area as the arterial curve is used as f(t) in the integration. The arterial curve is scaled to unit area to serve as h(t). The responses to each pulse of f(t) are now seen to have the form of the arterial curve (the same shape as f(t) of the left panel). Their sum results in a recorded curve, g(t), which is identical to that of the left panel.
FREQUENCY RESPONSE OF THE CIRCULATORY SYSTEM
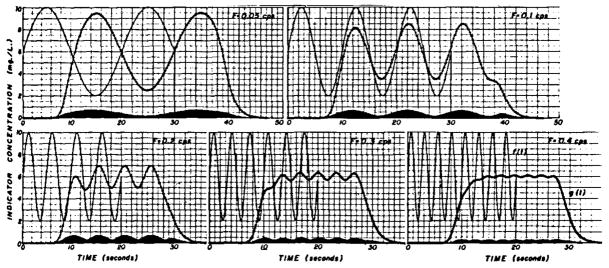
In Figure 7 are illustrated indicator-dilution curves representing what occurs with sinusoidally varying injection rates. The smooth lines, f(t), in each panel represent the concentration at the injection site, assuming complete mixing at this site, when the injection rate is 0.6 + 0.4 sin 2π Ft in mg/sec and the flow (cardiac output) is constant at 100 ml/sec. F is frequency in cycles/sec. The injections are stopped at either 30 or 20 sec. These curves are inputs, f(t), to the vascular segment; the same vascular transport function, h(t), as before (Fig. 2 right panel and used for the convolutions of Fig. 3) was used to compute the downstream or output curves, g(t), by convolution of f(t) and h(t). f(t) and h(t) are considered as sequences of pulses of varying amplitude and fixed duration, Δt. (In order to use smooth curves, smaller Δt’s were necessary with higher frequency sine waves. Δt was 0.2 for frequencies of 0.05, 0.1, and 0.2 cps, 0.15 for 0.3 cps, and 0.1 for 0.4 cps.) The individual responses of the vascular segment to the input pulses are shown at the bottom of each panel and are difficult to distinguish when the injection rate varies slowly (Fig. 7 upper left panel) and when the pulse duration, and therefore amplitude of response, is small (Fig. 7 lower right panel).
Fig. 7.
Response of vascular segment to sinusoidal injection rates; cardiac output = 100 ml/sec and injection rate r= 0.6 mg/sec + 0.4 sin 2π Ft. In each panel is shown an input function, f(t), for which the sine wave starts at t = 0, ends at t =. 30 or 20 sec, and abruptly goes to zero when it ends. The input function is treated as a sequence of pulses of varying amplitude but constant duration. The arterial transport function illustrated in Figure 2 right panel was used as h(t) in all cases. The individual responses of the segment to each input pulse are drawn in each panel but cannot be easily distinguished when the input frequency is low or when the time interval used in the computation is short. The output of the convolution (circles), g(t), representing the response of the vascular segment has an amplitude which is less than that of the input because of the dispersion, and the attenuation is greater at higher frequencies. This illustrates that the circulatory segment acts as a low-pass filter.
When sufficient time after the start of injection has elapsed for all the indicator from the first input pulse to pass by the downstream detection point, the output curve, g(t), also becomes sinusoidal. The duration of this transient period would be expected to be 17 sec—that is, the time for the slowest particle to traverse the system (from Fig. 2)—and it may be seen that the peaks of g(t) in the lower panels of Figure 7 are at a constant concentration after this period has passed. The steady-state response is maintained until the first un-labelled blood reaches the downstream point after the end of injection. Again, from Figure 2, it is apparent that this takes a little less than 7 sec. Likewise, this is most apparent in the lower panels of Figure 7 where it is seen that deviation from the sine wave begins during the twenty-seventh second.
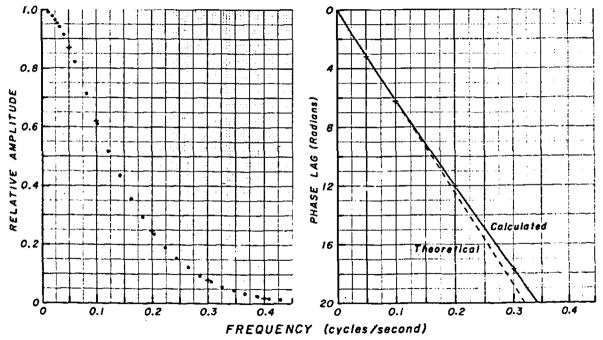
As expected, the amplitude of the sinusoidal portion of g(t) is always less than that of f(t). The attenuation is greatest at high frequencies, and at very low frequencies there will be no attenuation. This relationship is shown in Figure 8, where the dots represent the relative amplitude of output and input for each frequency as calculated theoretically with a Fourier transform. The plus signs represent the data of Figure 7. For example, when the frequency is 0.1 cps (Fig. 7 upper right panel), the amplitude of g(t) is 8.5 – 3.5 = 5.0 and that of the f (t) is 10.0 – 2.0 = 8.0. The relative amplitude is therefore 5.0/8.0 = 0.62, which is plotted as a plus sign in Figure 8 (left panel).
Fig. 8.
Amplitude and phase plots for the transfer function in Figure 2. Left Panel, Amplitude of the response, g(t), at the output of the vascular segment when there is a sinusoidally varying infusion resulting in a concentration f (t) at the input to the segment. The relative amplitudes at the frequencies depicted in Figure 7 are shown by the plus signs. Right Panel, Phase lag at each frequency. Phase lags estimated from Figure 7 are given by the plus signs.
g(t) is delayed from f(t) by a certain time, the mean transit time, t̄h of the transport function, h(t). With sine waves, this delay time is usually expressed as a phase lag (as the number of cycles at the frequency being observed). For a system with a constant delay, the relationship is: phase angle (radians) = 2π Ft̄h, where F is the frequency in cps; phase angle in degrees = 2π Ft̄h 180/π = 360 Ft̄h. This is the relationship given by the dashed line in Figure 8 (right panel). The delays observed in Figure 7 are shown as plus signs. The phase angle is linear with respect to frequency, however, not only because of the delay but also because the dispersion in the circulation is nearly Gaussian, and deviation from the linear relationship at higher frequencies reflects the fact that the distribution of transit times is somewhat skewed. The dead time, or pure delay preceding the appearance time, 6.5 sec, comprises a large portion of the phase angle.
Thus, the circulatory transport function can be said to filter out high-frequency information regarding concentration of material and can be characterized completely by phase and amplitude plots versus frequency.1
This concept of the circulation as an “information filter” can be applied to reduce errors inherent in the dye-dilution technique. For example, when there are cyclic variations in flow rate, the concentration-time curve obtained with a constant-rate injection will be cyclic and the response to a slug injection will be irregularly shaped. It may be seen from Figure 8 that the relative amplitude is less than 2% of the maximum when the frequency is greater than 0.4 cps or, in general, greater than 4/t̄h cps. For example, in the aorta where the average blood velocity might be 20 cm/sec, if the sampling site is 40 cm from the injection site, t̄h is 2.0 sec and frequencies greater than 2 cps will have no significant effect on the resultant dye curve and the flow calculated from it.
FORMATION OF THE RECORDED DYE CURVE
The primary indictator-dilution curve recorded via a densitometer will be the result of the three dispersing processes discussed above: dispersion at the injection site, dispersion in the circulation, and dispersion by the sampling system. A fourth dispersing process, the recirculation of indicator, influences later parts of the recorded curve.
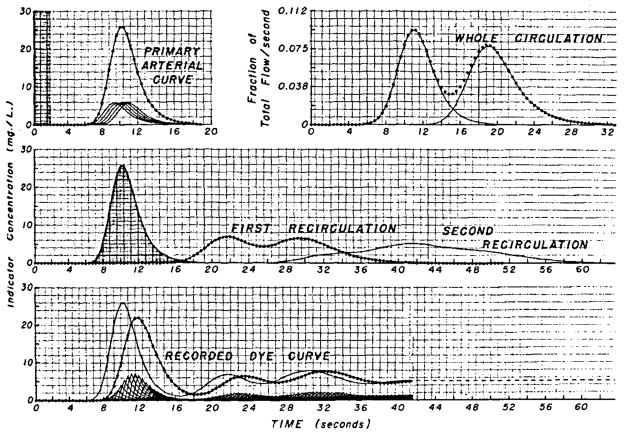
For purposes of discussion, let us treat an injection of 2.0 sec as five pulses of equal magnitude and 0.4-sec duration (shaded area, Fig. 9 upper left panel). With computation based on the circulatory transport function of Figure 2, the sum of the responses of the circulatory segment to these five pulses is the primary arterial dye curve (circles), which is the same as the upper middle panel of Figure 3. The transport function of the whole circulation (Fig. 9 upper right panel) is shown in a simplified fashion as being comprised of only two families of transit time (lines). The first hump represents 45% of the total in accordance with the observation of Nicholes and co-workers.9 The second hump should perhaps be more prolonged. The total area of the transport function is not 1.0 but is arbitrarily given a value of 0.95 to represent the fact that a portion of the indicator—in this example, 5%—is lost from the circulation in each complete passage. The convolution of the primary curve with the transport function representing the whole circulation is computed and the output (Fig. 9 middle panel, circles) is convoluted again with the whole circulation transport function to form the second recirculation (Fig. 9 middle panel, continuous line). The arterial concentration-time curve is the sum of the primary curve and an infinite number of recirculations of which only two are used in this illustration (Fig. 9 lower panel, continuous line). The concentration-time curve existent within the artery cannot be observed because it is distorted by the sampling system. With the sampling system transport function shown as curve 1 of Figure 4 (a flow of 1 ml/sec through a volume of 2 ml), the form of the recorded curve (circles) is determined by the convolution of this transport function with the arterial input to the sampling catheter. The output of this convolution is terminated in the dashed line because the third and subsequent recirculations were not included.
Fig. 9.
Formation of a recorded dye-dilution curve. Upper Left Panel, The stippled area representing the concentration-time curve at the injection site is spread out over 2 sec to indicate that injection is not instantaneous or that even if it were very rapid the energy of injection would produce longitudinal mixing resulting in dispersion which could be similar to that shown. Upper Right Panel, The circles represent the frequency distribution of transit times from a point in the central circulation through the systemic and pulmonary circulations back to the same point. Middle Panel, The primary arterial curve (stippled) is input, the circles represent this curve distorted by passage once around the whole circulation, and the line represents two passages. Lower Panel, The line represents the arterial dye concentration at the tip of the sampling catheter and is the sum of the three curves of the middle panel. It is treated as a sequence of 0.4-sec pulses, and the small curves at the bottom of the panel represent the individual responses of the sampling system to each pulse. The sum of these responses is the recorded indicator-dilution curve (circles).
When there is no loss of recirculated indicator, the terminal concentration will be constant when circulatory mixing is complete. Then, the amount of indicator injected divided by this concentration gives the volume of distribution of the indicator—that is, the blood volume, if the indicator remains within the vascular system. When indicator is lost from the blood during each recirculation, if the rate of loss is proportional to concentration, the concentration diminishes exponentially after the first few minutes. In order to calculate blood volume by using such an indicator, it has been customary to extrapolate this exponential curve hack to the time of injection on the assumption that the concentration value at time zero represented that which would have existed if no indicator had been lost. The assumption is invalid, of course, because mixing throughout the circulation is far from instantaneous, and no indicator at all is lost until the first molecules reach the site of loss from the circulation. The correct time to which to extrapolate depends on a large number of factors but, for adult humans, is between 15 and 45 sec after the time of injection. This correction is significant for indicators which leave the circulation relatively rapidly, such as indocyanine green. Without the correction, blood volume may be underestimated by more than 10% when the half-time of disappearance is 4 min.
COMMENT
The purpose of this study was to illustrate the components forming the recorded dye-dilution curve, which cannot be done experimentally. Because of continuous variations of blood flow in the mammalian circulation, it is difficult to obtain experimentally even a comparable set of recorded curves having varied injection forms, and, for the purpose of exposition of the subject of convolution, it was deemed desirable to present ideal curves. Even so, the ideal curves discussed are all representative of actual experimental data obtained in this laboratory in physiologic studies. Marshall10 has also presented data obtained on dogs which illustrate the series of responses to progressively longer injections and which are basically similar to those of Figure 3.
These concepts, illustrated for the circulation and fluid systems, have applications of great generality. Circulatory transport functions can represent the movement of hormone or foodstuff from one organ to another. The convolution of the concentration-time curve at a source organ with the appropriate circulatory transport function results in the concentration-time curve at the receptor organ. The concept of transport function can equally well represent transformation of material—for example, sucrose in the stomach to glucose in the portal vein. It can also represent response of a different sort such as the relationship between glucose in the pancreatic artery and insulin in the portal vein. The convolution integral applies equally well to all of these, subject to the limitations that the system must be mathematically linear and must exhibit stationarity. In biologic systems one expects continuous variation (lack of stationarity) but when the frequency of variation is high this can be considered as noise and is disturbing to the investigator only when its amplitude is large compared to the average state.
SUMMARY
The convolution integral is the computation of the response, g(t), of a system to a given input, f(t), when the system’s transport function, h(t), is known. g(t) can be considered as the sum of the responses to the large number of impulses which, in sequence, form f(t). In circulatory studies, a recorded indicator-dilution curve is the result of: (1) dispersion at the injection site due to noninstantaneous injection and to the turbulence caused by the injection, (2) transformation of the form of the bolus of indicator during circulatory transit to the sampling site, (3) recirculation of indicator through the whole circulation such that the most rapidly recirculated indicator may sum with that passing the sampling site for the first time, and (4) distortion by the sampling system. With the probable exception of the first, these processes can be mathematically characterized, allowing the events within the vascular system to be simulated by a linear system wherein the convolution of these four processes one upon another results in reasonable approximation to the biologic and experimental events.
Acknowledgments
The author would like to thank Dr. E. H. Wood for his help in revising the manuscript, and Mr. Frank Ackerman, a student at Swarthmore College, for his contribution to the computer programming.
APPENDIX: NUMERICAL EXPRESSION OF THE CONVOLUTION INTEGRAL
When f, g, and h are considered as sequences of pulses of duration Δt, where fn is f[(n−1) · Δt] and similarly for hn and gn, then equation lb (see text) must be rephrased:
| (equation 5) |
where gn is the general term. The computation of equation 5 is easily programmed in Fortran. By avoiding computation when f or h has zero value, the time requirements may be halved, hi is dimensionless when it is normalized for the appropriate Δt; and the Δt’s, by which both gi and fi are multiplied to obtain the area of the pulse, cancel out to give equation 5. g1 is the first part of the response to the first input pulse, f1. The whole of the response to f1 would be given by the sequence f1h1, f1h2, f1h3, … f1hz, where hz is the last point of the h array; or, as drawn in upper left panel of Figure 3, the response to f1 is f1h(t), using h(t) as a continuous function. The second input pulse, f2, is delayed Δt from f1 and therefore the response, delayed by the same Δt, is f2h(t – Δt). The nth response is fnh[t– (n-l) · Δt].
The development to this point may be aided by reference to the upper middle panel of Figure 3. The input function, f(t), consists of five pulses beginning at time zero; the amplitudes of f1, f2, … f5 are all 50 mg/liter and the areas are 20 mg sec/liter. The five responses are shown, each delayed Δt more than its predecessor. The output,
| (equation 6) |
which is the curve represented by the circles.
Equation 6 may be written for any number of input pulses:
| (equation 7) |
This is usually expressed differently by introducing another time variable, λ, where λ = i· Δt, and Δλ = Δt. Since f1 = f(i· Δt) =f(λ) and f1 represented f(0), equation 7 becomes:
| (equation 8) |
which in turn becomes the convolution integral (equation 1c) when Δλ is very small.
Footnotes
This presentation was supported in part by Research Grants HE-04C64, HE-09719 and FR-00007 from the National Institutes of Health, Public Health Service.
See Appendix.
Skewness is unitless and is defined as π3/π23/2 where π2 and π3 are the second and third moments, respectively.
References
- 1.Coulam CM, Warner HR, Wood EH, Rassingthwaighte JB. A Transfer Function Analysis of Coronary and Renal Circulation Calculated From Upstream and Downstream Indicator-Dilution Curves. Circ Res. 1966 Nov;19:879–890. doi: 10.1161/01.res.19.5.879. [DOI] [PMC free article] [PubMed] [Google Scholar]
- 2.Bassingthwaighte JB, Warner HR, Wood EH. A Mathematical Description of the Dispersion of Indicator in Blood Traversing an Artery. Physiologist. 1961 Aug;4:8. [Google Scholar]
- 3.Bassingthwaighte JB, Warner HR, Wood EH. Analog Computer Analysis of Dispersion of Indicator in the Circulation. Med Res Eng. 1966;5:30–38. [PMC free article] [PubMed] [Google Scholar]
- 4.Bassingthwaighte JB. Plasma Indicator Dispersion in Arteries of the Human Leg. Circ Res. 1966 Aug;19:332–346. doi: 10.1161/01.res.19.2.332. [DOI] [PMC free article] [PubMed] [Google Scholar]
- 5.Stewart GN. Researches on the Circulation Time and on the Influences Which Affect It. IV: The Output of the Heart. J Physiol (London) 1897 Nov 20;22:159–183. doi: 10.1113/jphysiol.1897.sp000684. [DOI] [PMC free article] [PubMed] [Google Scholar]
- 6.Zierler KL. A Simplified Explanation of the Theory of Indicator-Dilution for Measurement of Fluid Flow and Volume and Other Distributive Phenomena. Bull Johns Hopkins Hosp. 1958 Oct;103:199–217. [PubMed] [Google Scholar]
- 7.González-Fernández JM. Theory of Measurement of the Dispersion of an Indicator in Indicator-Dilution Studies. Circ Res. 1962 Mar;10:409–427. doi: 10.1161/01.res.10.3.409. [DOI] [PubMed] [Google Scholar]
- 8.Cramér H. Mathematical Methods of Statistics. Princeton, New Jersey: Princeton University Press; 1946. p. 575. [Google Scholar]
- 9.Nicholes KK, Warner HR, Wood EH. A Study of Dispersion of an Indicator in the Circulation. Ann NY Acad Sci. 1964 July 31;115:721–737. [PubMed] [Google Scholar]
- 10.Marshall RJ. Evolution of Single Slug to Constant Infusion Indicator Dilution Curves. (Abstr.) Physiologist. 1964 Aug;7:199. [Google Scholar]


