Abstract
Recently developed optical-resolution photoacoustic microscopy (OR-PAM), which is based on the detection of optical absorption contrast, is complementary to other optical microscopy modalities such as optical confocal microscopy, optical coherence tomography, and multi-photon microscopy. A hybrid optical–mechanical scanning configuration increases the imaging speed of OR-PAM significantly, enabling many demanding biomedical applications. With a high pulse-repetition-rate laser, the hybrid-scanning OR-PAM can acquire one-dimensional depth-resolved images (A-lines) at 5 kHz and two-dimensional B-scan images containing 800 A-lines at 6.25 Hz. We demonstrated in vivo in a mouse three-dimensional imaging of the iris vasculature in 128 seconds for an 800 × 800 × 200 data set and of the ear vasculature in 256 seconds for an 800 × 1600 × 200 data set.
Modern optical microscopy technologies, such as optical confocal microscopy, optical coherence microscopy, and multi-photon microscopy, are important for a large number of applications in life sciences. The recent development of optical-resolution photoacoustic microscopy (OR-PAM) [1], based on detecting the optical absorption contrast mechanism, introduces a novel member into the family of modern optical microscopy. OR-PAM, along with dark-field acousticre-solution photoacoustic microscopy (AR-PAM) [2], photoacoustic computed tomography [3] and thermoacoustic tomography [4], promises to have a substantial impact on biomedical applications in the near future [5, 6]. In our previously demonstrated OR-PAM system [1], the confocal design of optical focus and acoustic focus allowed the highest signal-to-noise ratio (SNR); the mechanical scanning of both the optical objective and the ultrasonic transducer in the x–y plane limited the imaging acquisition rate. It is desirable to extend our system’s capability both in imaging transient, functional and physiological events for biologists and in diagnosing potential human diseases without motion artifacts for clinicians.
The motivation of this work is to improve the system’s imaging speed with minimal loss in SNR. Although a 2D laser scanning scheme [7] was used to maximize the imaging speed, its system SNR was compromised by the use of a non-focused ultrasonic transducer. Thus, we proposed a hybrid-scanning OR-PAM (HSOR-PAM) system using a cylindrically focused ultrasonic transducer. We employed both fast optical scanning along the B-mode imaging scan direction—defined here as the fast scan axis—and mechanical scanning orthogonally to both the fast scan axis and imaging depth direction—defined here as the slow scan axis. The HSOR-PAM system showed a greater system SNR than the 2D laser scanning scheme; it was used to image in vivo both the iris and the ear of a mouse.
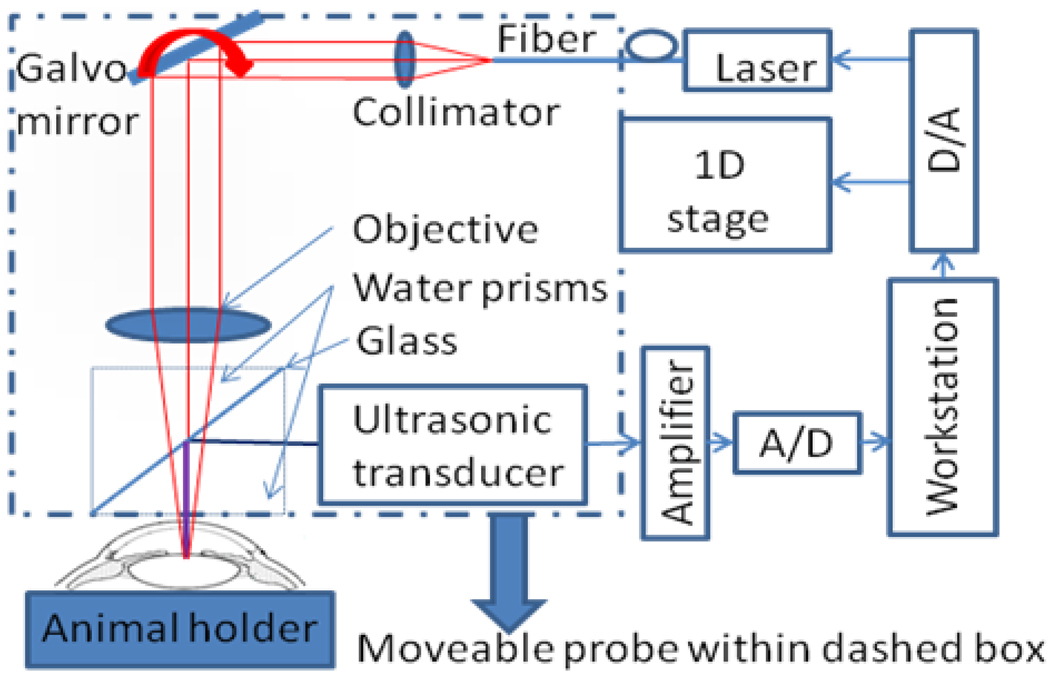
The design of HSOR-PAM (Fig. 1) was motivated by the fact that although mechanical scanning speed cannot satisfy the fast axis scan requirement for demanding in vivo applications, it is fast enough for the slow axis scan. The laser beam was scanned in the fast axis by a Galvo mirror. A cylindrically focused ultrasonic transducer was used to collect the photoacoustic signal without mechanical moving during B-mode imaging. The probe in the dashed box of Fig. 1 was only moved along the slow axis by a 1D mechanical stage for 3D imaging. The 532 nm pulsed laser (1.2 ns pulse width and 5 kHz pulse-repetition-rate) was connected to the HSOR-PAM probe through a single-mode fiber. Within the probe, the laser beam was collimated before being deflected by the Galvo mirror (6220H, Cambridge Technology) located at the front focus of an objective lens (AC254035-B, Thorlabs). A water cube comprising two isosceles right-angle water prisms and a glass plate between them was employed for light wave delivery and acoustic wave coupling. The laser beam was passed through the water cube and focused at least 200 µm below the tissue surface. Absorption of the laser pulse in the tissue produces photoacoustic waves. Thereafter, the acoustic wave was reflected by the glass plate and detected by the ultrasonic transducer. The ultrasonic transducer (25 MHz bandwidth, focal length 15 mm, material PZT, GE), having a line focus along the optical scan trace, collected photoacoustic signals from the fast optical scan axis without moving the ultrasonic transducer. The whole probe was attached to a one-dimensional mechanical stage, which scanned perpendicularly to the fast optical scan axis. The detected photoacoustic (PA) signal was amplified by an amplifier (ZFL-500LN, MiniCircuits) and digitized with an analogue-to-digital (A/D) conversion card (NI-5124, National Instruments). The measured time-resolved PA signal for each A-line was Hilbert transformed in order to generate a time-resolved PA amplitude signal. The combination of time-resolved PA data acquisition and the hybrid-scanning scheme generated three-dimensional (3D) HSOR-PAM tomographs. Another National Instruments card (NI-6713) was used to generate control signals for the imaging system. Two analog signals were sent by the NI-6713 card to control the laser firing and the slow axis stage movement. Another analog waveform from the NI-6713 card, which is not explicitly shown in Figure 1, was used to scan the Galvo mirror. Both the NI-5124 and NI-6713 cards were hosted in a computer workstation (Precision, Dell) with multiple cores to allow multithread executions. Customized software was written in Visual C++ to allow real-time data acquisition, data processing, and image visualization by multiple threads [8]. The HSOR-PAM imaging system was operated at a B-mode imaging speed of 5,000 A-lines per second, determined by the pulse repetition rate of the laser.
Fig. 1.
Schematic of the hybrid-scanning optical-resolution photoacoustic microscopy system.
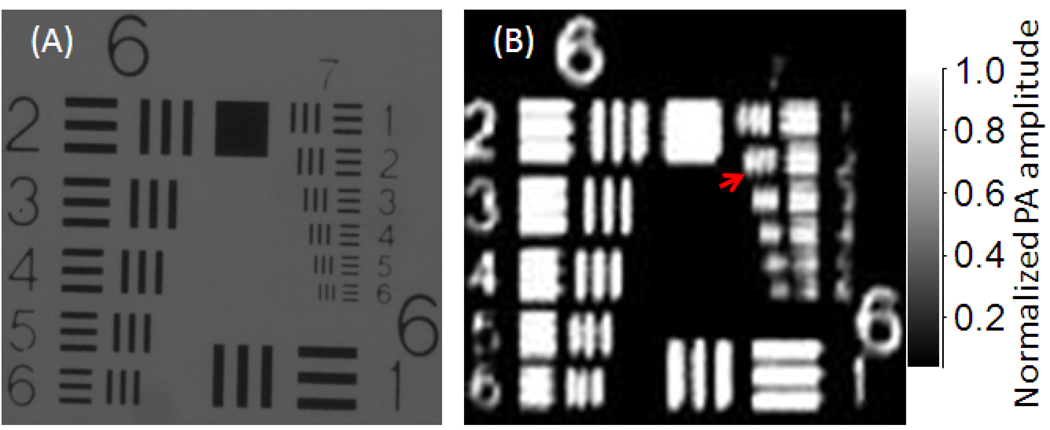
The axial resolution of the HSOR-PAM was estimated to be <31 µm according to a numerical shift-and-sum simulation using experimentally measured point spread function [9]. The lateral resolution was evaluated by imaging a United States Air Force resolution target (USAF-1951, Edmund). Groups 6 and 7 of the target are shown in both the light microscopy image (Fig. 2A) and the PAM maximum amplitude projection (MAP) image (Fig. 2B). Blurring of the bars in Fig. 2B was primarily caused by the instability of the Galvo scanner and 1D scanning stage. Because the bars within the second element of Group 7—both the bar width and the spacing are 7 µm—were resolved in Fig. 2B, the lateral resolution of HSOR-PAM was estimated to be 3.5 µm at focus.
Fig. 2.
(A) Light microscopy image and (B) maximum amplitude projection PA image of the 6th and 7th groups in a USAF-1951 resolution target acquired by the hybrid-scanning optical-resolution photoacoustic microscopy system. The second element (identified with a red arrow) in the 7th group was resolved in the PA image.
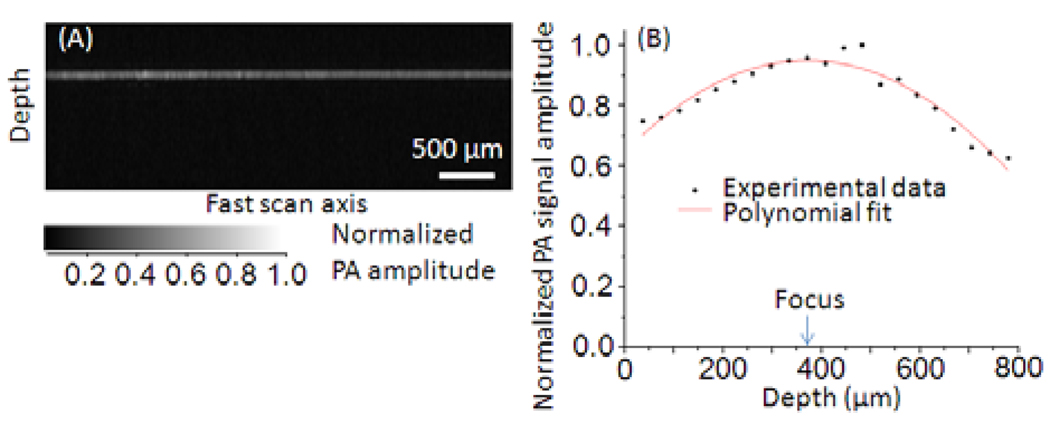
To evaluate the quality of imaging along the fast scan axis, we imaged the back side of an alignment plate (LCPA1, Thorlabs) with 32-signal averaging. The PA signal amplitude did not degrade within 4 mm of the lateral optical scan range as shown in Fig. 3A. Further, the PA signal amplitude was evaluated as the LCPA1 target was translated to various depths. Within an 800-µm depth range, the signal amplitude rolled-off 25% in front of the HSOR-PAM focus and 37% behind (Fig. 3B).
Fig. 3.
(A) B-mode PA image (1.5 mm × 4.0 mm) scanning on the back-side of an alignment plate (LCPA1, Thorlabs). (B) Peak PA signal amplitude versus depth.
The SNR of the system was tested by imaging a 1 mm × 1 mm area of a polished graphite sample with 40 nJ single pulse energy. The averaged SNR was 35 dB, which was about 5 dB lower than that of the original OR-PAM system [1] under the same experimental setting. In order to quantify the imaging depth, a black needle was inserted at an oblique angle into the leg of a live nude mouse. The needle was still visible in the B-scan image at the depth of 450 µm below the skin surface when the single pulse energy was set to 60 nJ.
In vivo vasculature imaging experiments were demonstrated in both mouse ear and mouse iris. All experimental animal procedures were carried out in conformity with the laboratory animal protocol approved by the School of Medicine Animal Studies Committee of Washington University in St. Louis. Nude mice (Hsd, Athymic Nude-Foxn1NU, Harlan Co.) were anesthetized by intraperitoneal (IP) injection of a cocktail containing Ketamine (100 mg/kg) and Xylazine (10mg/kg). A custom-made animal holder was used to restrain the animal. A breathing device (E–Z Anesthesia, Euthanex Corp.) was employed to maintain the anesthesia status after the IP injection. The laser pulse energy on the sample surface was measured to be 60 nJ. Assuming that the depth of the laser focus is deeper than 200 µm and the NA is 0.1, the calculated surface laser fluence is 8.5 mJ/cm2, which is less than the 20 mJ/cm2 safety standard set by the American National Standards Institute (ANSI) [9]. B-mode PAM images (800 A-lines) during 3D scanning were processed and presented in real time (6.25 Hz). Two-dimensional MAP images and 3D images were generated by post-processing.
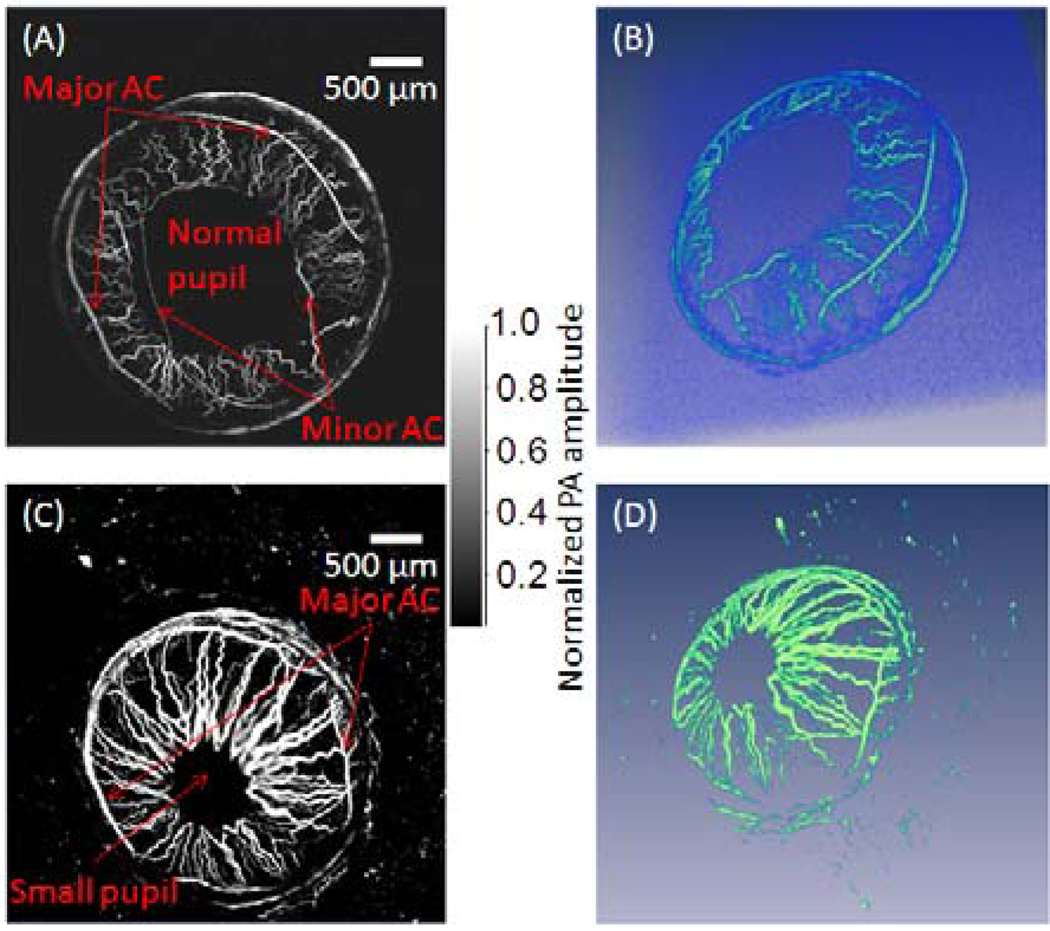
For in vivo mouse iris imaging, a 4 mm by 4 mm area was scanned over 800 by 800 pixels (step size: 5 µm). While the B-scan frame rate was 6.25 Hz, the total data acquisition time for the data set of 800 × 800 × 200 was 128 seconds. Mouse iris MAP images with dim ambient light illumination and bright ambient light illumination are shown in Figure 4, which shows that the pupil was smaller in the bright ambient light illuminated eye as expected. The major arterial circle (AC) of the iris is identifiable in both the dim and bright ambient light illuminated eyes, while the minor AC of the iris is shown close to the pupillary margin only in the dim ambient light illuminated eye. The arteries that originate at the major AC appear larger and more superficial than the veins that travel back to the iris periphery.
Fig. 4.
Maximum amplitude projection PA images of the iris vasculature in a mouse (A) under dim ambient illumination condition and (C) bright ambient light illumination condition. Both the major artery circle (AC) and the minor artery circle are shown in the iris with larger pupil size in dim ambient light illumination condition. Their rendered 3D images are shown in (B) and (D) accordingly, and their 3D movies are provided in supplemental files.
For in vivo imaging of a mouse ear (Fig. 5A), a 4 mm by 8 mm area was scanned. A 3D data set of 800 × 1600 × 200 voxels was acquired in 256 seconds. The MAP image of the mouse ear (Fig. 5B) was extracted from the 3D data set. Four pairs of arteries and veins that travel in parallel are shown. Vasculature down to the capillary level is identifiable in the MAP image.
Fig. 5.
(A) Photograph of a live mouse ear. (B) Maximum amplitude projection PA image of the mouse ear vasculature acquired in vivo.
HSOR-PAM represents a certain trade-off between imaging speed and PA signal detection sensitivity. In our original OR-PAM system, the system imaging speed was limited by the fast axis mechanical stage scanning speed. Although the line-focused ultrasonic transducer design in HSOR-PAM removed the limitation of mechanical scan in the fast axis, its SNR was lower than the spot-focused ultrasonic transducer in our original OR-PAM system. However, our in vivo small animal imaging results demonstrated that the HSOR-PAM system still can document most microvasculature features revealed by the original ORPAM system. The design with a line-focused ultrasonic transducer is more sensitive than design with a flat ultrasonic transducer and optical scanning in both axes [10]. In addition, without compromising the imaging speed, this hybrid-scanning method permits a much larger imaging range in the slow axis direction than the method using optical scanning in both axes. The imaging speed of HSOR-PAM system is presently limited only by the pulse repetition rate and the pulse energy of the laser. HSOR-PAM represents one step forward in OR-PAM toward demanding biomedical imaging applications.
Supplementary Material
Acknowledgement
The research was supported by the National Institutes of Health grants R01 EB000712, EB000712A2S1, R01 EB00071207S2, R01 EB008085, R01 CA113453901, U54 CA136398, and 5P60 DK02057933. L.W. has a financial interest in Microphotoacoustics, Inc. and Endra, Inc., which, however, did not support this work.
Footnotes
OCIS codes: 170.3880, 170.5120, 180.5810, 110.5120, 110.0180.
References
- 1.Maslov K, Zhang HF, Hu S, Wang LV. Optical-resolution photoacoustic microscopy for in vivo imaging of single capillaries. Optics Letters. 2008;33:929–931. doi: 10.1364/ol.33.000929. [DOI] [PubMed] [Google Scholar]
- 2.Maslov K, Stoica G, Wang LV. In vivo dark-field reflection-mode photoacoustic microscopy. Optics Letters. 2005;30(6):625–627. doi: 10.1364/ol.30.000625. [DOI] [PubMed] [Google Scholar]
- 3.Wang X, Pang Y, Ku G, Stoica G, Wang LV. Three-dimensional laser-induced photoacoustic tomography of mouse brain with the skin and skull intact. Optics Letters. 2003;28(19):1739–1741. doi: 10.1364/ol.28.001739. [DOI] [PubMed] [Google Scholar]
- 4.Wang LV, Zhao X, Sun H, Ku G. Microwave-induced acoustic imaging of biological tissues. Review of Scientific Instruments. 1999;70:3744–3748. [Google Scholar]
- 5.Wang LV. Prospects of photoacoustic tomography. Medical Physics. 2008 Dec.35(12):5758–5767. doi: 10.1118/1.3013698. [DOI] [PMC free article] [PubMed] [Google Scholar]
- 6.Wang Lihong. Multiscale photoacoustic microscopy and computed tomography. Nature Photon. 2009;3:503–509. doi: 10.1038/nphoton.2009.157. [DOI] [PMC free article] [PubMed] [Google Scholar]
- 7.Xie Zhixing, Jiao Shuliang, Zhang HaoF, Puliafito CarmenA. Laser-scanning optical-resolution photoacoustic microscopy. Opt. Lett. 2009;34:1771–1773. doi: 10.1364/ol.34.001771. [DOI] [PubMed] [Google Scholar]
- 8.Rao Bin, Yu Lingfeng, Chiang HuihuaKenny, Zacharias LeandroC, Kurtz RonaldM, Kuppermann BaruchD, Chen Zhongping. Imaging pulsatile retinal blood flow in human eye. J. Bio. Opt. 2008;13(4):040505. doi: 10.1117/1.2967986. [DOI] [PMC free article] [PubMed] [Google Scholar]
- 9.Ku G, Maslov K, Li L, Wang LV. Photoacoustic microscopy with 2-µm transverse resolution. J. Bio. Opt. 2010;15(2):09322SSR. doi: 10.1117/1.3339912. [DOI] [PMC free article] [PubMed] [Google Scholar]
- 10.Laser Institute of America, American National Standard for Safe Use of Lasers ANSI Z136.1-2000. American National Standards Institute, Inc.; 2000. [Google Scholar]
Associated Data
This section collects any data citations, data availability statements, or supplementary materials included in this article.


