Abstract
A computer simulation study has been conducted to investigate the feasibility of a positron emission tomography (PET) detector design by using micro-channel plate (MCP) photomultiplier tubes (PMT) with transmission-line (TL) read-out and waveform sampling. The detector unit consisted of a 24×24 array of pixelated LSO crystals, each of which was 4×4×25 mm3 in size, and two 102×102 mm2 MCP-PMTs coupled to both sides of the scintillator array. The crystal (and TL) pitch was 4.25 mm and reflective medium was inserted between the crystals. The transport of the optical photons inside the scintillator were simulated by using the Geant4 package. The output pulses of the MCP-PMT/TL unit were formed by applying the measured single photo-electron response of the MCP-PMT/TL unit to each individual photon that interacts with the photo-cathode of the MCP-PMT. The waveforms of the pulses at both ends of the TL strips were measured and analyzed to produce energy and timing information for the detected event. An experimental setup was developed by employing a Photonis Planacon MCP-PMT (XP85022) and a prototype TL board for measuring the single photo-electron response of the MCP-PMT/TL. The simulation was validated by comparing the predicted output pulses to measurements obtained with a single MCP-PMT/TL coupled to an LSO crystal exposed to 511 keV gamma rays. The validated simulation was then used to investigate the performance of the proposed new detector design. Our simulation result indicates an energy resolution of ~11% at 511 keV. When using a 400–600 keV energy window, we obtain a coincidence timing resolution of ~323 ps FWHM and a coincidence detection efficiency of ~40% for normally-incident 511keV photons. For the positioning accuracy, it is determined by the pitch of the TLs (and crystals) in the direction normal to the TLs and measured to be ~2.5 mm in the direction parallel to the TLs. The energy and timing obtained at the front- and back-end of the scintillator array also show differences that are correlated with the depth of interaction of the event.
Keywords: Positron Emission Tomography, Micro-Channel Plate Photomultiplier, Transmission-Line Readout, Time Resolution
1. Introduction
The micro-channel plate (MCP) photomultiplier tube (PMT) [1] is a promising photo-detector for positron emission tomography (PET) application due to its excellent positioning accuracy, fast time response, and compactness in comparison with the conventional PMT. Despite these merits, it has not been widely adopted for developing PET detectors. Ideas of using MCP-PMT in PET and auto-radiography are found in the literature [2][3]. Recently Weisenberger et al [4] and Salvador et al [5] reported on a mobile cardiac PET/SPECT (single photon emission computed tomography) system and a small animal PET system that used Photonis 2″×2″ MCP-PMTs. While they showed that MCP-PMT is applicable for building PET detectors, its fast-time characteristics was not fully exploited in their designs. Presently, ideas for building thin, large-area MCP-PMT (e.g, 8″×8″) cost effectively have been proposed [6]. One attractive feature of this design is a transmission line (TL) readout that reduces the channel count while still providing good spatial resolution. Once such MCP-PMT is realized, it is an excellent candidate for building low-cost, high-sensitivity PET systems having time-of-flight (TOF) timing resolution.
We investigated the feasibility of developing a PET detector module that employed pixelated, thick LSO crystals and two MCP-PMTs with transmission-line (TL) readout and waveform sampling. The LSO has high density for yielding a high detection efficiency for 511 keV gamma rays. It also has a high light-yield that can lead to good energy resolution. The fast decay and high light-yield of the LSO, and the fast timing characteristics of the MCP-PMT, make the design attractive for TOF PET imaging. By measuring the light outputs at two ends of the scintillator array, depth-of-interaction (DOI) measurements can be generated [7]. With its slim thickness, we do not expect the front MCP-PMT to cause substantial attenuation and scattering of the 511 keV gamma rays. The use of the TL readout scheme and waveform sampling [8] allows one to substantially extend the size of the detector module without requiring more electronics channels for data acquisition and processing. In combination with the aforementioned economic, large-area MCP-PMT currently under development, the design concept will have considerable cost benefit. At the same time, with waveform samples sophisticated processing can be applied for extracting accurate event information. The electronics is also more robust. We developed computer simulation codes based on the Geant4 [9] and experimentally measured response functions, and employed the developed codes to study the performance properties of the proposed detector design. An intermediate simulation of the experimental setup was also made to calibrate the simulation code by comparing the measured experimental results. Validated simulations were then used to explore the predicted performance of the crystal array coupled to two MCP-PMTs in coincidence. Our result demonstrates that the proposed detector design is very attractive.
The rest of this paper is organized as follows. In Section 2, the proposed detector design, and the simulation codes are discussed in detail. In Section 3, the experimental setup for validating the simulation codes are described. Section 4 presents the performance properties obtained for the detector design by simulation. Discussion and summary are given in Section 5.
2. Detector design and simulation
2.1. Design of the detector module
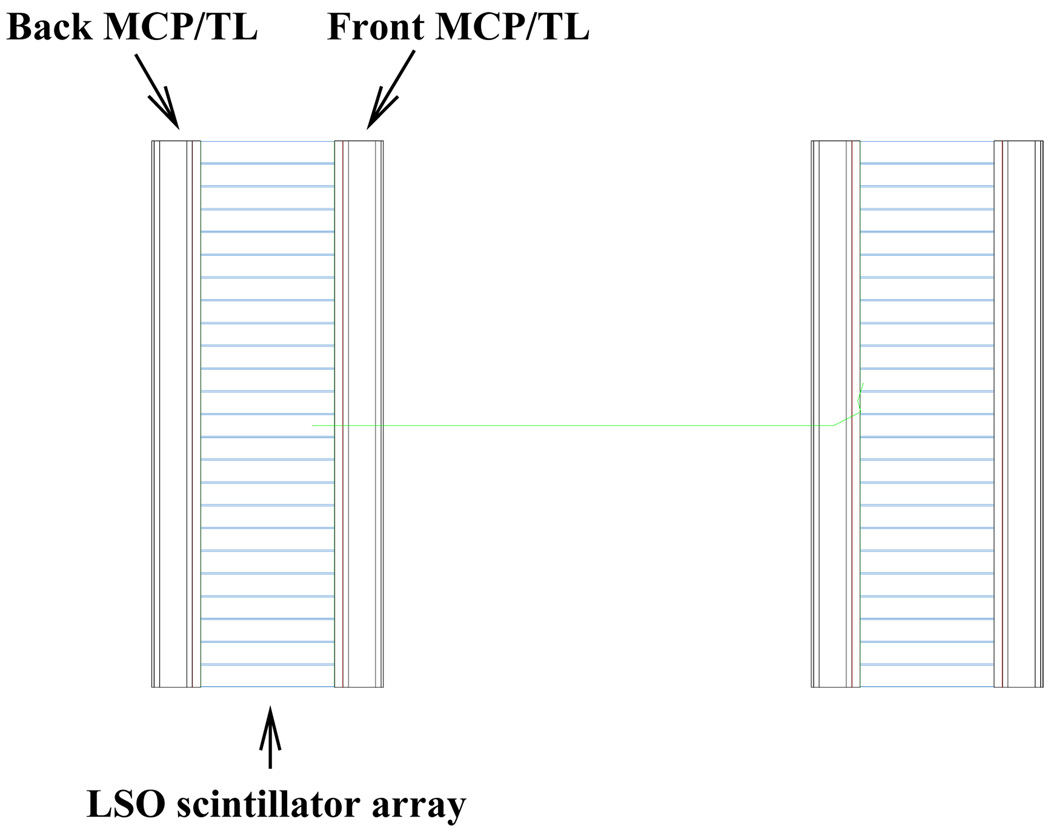
Figure 1 shows two opposing detector modules for coincidence imaging and illustrates the proposed configuration of the detector module. The detector module consists of 24×24 LSO crystals and two MCP-PMTs coupled to the front and back sides of the scintillator array. LSO provides attractive properties for PET imaging: it provides high light-yield (20–30/keV), fast decay (~40 ns), high density (7.4 g cm−3), high effective atomic number (66), and large photo-fraction (~32.5%) [10][11]. It is readily available and has been widely considered for developing high-resolution PET and TOF PET systems. We propose 4×4×25 mm3 LSO crystals with a 4.25 mm crystal pitch. With the selected crystal size and pitch, we anticipated a coincidence imaging resolution of ~2.1 mm, which is adequate for human imaging. Since clinical PET would be more benefited from the fast timing and large area of the MCP-PMT than small animal PET, the dimension of the crystal pixel was chosen aiming for clinical PET application. Based on the LSO’s linear attenuation coefficient (0.88 cm−1) at 511 keV, the 25 mm crystal thickness would yield ~89% detection efficiency. Depending on the energy window used, the actual detection efficiency could be considerably lower.
Figure 1.
Detector configuration with two modules. Each module consists of a 24×24 array of pixelated LSO scintillators and two MCP-PMTs coupled to the scintillators at the front and back sides. The distance between two modules is set to 8cm.
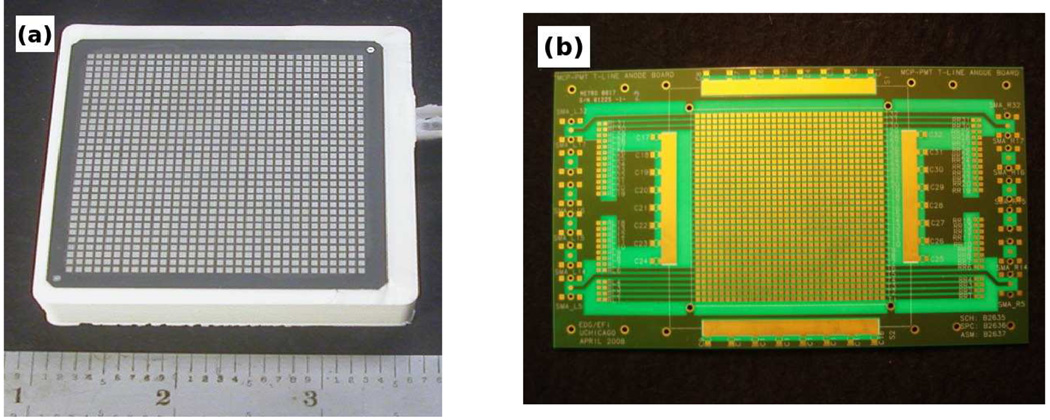
We bench-marked the proposed detector design based on the response characteristics of the Photonis Planacon MCP-PMT (XP85022) [12]. Figure 2 shows a 2″×2″ Photonis XP85022 having a custom-made 32×32 anode grid and a prototype TL board that contains 32 TL strips, each of which reads out anodes on a row or column. In the simulation study, we however considered a 102×102×9.1 mm3 MCP-PMT in order to match with the size of the scintillator array. Similarly, the TL board was assumed to have 24 strips with a 4.25 mm pitch. A MCP-PMT/TL unit has 2D positioning capability: Positioning along the normal direction to the TL strips can be derived from the relative signal amplitudes received at the TL strips (called energy-based positioning below). Positioning along the TL strips, on the other hand, can be determined by using the time difference between the pulses reaching the ends of the TL strip (called time-based positioning below). Below in Section 2.2.1, we will discuss these positioning methods in detail. Energy-based positioning has been widely and successfully used in PET; on the other hand, time-based positioning is new. In this investigation, we therefore placed the front/back MCP-PMT/TL in orthogonal directions so that crystal identification can be achieved by using energy-based positioning in case time-based positioning cannot provide the needed resolution. DOI blurring was expected to be strong with the use of 25 mm thick crystals. Asymmetries between certain properties of the readouts of the front and back MCP-PMT/TL were explored for providing DOI measurements. Compared to the individual crystal pixel readout, the TL scheme reduces the number of readout channels efficiently. (e.g, 576 electronics channels would be needed to read individual crystal pixel outputs while the TL scheme reduces it to 48.)
Figure 2.
(a) Photonis Planacon MCP-PMT (XP85022) having 1024 (32×32) anodes and (b) a prototype Transmission-Line (TL) board with 32 micro strips. One TL strip makes contact with only one row of the MCP-PMT anodes and signals are read out at both ends of the strip.
2.2. Detector simulation
To investigate the proposed detector design, we developed Geant4-based codes to simulate the interactions of gamma rays with the detector, and the generation and transport of the optical photons inside the scintillator array. The optical photon’s behavior at the boundary surfaces was based on the UNIFIED model [13]. The surface of the scintillator was treated as ground, except for the interface to the MCP, which was polished and treated with optical grease for better light collection. The simulation also assumed that reflective media was inserted between the scintillator crystals in the array. For coincidence-event simulation, 511 keV gamma pairs were generated back-to-back to impinge on the centers of the two opposing detector modules shown in Figure 1. To study DOI, the injection position of the 511 keV gamma was varied along the length of the scintillator.
2.2.1. Signal forming
For every gamma-ray photon interacting with the detector, our Geant4 codes generated a list of scintillation photons that reached the MCP-PMT photo-cathode, recording the position and time for individual photon. The following procedure was then applied to this photon list to generate the electrical pulses on the TL strips.
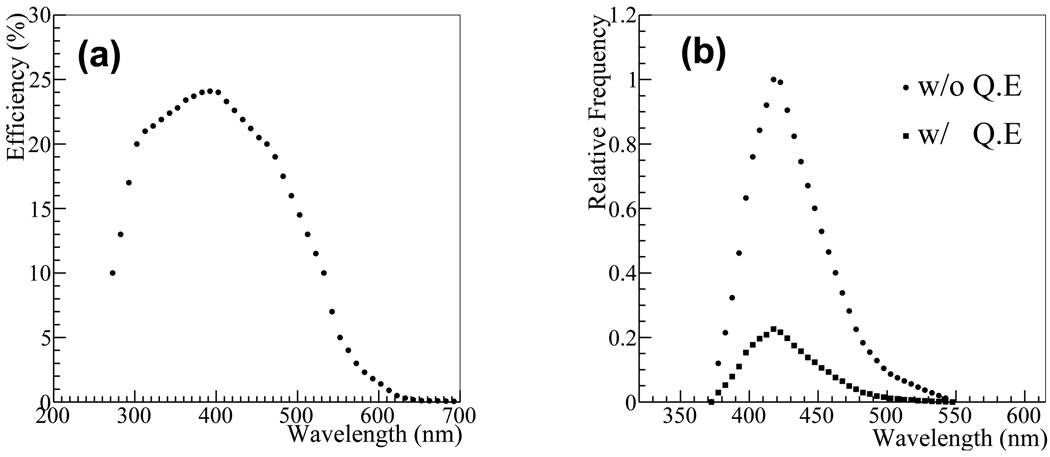
A photo-electron was generated or not for each photon, in accordance with the wavelength of the photon and the quantum efficiency (QE) of the MCP-PMT at this wavelength. The QE provided by the manufacturer, which is shown in Figure 3-(a), was used. The photo-electron was generated at the time and position the photon hit the photo-cathode.
Electron amplification within the MCP-PMT was assumed to take place and the electron cloud was assumed to follow a normal line from the release position of the photo-electron at the photo-cathode plane to the anode plane. At the anode plane, the amplified electrons were assigned to the position on the closest TL strip.
The amplified electrons were then spread to the adjacent TL strips in accordance with the measurements obtained with the MCP-PMT/TL shown in Figure 2.
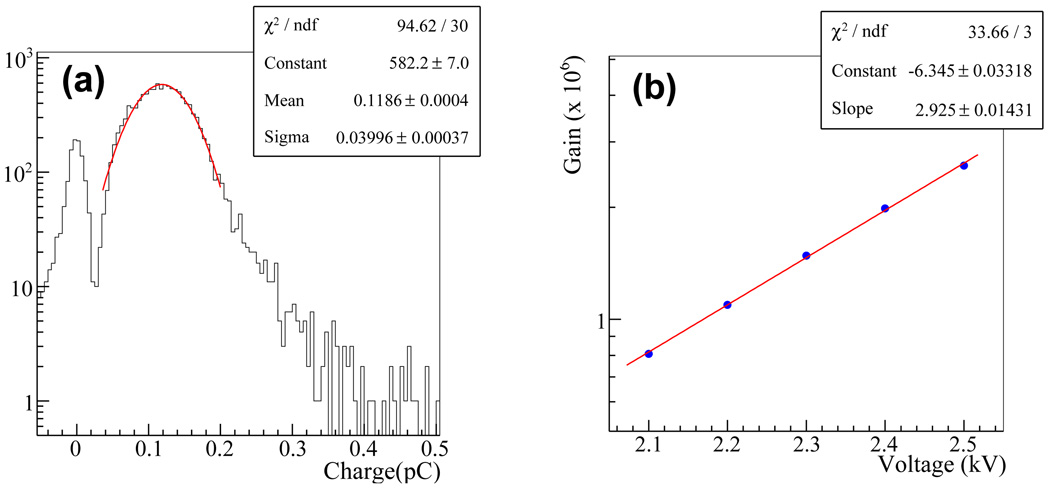
Each electron reaching a TL strip induced a single electron response (SER); hence, the resulting pulse was a convolution of the SER with the history function of the electron arriving at the TL strip [14]. The SER was again measured by using the MCP-PMT/TL shown in Figure 2. To account for variations in the MCP-PMT gain and electron transit time, the amplitude of the measured SER was randomly varied by 80% FWHM (see Figure 6-(a)) and the transit time by 80 ps FWHM [15]. In both cases, Gaussian distributions were assumed.
Figure 3.
(a) QE of the XP85022 MCP as a function of the wavelength of photon (from the XP85022 specification sheet) (b) spectra of the optical photons arrived at the photo-cathode before/after applying the QE (Geant4 simulation result).
Figure 6.
(a) Integrated charge distribution due to a single photo-electron. Due to signal spread, charges of 3 TL pulses were summed together. Charge generated by a single photo-electron was estimated to be 0.1186 pC by the Gaussian fitting. (b) XP85022 MCP gain as a function of HV. Each data point was calculated from the measured charge distribution.
The above procedure generated electrical pulses at locations on the TL strips in a neighborhood below the position where the photo-electron was released on the photo-cathode. By using measured SER and signal spread, our simulation incorporated the characteristics of real MCP-PMT and TL board. The measurement procedures are described below in Section 3.1.
2.2.2. Signal readout and processing
The TL readout scheme is depicted in Figure 4. The electrical pulse generated on a TL strip by the procedure described above would propagate in opposite directions to reach the ends of the TL strip (using the measured speed of propagation of 1.1 mm/10 ps [16]). Since our TL board has a wide bandwidth, we assumed no degradation to the pulse shape as it propagated along the TL strip. Also, no electronic noise was introduced. At the ends of the TL strips, the waveforms of the electrical pulses were recorded at 10–20 giga-samples per second (GS/s). In actual measurement, this sampling is currently achieved by using a digital oscilloscope. We are also developing a sampling chips capable of a 20 GS/s sampling rate that can be useful for such waveform sampling [17]. From the waveform samples, event information was derived as follows: The event energy observed on a particular TL strip was estimated by using the summed amplitudes of the two pulses measured at its ends, i.e., by summing its waveform samples. Let ei denote the energy observed on the ith TL strip, the detected energy of the event was then estimated by
| (1) |
Figure 4.
Principle of the Transmission-Line (TL) readout. Upon electron clouds arriving at a TL at time T0 and the location as indicated, two correlated pulses are generated and propagate toward the ends of the TL, where they are detected. By measuring the time difference, the interaction position along the TL can be inferred. The summed amplitude of the signals measured at the two ends yields the amplitude of the input signal. The average of the event times obtained at the ends (T1 and T2) gives the event time T0 (plus a constant offset).
In energy-based positioning, the detected position of the event normal to the TL strips was calculated by using
| (2) |
where yi is the positions of the ith TL strip. In the current study, the above summation was performed over 5 TL strips surrounding the maximum-energy TL strip (our simulation study showed that these 5 TL strips collected ~98% of the total signal). The arrival time of the pulse observed at one end of the TL strip was determined by using leading-edge (LE) discrimination employing 3 mV threshold. Let t denote the time electrons reaching the TL strip, and t1 and t2 the observed arrival time at the two ends of the TL strip. Clearly, t1 = t + l1/υ and t2 = t + l2/υ, where l1 and l2 are the path lengths that the pulses travel to reach the ends and υ is the propagation speed of the pulse. It follows that
| (3) |
| (4) |
where L = l1 + l2 is the length of the TL strip. Neglecting the constant terms, we could therefore estimate the detection time of the event on a TL strip by the average of the arrival time observed at its two ends. Similarly, the detected position of the event along the TL strip could be estimated by using time-based positioning given by x = υ(t2 − t1)/2.
The proposed detector design contained two MCP-PMT/TL, each of which would generate estimates for the energy and 2D position of the event, and also detection time on every TL strips. The sum of the estimated event energies obtained by these MCP-PMT/TL then yielded the final estimate for the event energy. The event time was taken as the average of arrival times determined at both ends of the TL strip receiving the maximum energy. As mentioned above, the two MCP-PMT/TL were placed in orthogonal directions. Therefore, we could obtain 2D event position by using either energy-based positioning, time-based positioning, or some combination of them. In this work, we compared the resolution capability of the energy-based and time-based positioning methods and examined whether the latter is a suitable technology for PET.
3. Experimental Tests for Simulation calibration
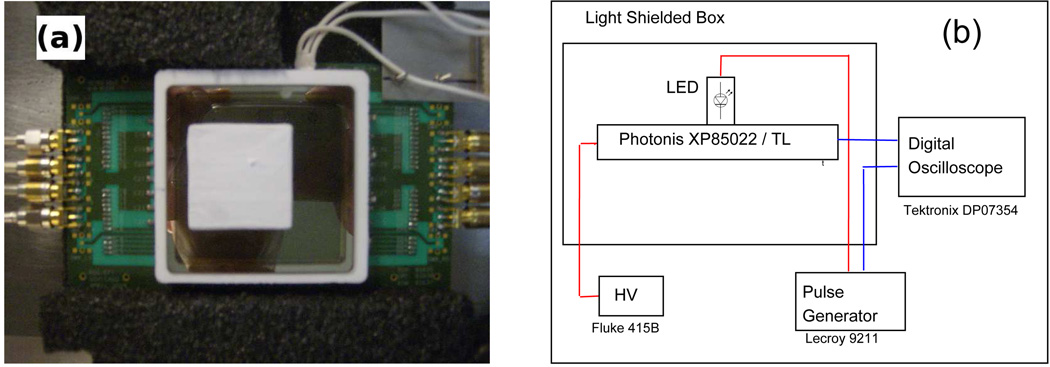
We measured the single photo-electron response (SER) by using a Photonis XP85022 MCP-PMT and prototype TL board for calibrating our simulation codes. We also measured the coincidence response of the MCP-PMT/TL coupled to a single LSO with an additional LSO/PMT (Hamamatsu R9800) unit to validate the developed simulation codes. Figure 5-(a) shows the assembled MCP-PMT/TL with the XP85022 on top of the TL board. The XP85022 is a chevron MCP-PMT with a pore diameter of 25 µm and a custom-made 32×32 anode grid. The prototype TL board has 32 strips with a 1.6 mm pitch to match with that of the anode grid. One TL strip makes contact with one row (or column) of the anodes and signals from the MCP-PMT are read at both ends of the strip. Our current prototype only provides 4-TL readout with SMA connectors.
Figure 5.
(a) A XP85022 MCP/TL assembly. Four TLs at the middle have SMA type connectors for readout. (b) Block diagram for measuring single electron response with LED as a light source.
3.1. Single Photo-electron Responses
Figure 5-(b) illustrates the setup for measuring the SER of the MCP-PMT/TL. A LED (CMD204UWC-ND, CML Tech. Inc.) encased in a cylindrical holder was placed on top of the MCP-PMT. The light from the LED was localized through a 0.8 mm diameter aperture and was controlled by a pulse generator (Lecroy 9211) at single-photon level. The high voltage (HV) for the XP85022 was provided by a Fluke 415B HV supply, at −2300V. The waveforms of the output pulses at three TLs were recorded by using a Tektronix DPO7354 digital oscilloscope that samples the waveform at 10–20 GS/s sampling rate.1 The spread of the signal across TLs in response to a single photo-electron was observed to be larger than the TL pitch. Therefore, the charge induced by a single photo-electron was obtained by integrating the pulses from all three TLs. Figure 6-(a) shows the resulting distribution of the induced charge obtained at −2300V HV. The mean of this distribution was obtained by a Gaussian fitting. This yields a mean value of 0.1186 pC per single photo-electron, which is equivalent to a gain of ~1.5×10⁶. In addition, the fitting yielded a FWHM of ~80%. The absolute gain of the MCP-PMT/TL was similarly measured for HV from −2100V and −2500V. The result shown in Figure 6-(b) indicates that the gain grows exponentially with the HV. Unless mentioned otherwise, the tests described below are all conducted at −2300V.
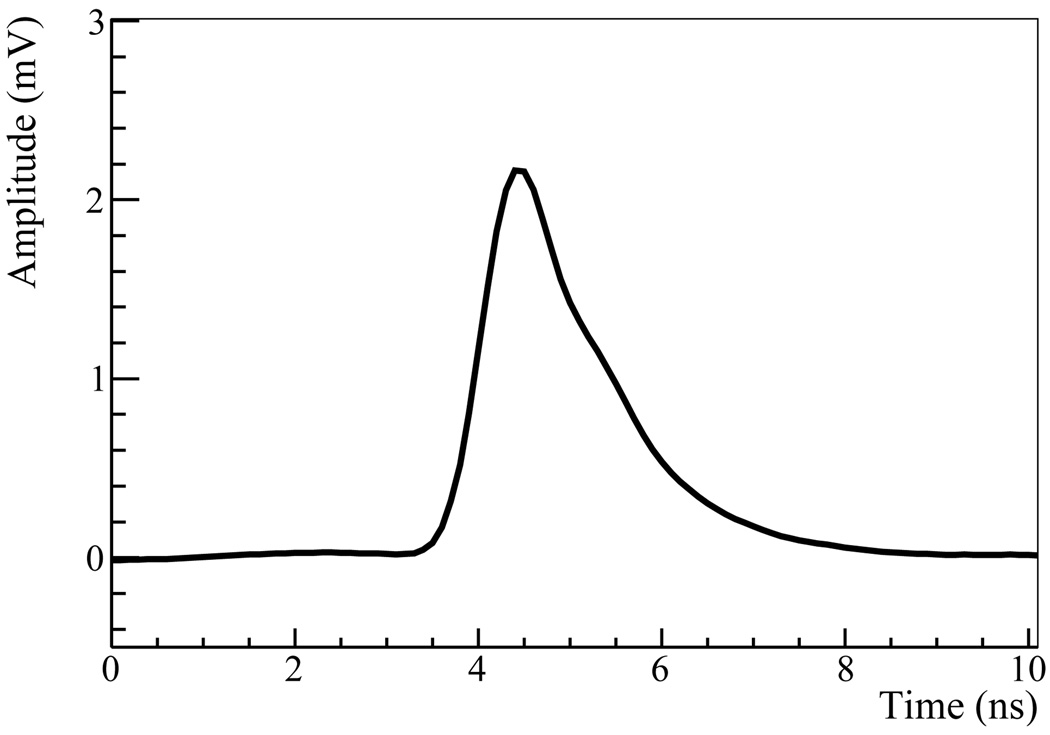
Figure 7 shows the measured SER obtained by averaging ~10 k pulses in the set given by ± 1.5σ of the mean shown in Figure 6-(a). These pulses were aligned by fixing their peaks at the same time position. The SER shows a rise time of ~560 ps.
Figure 7.
Averaged pulse shape of single photo-electron from ~10 K events around the peak in Figure 6-(a).
3.2. Responses to 511 keV gamma rays
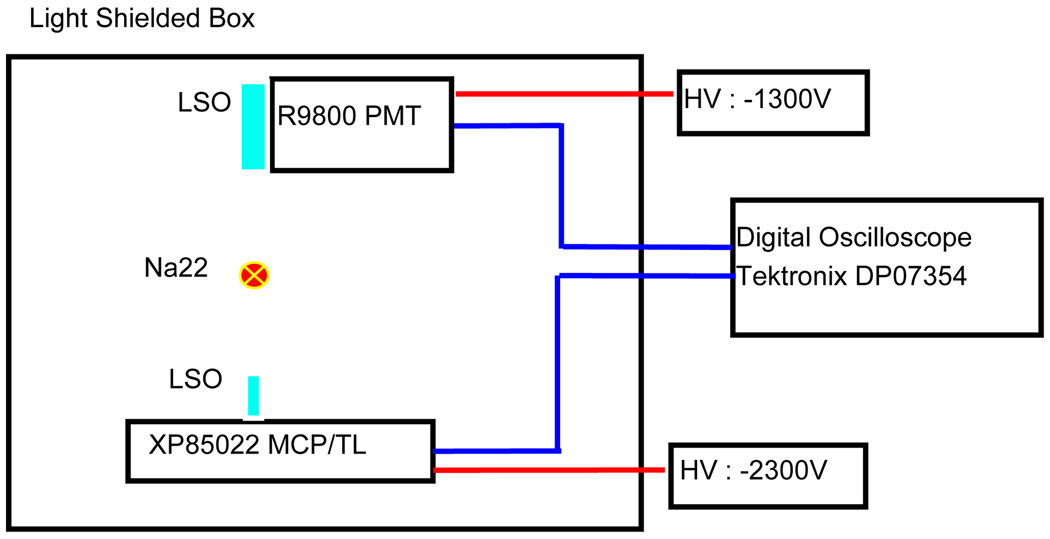
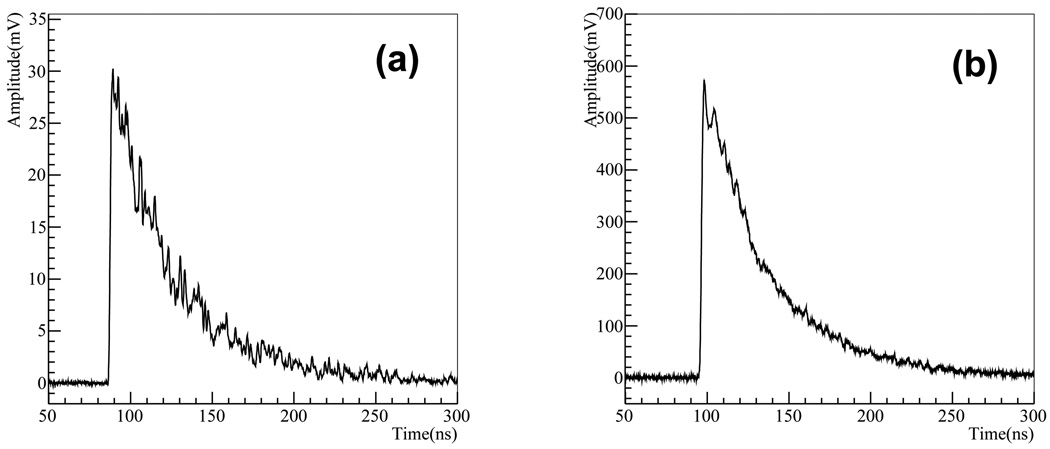
A LSO scintillator, polished at all surfaces, of 1×1×10 mm3 was coupled to the MCP-PMT/TL. For coincidence detection, another 6.25×6.25×25 mm3 LSO coupled to a Hamamatsu R9800 PMT operated at −1300V was placed at 3 cm away. A Na22 source having ~1 µCi activity was placed halfway between the two crystals (see Figure 8). The waveforms from three TLs of the MCP-PMT/TL and the R9800 PMT were recorded by using the DPO7354 digital oscilloscope. The coincidence events were triggered at a 40 mV threshold for the R9800 PMT and a 8 mV threshold for the MCP-PMT/TL, respectively. The typical pulse shapes from the maximum signal MCP-PMT/TL strip and R9800 PMT are shown in Figure 9.
Figure 8.
Block diagram of the experimental setup for detecting 511 keV gamma coincidence event.
Figure 9.
Typical waveforms of the coincidence event are shown for (a) MCP/TL strip and (b) R9800 PMT. The waveforms were recorded by DPO7354 oscilloscope at 20 GS/s sampling.
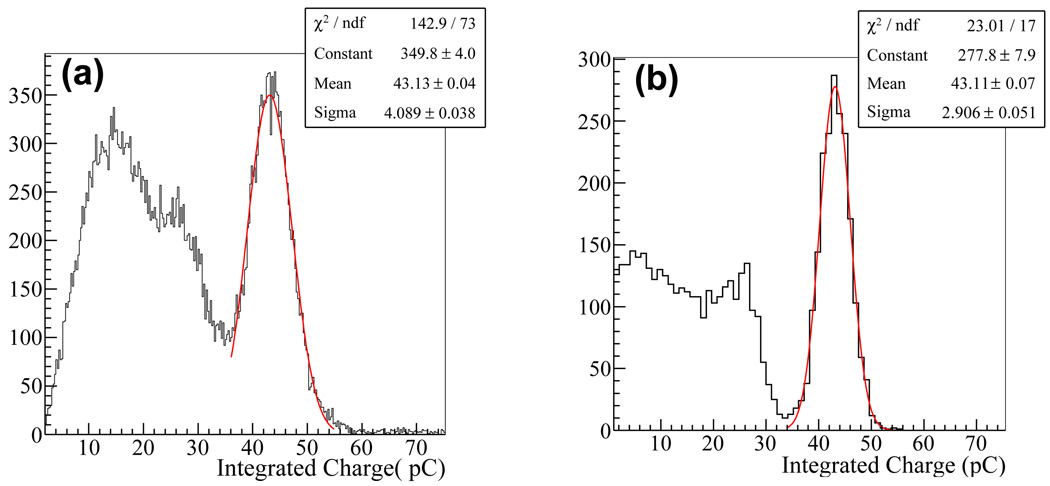
The integrated charge distribution of the MCP-PMT/TL, again obtained by summing the outputs of all three TLs, is shown in Figure 10-(a). The peak corresponding to 511 keV and the Compton continuum were clearly seen. In comparison, the charge distribution was also evaluated by applying our simulation codes to obtain the distribution shown in Figure 10-(b). In simulation, the MCP-PMT/TL signal was not confined to the three TLs. In fact, we found that these three TLs contained only~87% of the signal. In simulation, in addition to the QE we also introduced a collection-efficiency parameter to account for the open-area ratio of the MCP-PMT. To make the peak location of the simulated distribution agree with the measured one, a collection efficiency of 0.8 was used, which is consistent with the value provided by the XP85022 specification sheet. The distributions obtained by measurement and simulation are observed to agree well qualitatively. Two notable differences are the shape of Compton-scattering component and the energy resolution at peak: we observed an energy resolution of ~22% from measurement and ~16% from simulation. These differences may be due to incomplete readouts by using only three TL strips. We are re-designing a TL board to provide full readout of its 32 TL strip to address this issue.
Figure 10.
Charge distribution of the MCP/TL from experiment (a) and simulation (b). ~22% FWHM (~16% in simulation) of energy resolution was obtained by applying Gaussian fit on the peak corresponding 511 keV.
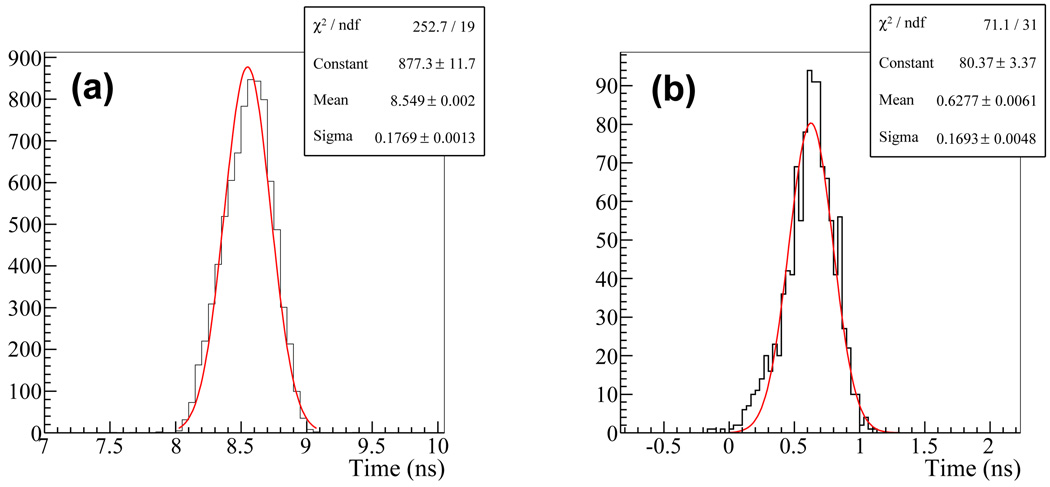
Figure 11 compares the coincidence time distributions between the MCP-PMT/TL and R9800 PMT obtained by measurement and simulation. These distributions were obtained by including events having an integrated charge between 35 and 60 pC on the MCP-PMT/TL which was equivalent to energy window of 415 and 710 keV. For both the real and simulation data, event timing was determined by the the leading-edge (LE) time pickup method with 3 mV and 50 mV thresholds to the signal waveforms of the MCP-PMT/TL and R9800 PMT, respectively. These threshold levels correspond ~10% of the maximum amplitudes of the signal generated by the respective detectors. By applying Gaussian fit, the coincidence timing resolution was measured to be ~416 ps FWHM from the measurement and ~398 ps FWHM from simulation. Again, the simulation and measurement results agree quite well. By using two identical LSO/R9800 PMTs, the contribution from the R9800 PMT to the coincidence timing resolution was estimated to be ~200 ps FWHM. Thus, the timing resolution of the MCP-PMT/TL is estimated to ~360 ps FWHM.
Figure 11.
Coincidence timing distributions: (a) the experimental test and (b) the simulation. A coincidence timing resolution of ~416 ps FWHM (~398 ps in simulation) was estimated from Gaussian fit.
4. Performance evaluation of the detector design
The results shown in this section are obtained by analyzing 20k simulated events. For each coincidence event, two 511 keV gamma were injected to the central scintillator crystal of the detector whose coordinate was (2.125 mm, 2.125 mm). Positron range and photon non-colinearity were not modeled. The output pulses of the MCP-PMT/TL were formed and analyzed as described above in Sections 2.2.1 and 2.2.2.
4.1. Energy
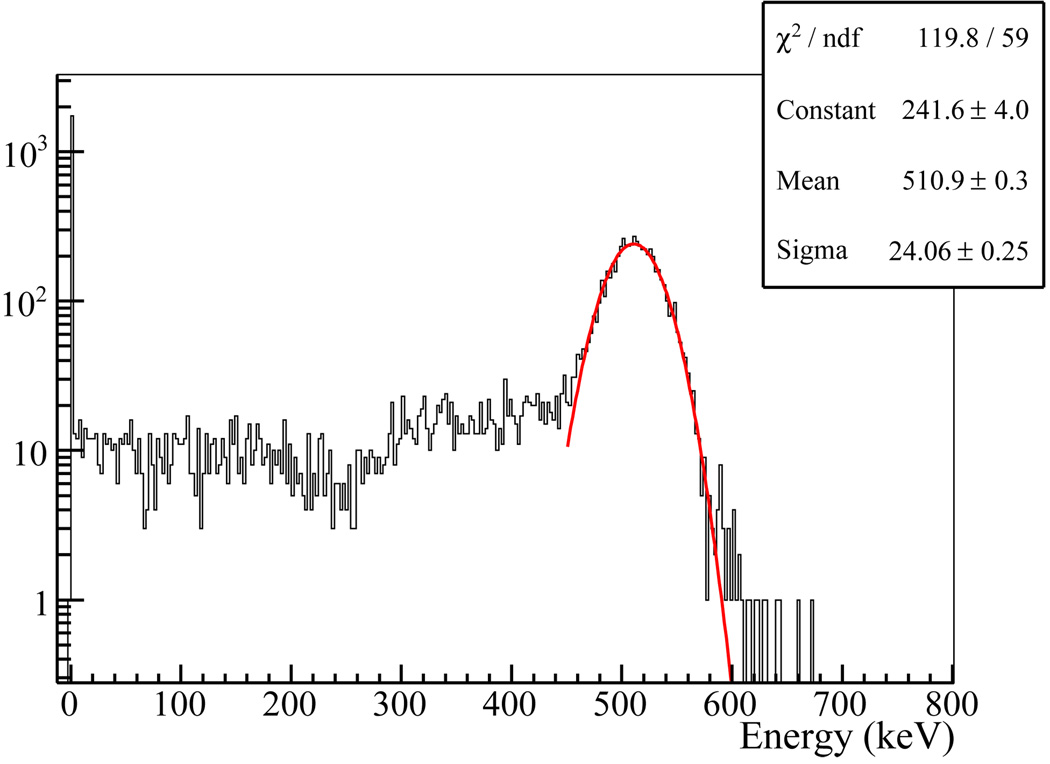
To obtain energy in each event, the TL strip having the maximum signal was searched (called the maximum TL strip below) and then the signals of the five TL strips, having the maximum TL strip at the center, were summed. The results of the front and back MCP/TLs of a detector module were then summed to provide the energy measurement for an event. Figure 12 shows the resulting energy spectrum, which indicates a 11.0% energy resolution at 511 keV.
Figure 12.
Pulse height spectrum obtained at one detector module. The peak at zero energy corresponds to the events that pass the scintillator array without interaction. Fitting the photo-peak with a Gaussian function indicates a 11% energy resolution at 511 keV.
4.2. Timing resolution and detection efficiency
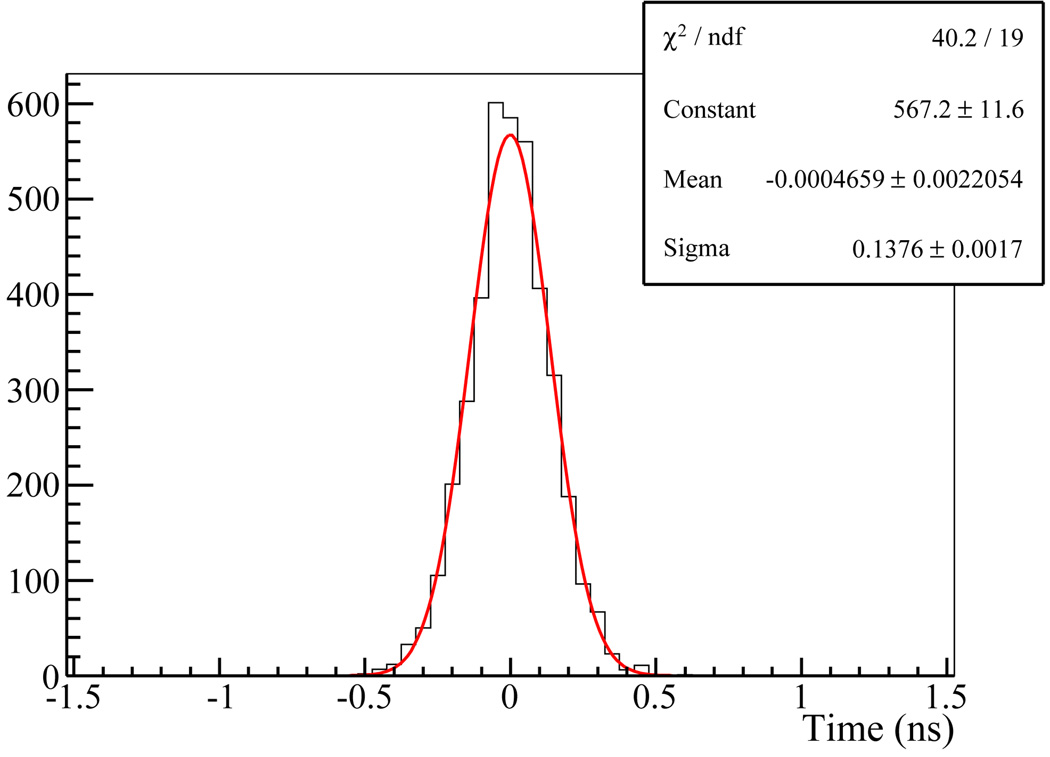
The event time was obtained by applying the LE time pickup method using 3 mV threshold to the waveforms obtained at the maximum TL strip. The measured timings at the front and back MCP/TL are averaged to reduce the effect of DOI on the timing determination. Figure 13 shows the coincidence timing histogram obtained by using a 400–600 keV energy window. The result shows ~323 ps FWHM coincidence timing resolution. With this energy window, the coincidence detection efficiency for normally incident coincidence events was measured to be ~40% (thus, each module had a detection efficiency of ~63%).
Figure 13.
Coincidence timing histogram. Event time in each module was determined by applying the LE pickup method, using a 3 mV threshold, to the waveforms obtained at the maximum TL strip. A coincidence timing resolution of ~323 ps FWHM was estimated from Gaussian fit.
4.3. Position
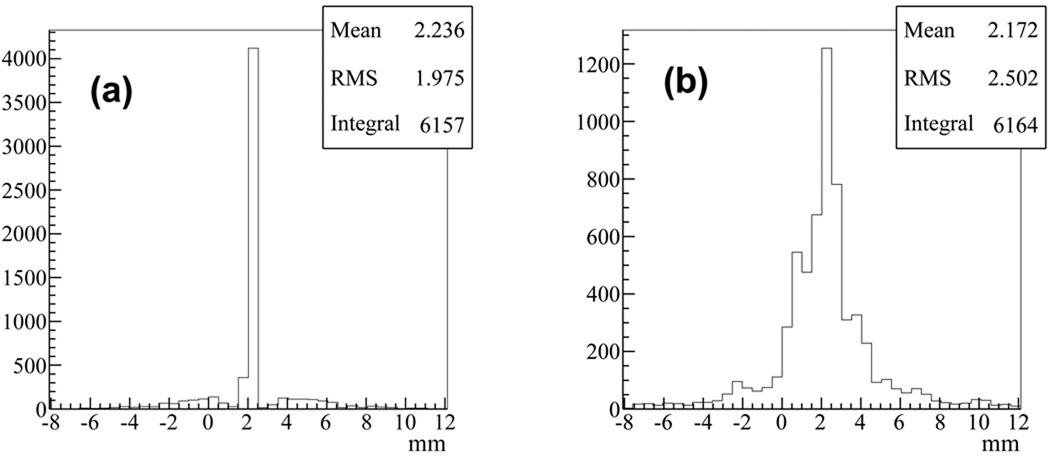
Figure 14-(a) shows the histogram of the event position obtained by applying energy-based positioning to the front MCP-PMT/TL employing an energy window of 400–600 keV. Since the scintillators were pixelated with polished side surfaces, lights produced in a scintillator crystal were highly constrained to travel inside the crystal. As a result, Figure 14-(a) shows a discrete pattern for the estimated position. For multiple-scattering events that deposit their energies in multiple crystals, the energy-based positioning may result in incorrect estimate on the event position. The small bumps in Figure 14-(a) correspond to these mis-positioned events. In comparison, Figure 14-(b) shows the histogram of the event position obtained by applying time-based positioning to the back MCP-PMT/TL. (The front and back MCP-PMT/TLs are placed in orthogonal directions; therefore this provides position estimate in the same direction as previous) The mean of the position was consistent with that generated by energy-based positioning applied to the front MCP-PMT/TL. It is not discrete, however, and has a FWHM of 2.5 mm. This resolution is adequate with respect to the 4.25 mm crystal pitch investigated in this work.
Figure 14.
The position reconstructed using (a) the centroid and (b) the time difference on the TL.
4.4. Depth of Interaction
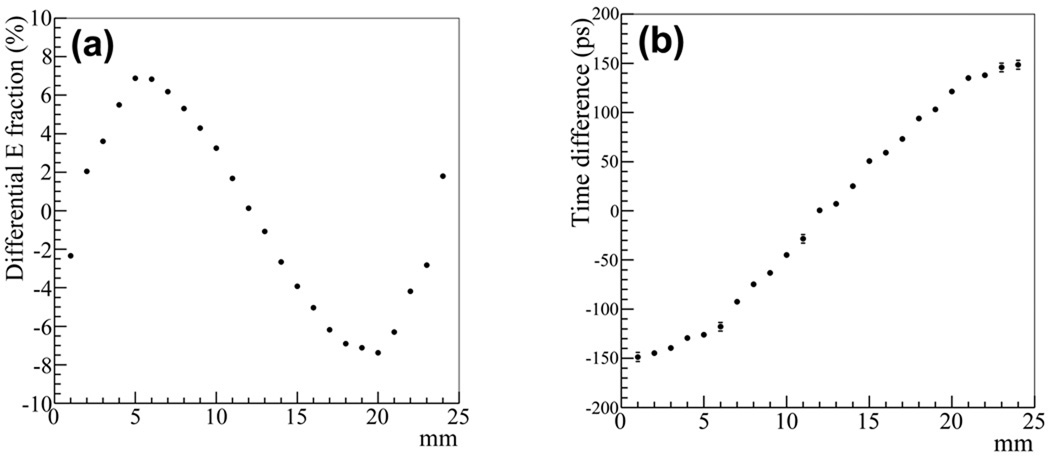
We investigated the correlations in the energy asymmetry and time difference between the front and back MCP-PMT/TL with the DOI. Energy asymmetry was defined as the ratio (Efront − Eback)/(Efront + Eback), where Efront and Eback are the event energy measured by the front and back MCP-MPT/TLs, respectively. The time difference is the difference between the event time observed at the most energetic TL strip on the front and back MCP-PMT/TLs. In this study, 511 keV gamma rays were injected from the side of the scintillator array with a 1 mm step along the depth. At each injection point, 20k events were generated. Figure 15 shows the correlations of the energy asymmetry and time difference with the known depth. The linear correlation between the time difference and DOI can be clearly seen. The S-shape curve observed for the correlation between the energy asymmetry and DOI might be due to total internal reflection: When optical photons are generated closer to the ends of the scintillator, a larger amount of light bounces back at the boundary of LSO/MCP by total internal reflection. In addition to using the correlation in time-difference, exploiting of this distinctive feature may lead to improved DOI measurement.
Figure 15.
(a) Energy asymmetry and (b) time difference between the signals at the front and back MCP-PMTs, as a function of the gamma injection position along the scintillator.
5. Discussion and Summary
We investigated a PET detector design that employs MCP-PMTs with TL readout and waveform sampling. The detector consists of 24×24 LSO scintillator array coupled to two MCP-PMT/TLs at front and back. Geant4-based simulation codes were developed and validated with measurements, based on using the Photonis XP85022 MCP-PMT and the prototype TL board. In our simulation study, we obtained ~11% energy resolution at 511 keV and ~323 ps FWHM coincidence timing resolution, while attained ~40% detection efficiency using the two modules in coincidence with 400–600 keV energy window at photopeak. When applying energy-based positioning, the event position can be accurately located to the center of the interacting crystal. When using time-based positioning, the event position can also be accurately estimated in the mean, with a spread of ~2.5 mm FWHM. The energy asymmetry and time difference of the signals measured by the front and back MCP-PMT/TLs show strong correlations with the DOI. The simulation results show that the design is suitable for TOF PET with high sensitivity and DOI capability.
The primary purpose of this study is to investigate the feasibility of the detector design concept. Therefore, optimization efforts to achieve the best performances have not been considered but will be the subject of interest in the next stage of our research. In addition, the results reported here were obtained by using simple processing of the output signals. More advanced processing will be investigated to achieve better performance properties. For example, the signal waveforms at the TL can be sampled and digitally processed for producing more accurate arrival-time estimate (and more accurate positioning along the TL when estimated by using the arrival time difference) than the LE method [18]. It is also possible to analyze the spatial pattern of the TL signals for improving the estimates of the event position, timing, and DOI [19].
Acknowledgment
We would like to thank Greg Sellberg for the excellent work in soldering the XP85022 MCP and TL board and Mark Zaskowski for various technical assistance.
Footnotes
PACS: 87.57.uk, 29.40.Mc
For measurements described in this section, only one side of the TLs was sampled with the other side terminated with 50Ω to avoid reflection. A correction factor of 2 was applied to the gain calculation.
References
- 1.Wiza JL. Nucl. Instr. and Meth. 1979;162:587–601. [Google Scholar]
- 2.McKee BTA, Stewart AT, Vesel J. Nucl. Instr. and Meth. 1985;234:191–197. [Google Scholar]
- 3.Lees JE, Fraser GW, Dinsdale D. Nucl. Instr. and Meth. 1997;392:349–353. [Google Scholar]
- 4.Weisenberger AG, Majewski S, Gilland D, Hammond W, Kross B, Popov V, Proffitt J, Mckisson J, Smith MF. IEEE NSS/MIC Conference Record; 2007. pp. 3705–3708. [Google Scholar]
- 5.Salvador S, Huss D, Brasse D. IEEE Trans. Nucl. Sci. 2009;56:17–23. [Google Scholar]
- 6.The Large Area Picosecond Photo-Detector Collaboration. http://hep.uchicago.edu/psec.
- 7.Huber JS, Moses WW, Andreaco MS, Petterson O. IEEE Trans. Nucl. Sci. 2001;48:684–688. [Google Scholar]
- 8.Anderson J, Byrum K, Drake G, Ertley C, Frisch H, Genat J-F, May E, Salek D, Tang F. IEEE NSS/MIC Conference Record; 2008. pp. 2478–2481. [Google Scholar]
- 9.Agostinelli S, et al. Nucl. Instr. and Meth. A. 2003;506:250–303. [Google Scholar]
- 10.van Eijk CWE. Radiation Protection Dosimetry. 2008;129:13–21. doi: 10.1093/rpd/ncn043. [DOI] [PubMed] [Google Scholar]
- 11.Karimian A, Thompson CJ. World Congress on Medical Physics and Biomedical Engineering. 2006:1698–1699. [Google Scholar]
- 12. http://www.photonis.com.
- 13.Levin A, Moisan C. IEEE NSS/MIC Conference Record; 1996. pp. 702–706. [Google Scholar]
- 14.Choong W. Phys. Med. Biol. 2009;54:6495–6513. doi: 10.1088/0031-9155/54/21/004. [DOI] [PMC free article] [PubMed] [Google Scholar]
- 15.Va’vra J, Leith DWGS, Ratcliff B, Ramberg E, Albrow M, Ronzhin A, Ertley C, Natoli T, May E, Bryum K. Nucl. Instr. and Meth. A. 2009;606:404–410. [Google Scholar]
- 16.Genat J-F, et al. “Position Sensing using Pico-Second Timing with Micro-Channel Plate Devices and Waveform Sampling”, Submitted to IEEE Trans. Nucl. Sci [Google Scholar]
- 17.Bogdan M, et al. IEEE NSS/MIC Conference Record; 2009. pp. 1929–1931. [Google Scholar]
- 18.Genat J-F, Varner G, Tang F, Frisch H. Nucl. Instr. and Meth. A. 2009;607:387–393. [Google Scholar]
- 19.Antich P, Malakhov N, Parkey R, Slavin N, Tsyganov E. Nucl. Instr. and Meth. A. 2002;480:782–787. [Google Scholar]


