

Abstract
This chapter covers several aspects of methodology of DNA content analysis in individual cells that is most commonly used for assessment of DNA ploidy and for enumeration of cells in particular phases of the cell cycle. Briefly presented are general principles of instrumentation and cell analysis by flow- and laser scanning- cytometry. Described are major methods designed to stain DNA with fluorochromes in live cells, in detergent-permeabilized cells, in cells fixed prior to DNA staining as well as in nuclei of cells isolated from paraffin-embedded tissues. Briefly addressed are approaches to estimate cellular DNA content in conjunction with cellular immunophenotype. Discussed are factors that affect accuracy of DNA content measurement such as: (i) differences in chromatin structure of the analyzed cells that restrict DNA accessibility to fluorochromes, (ii) stoichiometry of interaction between fluorochromes and DNA in chromatin and (iii) chemical mass action law defining dependency of fluorochrome binding to DNA in relation to fluorochrome concentration and number of potential binding sites in a sample. Described also are controls used to ensure accuracy of DNA ploidy determination, the principles in ploidy assessment and possible pitfalls in analysis.
Introduction
DNA content is the most frequently measured entity of the cell. Analysis of DNA content reveals cell ploidy, provides information on cell position in the cell cycle and also allows one to estimate frequency of apoptotic cells that are characterized by fractional DNA content. Distribution of cells within the major phases of the cell cycle is based on differences in DNA content between the cells in prereplicative phase (G0/1) versus the cells that actually replicate DNA (S phase) versus the postreplicative plus mitotic (G2 + M) phase cells (Fig. 1). It is generally accepted that DNA content measured by cytometry (DNA ploidy) is defined as DNA index (DI) and for normal (non tumor, euploid) cells in G0/1 phase of the cell cycle DI = 1.0. Cells in G2/M phase of the cell cycle have DI = 2.0 and the S-phase normal cells are characterized by 1.0 < DI < 2.0. Because extensive DNA fragmentation preferential to internucleosomal DNA sections takes place during apoptosis, the low molecular (mono- and oligo- nucleosomal) DNA fragments are extracted during cell preparation for staining and such apoptotic cells can be identified as the cells with fractional DNA content (DI < 1.0). They are often being defined as “sub-G1” or “sub-diploid” cell population (Fig. 2).1–4
Figure 1.

Schematic representation of cellular DNA content changes during cell cycle rogression. DNA replication during cell cycle is discontinuous, occurring exclusively during S phase (A), which results that the postreplicative G2-phase cell has twice higher cellular DNA content compared to the G1 cell (B). After completion of mitosis (M) the cell divides (undergoes cytokinesis) generating two daughter cells (G1) each having half DNA content of the mother cell (M). Based on differences in DNA content therefore one can distinguish G1 from S from G2M cells. When DNA content is measured in a population consisting of a large number of cells the data can be shown in a form of the cellular DNA content frequency histogram with a characteristic G1- and G2M- phase peaks at DNA content DI = 1.0 and DI = 2.0, respectively and S-phase cells are distributed in between the peaks (C).
Figure 2.
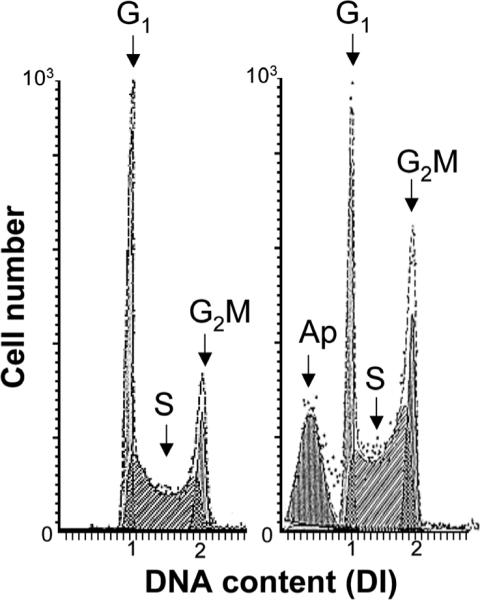
Location of apoptotic cells (Ap) on DNA content histograms. The presence of apoptotic cells manifests as the “sub-G1” (“sub-diploid”) peak on DNA content histograms. This is due to the fact that activation of endonucleases during apoptosis leads to DNA cleavage preferentially at internucleosomal (“linker”) sections1 and the fragmented mono- and oligo-nucleosomal DNA is extracted from cells during their processing and staining.2,3 It should be noted that apoptotic cells not always have so distinctly lower DNA content and can be well identified. In some instances, particularly if cells in G2M- and/or S-phase undergo apoptosis, DNA content of apoptotic cells may overlap with that of G1 cells.5
Flow- or laser scanning- cytometry (LSC) are the methodologies of choice for cellular DNA content analysis. They provide the means to estimate DNA content in individual cells in large cell populations rapidly and accurately (Figs. 3,4). Historical progression of development of cytometric methods and their application for cell cycle and DNA ploidy analysis have been recently reviewed.5 These methods rely on cells being labeled with a fluorochrome that is expected to stain DNA stoichiometrically and thus to accurately report DNA content. The intensity of DNA-associated fluorescence integrated over the individual cell or cellular nucleus is measured by photomultipliers. The latter offer a wide dynamic range of detection and measurement of fluorescence intensity, much wider compared with the alternative approach of fluorescence measurement, namely the fluorescence image analysis (FIA). A large number of DNA fluorochromes can be used for DNA content analysis and a great variety of techniques have been published during the past three decades.5 The techniques differ primarily by the mode of cell permeabilization (detergent versus prefixation), choice of the DNA-specific fluorochrome, composition of the stain solution and applicability to different cell preparations.
Figure 3.
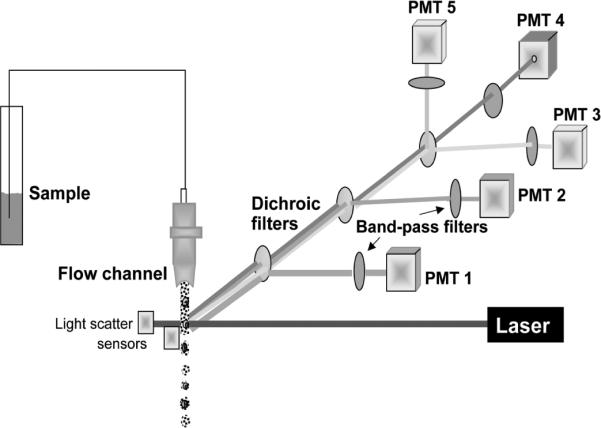
Schematic representation of flow cytometry. Suspension of fluorochrome-stained cells is transported through the cytometer fluidic system in which the individual cells transect the path of laser's beam. Their emission is collected by set of dichroic optical filters which reflect light at a specific wavelength towards the photomultipliers (PMTs) and transmit light at longer wavelength. The band-pass filters located in front of PMTs allow light to pass only at a specific, relatively narrow wavelength range. Intensity of fluorescence emission at these wavelength ranges, integrated over whole cell, is measured by individual PMTs. The light scatter signal generated by the cell when it passes through the laser beam is additionally measured, often at forward and 90° angle (“side scatter”), by separate sensors. The scatter signals provide information about cell size and some morphological features. More than 1,000 cells can be measured per second with an accuracy of fluorescence measurement approaching 1% and sensitivity approaching 200 molecules of fluorescein/cell. Many models of flow cytometers have not one but two or three lasers as excitation source, emitting at UV, blue, green and/or red wavelength. This allows one to select a desired fluorochrome from variety of the available ones. A color version of this image is available at www.landesbioscience.com/curie.
Figure 4.

Schematic representation of the laser scanning cytometer (LSC). The microscope is the key part of LSC and it provides structural and optical components. The emission beams from lasers are directed onto computer controlled oscillating mirror, which reflects them through the epi-illumination port of the microscope and images through the objective lens onto the slide. The mirror oscillations cause the laser beam to sweep the area of microscope slide under the lens. The slide is located on the computer-controlled motorized microscope stage which moves perpendicular to the laser beam scan at 0.5 μm steps per each scan. The cell-emitted fluorescence is collected by the objective lens and directed to the scanning mirror. Upon reflection it passes through a series of dichroic mirrors and emission filters to reach one of the PMTs, which records the fluorescence intensity at a specific wavelength range. Laser light scattered by the cell is imaged by the condenser lens and its intensity is recorded by sensors. A white-light source provides transmitted illumination to visualize the objects though an eyepiece or cameras. Up to 100 cells can be analyzed per second with accuracy and sensitivity comparable to that of flow cytometry (Fig. 3). A color version of the figure is available at www.landesbioscience.com/curie.
The results of cellular DNA content measurements are generally presented in the form of frequency histograms (Figs. 2,5). Discrimination of cells in particular phases of the cell cycle based on differences in their DNA content (deconvolution of the histograms) is helped by computer analysis. The software used for this purpose allows one to estimate the percentage of cells in major phases of the cell cycle (G1, versus S versus G2/M) as well as the frequency of apoptotic cells with fractional (“sub-G1”) DNA content.6,7 This software is often included with the purchase of the flow cytometer but is also commercially available (Phoenix Flow Systems, San Diego, CA; Verity Software, Topsham, ME).
Figure 5.
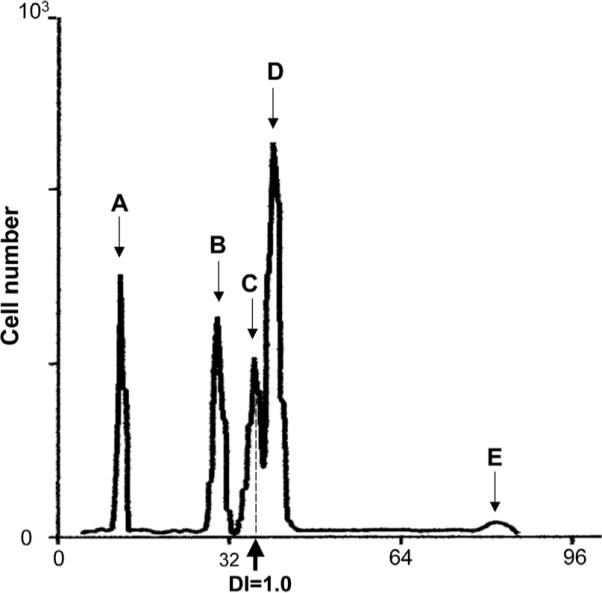
DNA content analysis of human breast cancer biopsy specimen according to the protocol developed by Vindelov et al.13,14 Cellular DNA content was measured in a sample obtained from a fine needle aspirate of a surgical biopsy of human breast cancer and stained with PI. Chicken erythrocytes and trout erythrocytes were included as internal standard. The peaks from left to right represent chicken (A) and trout (B) erythro cytes, diploid normal nuclei (C; DI = 1.0), hyperdiploid (DI > 1.0) population of tumor G0/1 phase cells (D) and G2 population of tumor cells (E). Under proper conditions of DNA staining, the ratio of the mean DNA content of diploid human cells to chicken erythrocytes is 2.857, the ratio to trout erythro cytes is 1.258 and the ratio of mean DNA content in trout vs chicken erythrocytes is 2.28.13 Another landmark of linearity in DNA content analysis is the ratio of G2 to G1 peaks, which is expected to be 2.0. Modified after Vindelov and Christensen.13
Supravital Cell Staining
Cellular DNA content can be fluorochrome-stained either in unfixed, usually still live cells, or in the cells following their fixation. Staining of live cells (supravital staining) requires use of a fluorochrome that penetrates the plasma membrane and stoichiometrically stains DNA. Unfortunately, the choice of such fluorochromes is limited. Hoechst 33342 is one of such dyes and when used in combination with the membrane potential sensing dye DiOC5(3) offers relatively good resolution in measurement DNA content of live cells.8 The dye is excited at UV wavelength (350 nm) and fluoresces in blue (460 nm). Inclusion of DiOC5(3) serves to suppress efflux of Hoechst 33342 from the cell by the active P-glycoprotein pump which otherwise breaks up equilibrium of the binding/staining reaction. Similar effect can be achieved by using the efflux blocker such as verapamil.9Another fluorochrome that is being used to supravitally stain DNA is DRAQ5.10 Its emission can be detected in far-red wavelength (maximal at 670 nm) while the excitation (maximal at 640 nm) is at wide range of the spectrum, stretching down to 488 nm.
The protocols designed to supravitally stain DNA are simple. Generally, inclusion of the fluorochrome into the culture medium for 30–60 min during cell culture is followed by subjecting cells to cytometric analysis without a need for rinsing or centrifugation. However there are cell type (cell line) differences in the rate of the fluorochrome uptake. Occasionally, therefore, several concentrations of the fluorochrome and various time of incubation, different than in the protocols e.g., provided by the vendors of the reagents, have to be tested to optimize staining conditions for a particular cell type. Furthermore, the resolution of DNA content analysis in cells supravitally stained is never as good as that of fixed or detergent-permeabilized cells. The application of protocols designed to supravitally stain DNA is primarily for cell sorting, where the cells selected based on differences in their DNA content can be further subcultured for the purpose of analyzing their growth characteristics, sensitivity to drugs, cloning or expanding their number. It should be noted, however, that exposure of Hoechst 33342-stained cells to UV light during sorting may damage their DNA and be cytotoxic.
DNA Staining after Disruption of Plasma Membrane
Treatment of live cells with detergents causes rupture of the plasma membrane or leads to nuclear isolation which makes DNA accessible to fluorochromes. This approach has been initially used to permeabilize cells to acridine orange, the metachromatic dye that differentially stains DNA and RNA.11 Exposure of cells to hypotonic salt solution also leads to their lysis and DNA within the nuclei isolated this way is accessible and can be stained with a variety of fluorochromes.12 Further improvement in the accuracy of DNA content analysis is obtained after controlled proteolysis of detergent-lysed cells. This approach was perfected by Vindel∅v and his collaborators who developed a highly accurate method of cellular DNA content measurement, particularly useful for analysis of DNA ploidy in human tumor samples.13,14 These authors also introduced internal DNA content standards such as nuclei of chicken- and/trout- erythocytes, as intrinsic part of the staining protocol. Their methodology designed for needle biopsy of normal and tumor tissue is now used worldwide. Figure 5 illustrates DNA content measurement of the specimen of the fine-needle aspirate of human breast cancer specimen by this method.14
The accuracy of DNA content measurement for DNA ploidy or cell cycle phase estimate is much greater when isolated nuclei rather than whole cells are analyzed. This is due to the fact that some cytoplasmic constituents may be auto-fluorescent, or contain DNA (e.g., in mitochondria) or nonspecifically stain with DNA-fluorochromes. This background cytoplasmic stainability, thus, lowers accuracy of nuclear DNA determination. Furthermore, the proteolytic step in the Vindel∅w's procedure removes some nuclear proteins that are known to restrict the accessibility of DNA to fluorochromes,15 which additionally leads to improved stoichiometry of DNA staining.15
It should be noted, however, that the lysis of plasma membrane of mitotic cells lacking nuclear envelope, that occurs in the detergent or hypotonic-treatment based methods, leads to dispersion of individual chromosomes or chromosome aggregates which are then suspended free in the solution. These methods therefore may not detect mitotic cells, particularly when the cell suspensions are mechanically agitated, pipetted or vortexed. Furthermore, individual or aggregated chromosomes may be erroneously identified as apoptotic cells with fractional DNA content (“sub-G1” cells). In addition, lysis of apoptotic cells that have fragmented nuclei releases several nuclear chromatin fragments from a single cell. Because each fragment is classified in the cytometer as individual event (“cell”) the frequency of “sub-G1” objects after cell lysis may be much higher than actual frequency of apoptotic cells in a given cell population. This generally precludes application of cell-lysis based methods for analysis of the frequency of apoptotic cells, particularly when mitotic cells are in large proportion (e.g., after arrest in the cell cycle by the mitotic poisons).16
DNA Staining in Fixed Cells
Preference for analysis of fixed cells as opposed to the detergent-permeabilized cells is dictated by the need to store or transport samples, for example clinical specimens that cannot be immediately processed. Their storage, unless done at low temperature in cryopreservative media, leads to cell deterioration (autolysis). Fixed cells on the other hand can be stored for months or even years. For analysis of DNA content precipitating fixatives (alcohols, acetone) are preferred over cross-linking agents (e.g., formaldehyde, glutaraldehyde). This is because cross-linking of chromatin constituents impairs stoichiometry of DNA staining with intercalating fluorochromes and thus decreases accuracy of DNA content measurement.15 It should be noted, however, that highly fragmented DNA such as present in apoptotic cells leaks out from the ethanol-fixed cells during their hydration and staining, but is preserved and remains within the cell upon fixation by formaldehyde. Fixation in ethanol, therefore, rather than in formaldehyde, has to be used to detect apoptotic (“sub-G1”) apoptotic cells. While absolute alcohols or acetone, or a mixture of absolute ethanol and acetone can serve as fixatives (in some instances they may be preferred e.g., for immunocytochemical detection of some antigens concurrently with DNA content) they induce more extensive cell aggregation compared e.g., with 70% or 80% ethanol, which is most commonly used when analysis is limited to DNA content alone.
A variety of DNA fluorochromes may be used to stain DNA in the fixed cells. The most commonly used are 4′,6-diamidino-2-phenylindole (DAPI), propidium iodide (PI) and 7-amino-actinomycin D (7-AAD). Staining with dyes that react with both DNA and RNA, such as PI requires incubation with RNase. The cells may be pre-incubated with RNase and subsequently stained with PI, or RNase (usually at concentration within a range between 10 and 100 μg/ml) is included into a solution containing PI in PBS. In the latter case the cells suspended in that solution are maintained for about 30 min or longer at 37°C or room temperature to allow RNase to digest RNA, before measurement by cytometry. It is of importance that the RNase used is free of DNase activity. If such is not available, one may heat the solution of RNase at 95–100°C for 5 min to destroy DNase- while still preserving RNase- activity. PI is excited in blue light, which is conveniently provided by the 488-nm line of the argon ion laser available on most flow cytometers, while DAPI requires UV or near UV excitation.
Analysis of DNA in Paraffin-Embedded Samples
The method of isolating cell nuclei from paraffin-embedded tissues was developed by Hedley and his colleagues to retrieve archival samples for flow cytometric analysis.17,18 This methodology enables for retrospective studies to determine the prognostic significance of DNA ploidy or cell cycle distribution (usually frequency of S-phase cells) in tumor progression. The method can also be applied for prospective studies when fresh material is unavailable. One advantage of this methodology is that it offers a possibility to examine by microscopy the tissue sections and thus select the adjacent tumor area of interest to be processed by flow cytometry. The paraffin blocks can then be trimmed to exclude areas of noninvolved tissue in order to diminish the proportion of stromal cells, or of necrotic and hemorrhagic areas to decrease the quantity of debris, as well as to select areas of noninvolved tissue to be used as internal DNA content standard (see further). The accuracy of DNA content analysis of nuclei from paraffin blocks is generally inferior compared to the methods that rely on either ethanol fixation or detergent or hypotonic treatment of fresh tissues. This is due to the fact that the cells embedded in paraffin frequently are usually prefixed in formaldehyde. As mentioned, by cross-linking DNA and proteins formaldehyde fixation impairs stoichiometry of DNA. Because crosslinking by formaldehyde is to some extent reversible, long incubation of the rehydrated nuclei in aqueous solutions, after their isolation from the paraffin blocks, improves resolution of DNA analysis. In nuclei isolated from paraffin blocks DAPI is the preferable fluorochrome since it the least affected, in terms of stoichiometry of DNA staining, by the chromatin structure and thus by protein-DNA crosslinking.15
Another factor that lowers accuracy of DNA content analysis and thus identification of aneuploid cells or discrimination of cells in different phases of the cycle in samples of nuclei isolated from paraffin blocks is the presence of debris. Most debris is due to the presence of transected nuclei with incomplete DNA content. Because probability of transecting a nucleus is proportional to thickness of the section and to nuclear size, preparation of thicker sections (≥50 nm) for nuclei isolation is advisable, particularly for tumors with large nuclei such as tetraploid and larger stemlines.
Concurrent Analysis of Cell Surface Antigen and DNA Content
It is often desirable to know the DNA content distribution (histogram) of the particular cell subpopulation identified by its surface immunophenotype. The most common approach, in such a case, is to perform standard immunocytochemical labeling of live cells with the fluorochrome- (most frequently FITC or Alexa Fluor 488) conjugated Ab, which is then followed by short fixing the cells in 0.5–1.0% methanol-free formaldehyde (“paraformaldehyde”) in PBS. Because formaldehyde fixation does not adequetely permeabilize the cells it is critical to subsequently have detergent (e.g., Triton X-100) in the staining solution to make DNA accessible to DNA-fluorochrome such as PI or DAPI. Post-fixation in alcohol (methanol or ethanol) following formaldehyde also permeabilizes cells. A gentle fixation with formaldehyde (0.25%) followed by permeabilization in Tween 20 detergent is another procedure designed to preserve both external and internal antigens that can be detected immunocytochemically concurrently with analysis of DNA content.19 Cellular green (FITC or Alexa Fluor 488) and red (PI) or blue (DAPI) fluorescence is then measured by flow cytometry. During analysis, the cell subpopulation of interest is gated based on its immuno-phenotype (green fluorescence) and DNA content of this selected subpopulation is then plotted in form of a frequency histogram It is also possible to to combine analysis of DNA content with both cell surface phenotype markers and telomere length.20
A simpler approach to concurrently measure DNA content and cell surface immunofluorescence is to combine the supravital staining of DNA with Hoechst 33342 with surface immunophenotyping.21 For this combination, however, the cytometer with the two- or more- lasers, including one emitting UV light is required. Furthermore, as mentioned, in some cell types it is difficult to obtain high resolution of DNA content analysis after supravital staining of DNA either with Hoechst 33342 or DRAQ5.
Accuracy of DNA Content Measurement
The accuracy of DNA content measurement is reflected by variation in fluorescence intensity between individual cells with identical DNA content, such as G0/G1 cells. This variation is being assessed by the value of coefficient of variation (CV) of the mean value of DNA content of the G0/G1 cell population. The CV of the DNA-associated mean fluorescence of G1 cells is thus considered an index of the accuracy of the DNA measurements. High accuracy is required in particular in assessing DNA ploidy to distinguish between DNA diploid and aneuploid cells, which may differ minimally in DNA content. Accurate DNA content measurement is also critical in analysis of cell cycle distributions. There is no formal consensus regarding the acceptable maximal CV value of the mean DNA content of the G0/G1 cell population i.e., the acceptable error in cellular DNA content estimate. Most researchers, however, would consider the accuracy to be poor and results unacceptable if CV values of normal, nontumor cells exceed 6%, optimal resolution is achieved when CV is <3%. An exception is analysis of the DNA content of cell nuclei isolated from paraffin blocks, where by the nature of the sample (formaldehyde fixation) good accuracy is difficult, to achieve.
A number of factors can contribute to poor accuracy in DNA content analysis. Most common is inappropriate sample flow and optical adjustment of the flow cytometer. Proper maintenance of the instrument and its careful adjustment prior to analysis, e.g., using fluorescent calibrated standard beads, to maximize the electronic signal intensity and minimize variability of the measurement of the beads, are required to achieve accurate DNA measurements. Problems in sample preparation, either resulting in mechanical damage to the cells or involving incorrect composition of buffers and staining solutions, are another reason of poor resolution in DNA analysis. An excessively large number of cells (DNA) in the sample which leads to significant depletion of the free, unbound fluorochrome in the solution and alters the staining equilibrium (see below), may be still another source of the problems that prevent accurate DNA content analysis. Adjusting samples to achieve a proper fluorochrome to DNA content (cell number) ratio improves the results.
It should be noted that despite good accuracy of DNA content measurements (in terms of proper instrument adjustments and sample staining) the CV of G1 cell populations may still remains high. This may occur when significant numbers of dead or dying cells are present in the sample, or when the cells were treated with DNA-interacting drugs. Also, in tumors that are polyclonal or have developed drug resistance by gene amplification (e.g., presence of minute chromosomes) the G0/G1cell populations may have intrinsically variable DNA content and therefore high CV values of the G0/G1cell populations.
Accessibility of DNA in Chromatin to Fluorochromes
The accessibility of DNA to fluorochromes is restricted by chromosomal proteins, predominantly by histones and varies between different cell types. The maximal restriction is seen in cells undergoing terminal differentiation such as during spermatogenesis or erythropoiesis, when DNA stainability (per unit of DNA) is significantly lower compared with other cell types.15,22 This obviously creates difficulties in assessment of DNA ploidy in such differentiating cells. The degree of reduction varies for individual fluorochromes and DAPI is the least influenced by chromatin structure whereas binding of 7-AAD, an intercalating but more bulky fluorochrome, is affected to a much larger degree. In practical terms, therefore, one may expect intercellular variation in DNA stainability when mixed cell types are measured in the same sample. This can be manifested on DNA content frequency histograms as the presence of pseudo-aneuploid populations, or widening of the G1 peak (increased CV value). For example under certain conditions of staining monocytes show higher DNA stainability with PI compared to lymphocytes or granulocytes and form a typical pseudo-hyperdiploid peak on DNA frequency histograms. As mentioned, subjecting cells to the detergent methods and in particular the combination of detergent and proteolytic treatment such as in the Vindel∅v's procedure,13,14 increases accessibility of DNA and thereby improves the stoichiometric relationship between DNA content and fluorescence intensity.
There are several ways to estimate stoichiometry of DNA staining. Thus, fluorescence intensity of the cell populations represented by the G2/M peaks on DNA histograms is expected to be DI = 2.0 as compared to DI = 1.0 for G0/1 cells and deviation from this value indicates on problems in DNA quantification.23 Normal hepatocytes grow at different DNA ploidy levels and therefore may also serve as markers of linearity in DNA measurement. Inclusion of internal standards such as chicken or trout erythrocytes provides still another marker of the stoichiometry of DNA measurement and is highly recommended when DNA ploidy is estimated.13,14 To demonstrate stoichiometry of DNA staining one has to use linear and not exponential scale for plotting intensity of DNA-associated fluorescence (x-coordinate) and include the origin (point zero) of this coordinate, on the DNA content frequency histogram.
In some instances, however, stoichiometry in DNA staining with fluorochromes cannot be attained. This can be seen when cells were treated with antitumor drugs that modify DNA and/or chromatin structure. Intercalating drugs that interact with DNA fluorochromes by fluorescence resonance energy transfer (FRET), or drugs damaging DNA structure, or crosslinking chromatin, all can alter staining properties of in situ DNA, often in unpredictable ways. As mentioned, the possibility of stoichiometric measurement of DNA content may also be hampered when cells differing markedly in chromatin structure are being compared.
Fluorochrome Binding to DNA—Mass Action Law
Staining of cellular DNA is being done at equilibrium between the ligand (fluorochrome) and the ligand-binding sites in the DNA within the cells sample and thus it follows the chemical law of mass action. Stable level of staining is achieved when there is large excess of the ligand per binding site so a small variation in cell number per sample (binding sites) has no significant effect on the equilibrium. Because it is difficult to have an identical cell number in each sample, the variation is inevitable. One can calculate however approximate concentration of the fluorochrome and relate to the cell number to find out the range within which a decrease in free ligand concentration may not significantly affect DNA stainablility. There are 3 × 10⁹ DNA base pairs per cell (diploid cell in G1). Most intercalators such DNA-binding fluorochromes, reacting with free (naked) DNA at saturation bind every second base pair. Thus, potentially, in a single diploid cell there are ~1.5 × 10⁹ binding sites. However, because a large portion of nuclear DNA within the cell is inaccessible to the intercalators,15 only a fraction of the potential binding sites (10–70%, depending on the fluorochrome) can actually bind the ligand (fluorochrome). Thus, there are between 1.5 to 10.0 × 10⁸ sites that actually bind the ligand in a single cell and therefore 1.5 to 10.0 × 10¹⁴ binding sites in 106 diploid cells, which is approximately a size of average sample subjected to staining. Assuming average MW of most DNA fluorochromes to be about 300, one can estimate (from Avogadro number) that at a concentration 100 μM (30 μg/ml) there are 6 × 10¹⁶ molecules of the ligand in 1 ml of the stain solution. Considering the above there is nearly 100-fold excess of the ligand per binding site when 106 cells are stained in 1 ml volume at 100 μM dye concentration. One would expect that under these conditions a change in cell number from 1 to 2 million (which alters a concentration of the free, unbound ligand by 1%) should not be reflected by greater than 1% change in stainability of DNA. However, at lower dye concentration (e.g., below 20 μM) or when cell number is drastically changed (e.g., from 1 to 5 million) the change in DNA stainability becomes noticeable. Needless to say, if cells have higher DNA content, (tetraploid, arrested in G2/M) the equilibrium is shifted even more towards lesser concentration of free dye, which leads to further decrease in DNA stainability. The above estimates have to taken into an account when samples with different cell number are stained to compare DNA ploidy.
Assessment of DNA Ploidy
As mentioned, DNA content measurement by cytometry serves to estimate frequency of cells in particular phases (G0/1 versus S versus G2M) of the cell cycle as well as to assess DNA ploidy. In most situations DNA ploidy is being assessed in hematological or solid tumors; the evidence of aneuploidy by itself is a definitive marker of a presence of the tumor. Often is also considered to be an prognostic indicator of tumor progression and outcome of the treatment. To assess DNA ploidy of the tumor sample one has to compare DNA content of the G0/1 cells population of the presumed tumor cells with that of normal (control) cells. Towards this end most frequently the peak value of the integrated fluorescence (peak channel) of G0/1 population of normal cells is being considered to be DI = 1.0 and DNA ploidy of the tumor cells is expressed as a ratio of the peak value (channel) of fluorescence intensity of these cells with respect to that of the normal G0/1 cells. It is also common to express DI of the tumor as a ratio of modal rather than the peak value of fluorescence intensity representing DNA content of G0/1 population tumor cells to modal value of G0/1 population of normal cells. Some authors still prefer to use the mean values of fluorescence intensity of G0/1 population rather than the peak or modal values to obtain this ratio. In essence, when DNA measurement is done correctly and accurately, either of these appropaches is expected to yield similar estimate of DI of aneuploid cells.
Normal lymphocytes, including lymphocytes from the same patient whose tumor is being analyzed, or fibroblasts, are often used as standard of DI = 1.0. For comparison with the tumor it is necessary to use normal cells both as external and internal control standards. When used as external control they have to be subjected to identical processing and staining procedure and measured by cytometry under identical laser and detector settings as tumor sample. The external control cells should be measured prior to- and also after- measurement of tumor sample. This double-measurement of control cells allows one to detect the possible shift in fluorescence readout e.g., due to misadjustment in instrument settings in the course of the sequential measurements. In addition to external control, normal cells should also be admixed (e.g., in 1:1 proportion) with the tumor sample cells and used then as internal control in another set of measurements. Often, normal stromal- or tumor infiltrating cells are already present in the tumor sample and they can be used as an internal control of DNA ploidy. In fact, when DNA ploidy is assessed based on measurement of nuclei isolated from paraffin blocks, the internal control provided by the presence of stromal and infiltrating normal cells that provide standard for DI = 1.0 is the only way to assess DNA ploidy of the tumor. This is due to the fact that DNA stainability after formaldehyde fixation and paraffin embedding is markedly altered making external standards useless.
Chicken and trout erythrocytes have been proposed as internal standards for analysis of DNA content by cytometry (Fig. 5).13,14 Their use is helpful to control and maintain consistency of the staining and measurement procedures. However, one has to be cautious using them as absolute standard for DNA content analysis. Trout, like other fish species, are known to vary in their DNA ploidy level (most species are tetraploid) and it is therefore important to know ploidy of these cells when used as a standard.
Despite the difficulties and potential pitfalls outlined in this chapter, cytometry, including flow cytometry and LSC, is the methodology of choice in analysis of DNA content for DNA ploidy assessment. This methodology is complemented by fluorescence in situ hybridization (FISH) analysis, which provides a possibility to identify individual chromosomes or chromosome components contributing to aneuploidy. It should be noted that LSC, by offering rapid and semi-automatic enumeration of the fluorescent foci within individual nucleus in addition to DNA content measurement can also be used for FISH analysis.26
Conclusion
As outlined in this chapter variety of methods are available to estimate cellular DNA content by flow- or image assisted- cytometry. They offer wide choice of analytical capabilities to assess DNA ploidy and cell cycle distributions. The possibility of use of diverse fluorochromes differing in absorption and emission properties as well as in mode of binding to DNA provide the means to optimize DNA content measurement for different cell types. The principles of DNA staining and data analysis described in this chapter will be of assistance for the beginners who initiate DNA content analysis by cytometry. It may also provide useful information for advanced researchers who contemplate change in the methodology to further improve accuracy in assessment of DNA ploidy and cell cycle distribution.
Acknowledgement
Supported by NCI RO1 CA 28 704.
References
- 1.Nagata S, Nagase H, Kawane K, et al. Degradation of chromosomal DNA during apoptosis. Cell Death Differ. 2003;10:108–16. doi: 10.1038/sj.cdd.4401161. [DOI] [PubMed] [Google Scholar]
- 2.Gong J, Traganos F, Darzynkiewicz Z. A selective procedure for DNA extraction from apoptotic cells applicable for gel electrophoresis and flow cytometry. Anal Biochem. 1994;218:314–19. doi: 10.1006/abio.1994.1184. [DOI] [PubMed] [Google Scholar]
- 3.Kajstura M, Halicka HD, Pryjma J, et al. Discontinuous fragmentation of nuclear DNA during apoptosis revealed by discrete “sub-G1” peaks on DNA content histograms. Cytometry A. 2007;71A:125–31. doi: 10.1002/cyto.a.20357. [DOI] [PubMed] [Google Scholar]
- 4.Darzynkiewicz Z, Crissman HA, Jacobberger JW. Cytometry of the cell cycle. Cycling through history. Cytometry. 2004;58A:21–32. doi: 10.1002/cyto.a.20003. [DOI] [PubMed] [Google Scholar]
- 5.Darzynkiewicz Z, Juan G, Li X, et al. Cytometry in cell necrobiology. Analysis of apoptosis and accidental cell death (necrosis) Cytometry. 1997;27:1–20. [PubMed] [Google Scholar]
- 6.Bagwell BC. Theoretical aspects of flow cytometry data analysis. In: Bauer KE, Duque RE, Shankey TV, editors. Clinical Flow Cytometry: Principles and Applications. Williams & Wilkins; Baltimore: 1993. pp. 41–61. [Google Scholar]
- 7.Rabinovitch PS. Practical considerations for DNA content and cell cycle analysis. In: Bauer KE, Duque RE, Shankey TV, editors. Clinical Flow Cytometry: Principles and Applications. Williams & Wilkins; Baltimore: 1993. pp. 117–142. [Google Scholar]
- 8.Crissman HA, Hofland MH, Stevenson AP, et al. Supravital cell staining with Hoechst 33342 and DiOC5(3) Method Cell Biol. 1990;33:89–95. doi: 10.1016/s0091-679x(08)60514-2. [DOI] [PubMed] [Google Scholar]
- 9.Krishan A. Effect of drug efflux blockers on vital staining of cellular DNA with Hoechst 33342. Cytometry. 1987;8:642–5. doi: 10.1002/cyto.990080618. [DOI] [PubMed] [Google Scholar]
- 10.Martin RM, Leonhardt H, Cardoso MC. DNA labeling in live cells. Cytometry. 2005;67:45–52. doi: 10.1002/cyto.a.20172. [DOI] [PubMed] [Google Scholar]
- 11.Darzynkiewicz Z, Traganos F, Sharpless T, et al. Lymphocyte stimulation: A rapid multiparameter analysis. Proc Natl Acad Sci USA. 1976;73:2881–4. doi: 10.1073/pnas.73.8.2881. [DOI] [PMC free article] [PubMed] [Google Scholar]
- 12.Krishan A. Rapid DNA content analysis by the propidium iodide-hypotonic citrate method. Methods Cell Biol. 1990;30:121–5. [PubMed] [Google Scholar]
- 13.Vindel∅v LL, Christensen IJ, Nissen NI. A detergent-trypsin method for the preparation of nuclei for flow cytometric DNA analysis. Cytometry. 1983;3:323–7. doi: 10.1002/cyto.990030503. [DOI] [PubMed] [Google Scholar]
- 14.Vindel∅v LL, Christiansen IJ. Detergent and proteolytic enzyme-based techniques for nuclear isolation and DNA content analysis. Meth Cell Biol. 1994;41:219–230. doi: 10.1016/s0091-679x(08)61720-3. [DOI] [PubMed] [Google Scholar]
- 15.Darzynkiewicz Z, Traganos F, Kapuscinski J, et al. Accessibility of DNA in situ to various fluorochromes: Relationship to chromatin changes during erythroid differentiation of Friend leukemia cells. Cytometry. 1984;5:355–63. doi: 10.1002/cyto.990050411. [DOI] [PubMed] [Google Scholar]
- 16.Darzynkiewicz Z, Bedner E, Traganos F. Difficulties and pitfalls in analysis of apoptosis. Methods Cell Biol. 2001;63:527–46. doi: 10.1016/s0091-679x(01)63028-0. [DOI] [PubMed] [Google Scholar]
- 17.Hedley DW, Friedlander MI, Taylor IW, et al. Method for analysis of cellular DNA content of paraffin-embedded pathological material using flow cytometry. J Histochem Cytochem. 1983;31:1333–5. doi: 10.1177/31.11.6619538. [DOI] [PubMed] [Google Scholar]
- 18.Heiden T, Wang N, Tribukait B. An improved Hedley method for preparation of paraffin-embedded tissues for flow cytometric analysis of ploidy and S-phase. Cytometry. 1991;12:614–21. doi: 10.1002/cyto.990120705. [DOI] [PubMed] [Google Scholar]
- 19.Schmid I, Uittenbogaart CH, Giorgi JV. A gentle fixation and permeabilization method for combined cell surface and intracellular staining with improved precision in DNA quantification. Cytometry. 1991;12:279–85. doi: 10.1002/cyto.990120312. [DOI] [PubMed] [Google Scholar]
- 20.Schmid I, Dagarag MD, Hausner MA, et al. Simultaneous flow cytometric analysis of two cell surface markers, telomere length and DNA content. Cytometry. 2002;49:96–105. doi: 10.1002/cyto.10163. [DOI] [PubMed] [Google Scholar]
- 21.Loken MM. Simultaneous quantitation of Hoechst 33342 and immunofluorescence on viable ells using a fluorescence activated cell sorter. Cytometry. 1980;1:136–42. doi: 10.1002/cyto.990010208. [DOI] [PubMed] [Google Scholar]
- 22.Evenson D, Darzynkiewicz Z, Jest L, et al. Changes in accessibility of DNA in situ to various fluorochromes during spermatogenesis. Cytometry. 1986;7:45–53. doi: 10.1002/cyto.990070107. [DOI] [PubMed] [Google Scholar]
- 23.Crissman HA, Steinkamp JA. Cytochemical techniques for multivariate analysis of DNA and other cell constituents. In: Melamed MR, Lindmo T, Mendelsohn ML, editors. Flow Cytometry and Sorting. Wiley-Liss; New York: 1992. pp. 227–47. [Google Scholar]
- 24.Kamentsky LA. Laser scanning cytometry. Methods Cell Biol. 2001;63:51–87. doi: 10.1016/s0091-679x(01)63007-3. [DOI] [PubMed] [Google Scholar]
- 25.Darzynkiewicz Z, Bedner E, Gorczyca W, et al. Laser scanning cytometry. A new instrumentation with many applications. Exp Cell Res. 1999;249:1–12. doi: 10.1006/excr.1999.4477. [DOI] [PubMed] [Google Scholar]
- 26.Kamentsky LA, Kamentsky LD, Fletcher JA, et al. Methods for automatic multiparameter analysis of fluorescence in situ hybridized specimens with laser scanning cytometer. Cytometry. 1997;27:117–25. doi: 10.1002/(sici)1097-0320(19970201)27:2<117::aid-cyto3>3.0.co;2-d. [DOI] [PubMed] [Google Scholar]