Abstract
The control of biofilm formation is a challenging goal that has not been reached yet in many aspects. One unsolved question is the role of van der Waals forces and another is the importance of mutual interactions between the adsorbing and the adsorbed biomolecules (“critical crowding”). In this study, a combined experimental and theoretical approach is presented, which fundamentally probes both aspects. On three model proteins—lysozyme, α-amylase, and bovine serum albumin—the adsorption kinetics is studied experimentally. Composite substrates are used enabling a separation of the short- and the long-range forces. Although usually neglected, experimental evidence is given for the influence of van der Waals forces on the protein adsorption as revealed by in situ ellipsometry. The three proteins were chosen for their different conformational stabilities in order to investigate the influence of conformational changes on the adsorption kinetics. Monte Carlo simulations are used to develop a model for these experimental results by assuming an internal degree of freedom to represent conformational changes. The simulations also provide data on the distribution of adsorption sites. By in situ atomic force microscopy we can also test this distribution experimentally, which opens the possibility to, e.g., investigate the interactions between adsorbed proteins.
INTRODUCTION
Proteins are found to be involved in interactions with solid surfaces in numerous processes. Due to protein adsorption and subsequent bacterial adherence, biofilms are formed at interfaces between solid substrates and liquids containing biomacromolecules. Biofilm formation, as well as protein adsorption, is a molecular assembly process occurring at interfaces.1 Moreover, these processes are collective phenomena since surface coverage, adsorption kinetics, conformational arrangement, etc., are depending on the nature of the molecular neighborhood. The lack of effective control over this process has become a bottleneck impeding the development of many biotechnologies, examples including biosensors, enzyme immobilization in biocatalysis, antibody attachment in immunoassays, biomaterial development, and tissue engineering. During the past decades, substantial progress has been made in understanding some mechanisms of protein adsorption.2, 3, 4, 5, 6 Adsorption is the net result of various types of interactions, which depend on the nature of the protein and of the substrate, as well as on the surrounding aqueous solution. Several driving forces have been identified for the protein adsorption process, including dehydration of the protein and the substrate surface, redistribution of charged groups in the interfacial film, and structural rearrangements in the biomolecules. Regarding the role of substrate characteristics, both surface topography and surface chemistry have been shown to affect protein adsorption, bacteria, and cell adhesion.2, 7 However, since most topographical variations are accompanied by chemical heterogeneities, separating both effects is difficult. Furthermore a differentiation between the impacts of short- and long-range forces has recently been probed,8, 9 which can be considered as one step toward gaining control of biofilm formation. It is the aim of this paper to compile the results in order to stress that the subsurface composition is a parameter of utmost importance.
Experimental characterization of protein adsorption
The separation of short- and long-range interactions is possible using composite samples: By variation of the silicon oxide thickness on top of Si wafers, the van der Waals interactions can be tuned,10, 11, 12, 13 as described in Sec. 2. The adsorption kinetics of bovine serum albumin (BSA) and α-amylase are sensitive to these variations of the long-range potential. Note that the van der Waals interactions depend on the geometry of the interacting objects:14 For two atoms, the van der Waals potential decreases like 1∕r6, where r denotes the distance. However, for a spherical particle interacting with a planar surface, the decrease of the potential is much slower, i.e., 1∕r. Hence, the strength of the van der Waals interactions cannot be neglected.
Studies concentrating on the kinetic behavior during adsorption, desorption, and exchange processes revealed that there is a certain hierarchy or intermolecular arrangement of proteins in the adsorption layers (e.g., Ref. 15). Additionally, reconfiguration or reorientation of the adsorbed protein can take place.16, 17 However, further information is needed to describe the structure of the adsorption layer in detail. A manifold of proteins have actually been detected to undergo conformational changes or reorientations when adsorbed on a variety of hydrophilic, hydrophobic, charged, and uncharged surfaces (e.g., Refs. 6, 17, 18, 19). These conformational changes and reorientations were interpreted to be a result of mutual interactions between the adsorbed protein molecules (“critical crowding”), as well as interactions between proteins and surfaces. Hence, monitoring the conformational changes in an adsorbed protein as a function of the adsorption amount and time should be useful for obtaining information about the intermolecular interactions in the adsorption layer.
The direct detection of conformational changes is a challenging task. Most methods are restricted to indirect observations. Monitoring the adsorption kinetics, a different kinetic behavior is found for the “rigid” lysozyme20 as compared to the adsorption kinetics of α-amylase and BSA.8, 9 BSA is well-known as a “soft” protein.20, 21, 22, 23 This difference in the adsorption kinetics is therefore ascribed to dissimilar tendencies to undergo conformational changes due to adsorption. Monte Carlo simulations including an internal degree of freedom to incorporate conformational changes qualitatively reproduce the experimental findings (see Sec. 5B).
Most methods, such as ellipsometry or scattering techniques, provide information obtained by averaging over some μm2. Therefore, these methods cannot provide explicit information about single proteins involved in the adsorption process. A technique that overcomes some of these shortcomings is atomic force microscopy (AFM). By in situ AFM in aqueous environment, the spatial distribution of individual adsorbed proteins can be determined in their natural environment (see Sec. 3B). This method can therefore give new insights into the evolution of protein films. The surface mobility of the single proteins can be tested as well as their tendency to form clusters or to adsorb rather independent from each other, as described in the scenario of random sequential adsorption (RSA), which is presented later in this c.f. Sec. 5C .
Theoretical modeling of biofilm adsorption
The numerical investigation of biofilm adsorption is a challenging task since the number of degrees of freedom is huge if the detailed structure of the proteins is taken into account. In addition to this, proteins undergo structural changes at the surfaces, which imply that the relaxation time for the adsorption of a single protein at the surface is out of scope for present simulation approaches. Therefore, a drastic reduction of the number of degrees of freedom is mandatory in order to simulate the adsorption of a protein film. In this section, we will briefly discuss the potentials and limitations of different numerical approaches to protein dynamics.
The most fundamental methods are based on explicit quantum mechanical calculations. Incorporating the distribution of electrons, they are able to predict the forming of atomic bonds, which is indispensable for studying chemical reactions of proteins (see Ref. 24 for an overview). Ab initio methods approximately solve Schrödinger’s equation. Being able to provide very accurate results, the calculations are very time-consuming. To date, only a two-digit number of atoms can be simulated using this ab initio approach.25, 26 Therefore, procedures have been developed27, 28, 29, 30, 31 simplifying the unessential parts of the system using a semi-empirical approach while describing the important parts using quantum mechanical methods.27, 28, 29, 30, 31 In these cases, the solvent is partly implicit.
Much larger systems can be considered by using fragment methods. Retaining the accuracy,32 these divide the whole system into several subunits which can be processed individually enabling the use of parallel computers.33, 34, 35, 36, 37, 38, 39, 40, 41 Yet, due to the limitation of the system size and time scale, they cannot be used to study protein adsorption involving conformational changes.
To overcome these limitations, quantum effects are often neglected. This is also the case for so-called full atomistic molecular dynamics simulations, where atoms are the smallest building blocks. Using these classical approaches, the simulation of peptides and small proteins becomes feasible. This includes forecasts of structural changes of single proteins and forecasts of possible transition paths between two states.42, 43 It also includes the simulation of simple changes of conformation (involving, e.g., only loop motions) and takes place on a nanosecond time scale. However, large changes—involving the rearrangement of entire domains—typically occur on the microsecond to millisecond time scale44 and are still not accessible using an atomistic level of detail and are requiring other methods:
The time evolution of a system can be obtained via molecular dynamics (MD), Brownian dynamics, or local Monte Carlo (MC) simulations, but the latter two have a limited ability of simulating the solvent, as they can only do it implicitly. Often this is done in MD, too, as means of speeding up a simulation, retaining the atomistic precision of the protein model. Whether or not this is reasonable for the simulation of protein folding or adsorption is an open question.45, 46, 47, 48
Further simplification is achieved by combining multiple atoms to a single pseudoatom. This coarse-grained system needs to be described using modified force fields or interaction energies, respectively.49 For a fixed system size, the accessible time scales are two to three orders of magnitude higher than for a full all-atom description50 so that, in principle, they allow the simulation of large proteins. So far, however, the currently available generic force fields do not support structural changes in the tertiary structure.50 Therefore, reliable simulations can be obtained only if the structure of the protein is maintained. An overview of those so-called united atom or coarse-graining methods is given in Refs. 51, 52.
Classical MD methods are based on the integration of Newton’s equations. The numerical effort is very high, typical time scales are from 10 ns (Ref. 53) up to some 10 μs,45, 48 depending on the system size, the hardware being used, and the accuracy (ex- or implicit water) of the calculations. The range of applications for full atomistic, as well as coarse-grained MD simulations, indicates that these approaches cannot be used in order to simulate the adsorption of a full biofilm.
Monte Carlo simulations provide a complementary approach: Instead of integrating the classic equations of motion, one performs a stochastic motion in the configuration space. At first sight, this method appears not to be appropriate since no direct information about the particle’s dynamics is available. The comparison of local MC and MD methods for complex fluids has shown, however, that both methods lead to similar results: While naturally, the short-time kinetics is different, the long-time kinetics is insensitive to the microscopic dynamics.54 Yet, today’s researchers tend to prefer the usage of MD simulations as a workhorse when generating the time evolution at atomistic level.
In order to establish the equilibrium states of complex molecules, the transition path sampling method has been applied also.42, 55, 56 The basic idea of this method is to sample transition paths between two configurations of the many-particle system by molecular dynamics or Monte Carlo methods. Unfortunately, for this method, the initial and the final states have to be known beforehand and have to be established by complementary methods.5, 57
Coarsening the system under consideration even more, colloidal length scales of a few nanometers are reached. This results in a substantial increase of both spatial and temporal time scales, the latter up to the order of seconds to hours, depending on the level of complexity. In this context, the solvent is only implicitly taken into account and proteins are typically modeled as particles of high symmetry, e.g., spheres or ellipsoids, allowing many thousands of proteins to be considered. The downside is the neglect of all their structural details including the distribution of charges and other details of the interactions, which are relevant for very short distances. This is, however, a necessary compromise in order to reach time scales that are experimentally relevant for the adsorption of a protein-biofilm.
A simple but very efficient approach to characterize protein adsorption is the so-called random sequential adsorption (RSA) model, which typically is a 2D model describing the parking problem omitting the particle’s trajectory to the surface. A lot of variations of this simulation method exist,58, 59, 60, 61, 62, 63, 64, 65, 66 yet, the comparison to experiments is limited, as only a small number of experimental parameters are realizable and the particle’s trajectory to the surface is not accounted for.
MATERIALS
The proteins α-amylase (Product No. 10092), lysozyme (Product No. 62971), and bovine serum albumin (Product No. A3059) were purchased from Sigma Aldrich, Steinheim, Germany. BSA (66 kDa) (Ref. 67) and α-amylase (58 kDa) (Ref. 68) have about the same size but different isoelectric points (pI) at pH 4.7 (Ref. 69) and pH 6.5 (Ref. 68), respectively. For BSA, the ability of showing different conformations at different pH values is well-known.20, 21, 22, 23 Lysozyme has a mass70 of 14 kDa and its isoelectric point71 is at pH 11.
As substrates for ellipsometry measurements, silicon wafers with different silicon dioxide thicknesses were used: native (2 nm, Wacker Siltronic AG, Burghausen, Germany) and thermally grown (192 nm, Silchem, Freiberg, Germany) dioxide layers, denoted as thin and thick oxide layers in the following. Before usage, the wafers must be cleaned to remove residues from the polishing procedure (mostly hydrocarbons). Therefore, the wafers were immersed into fresh 1:1 H2SO4(conc.)∕H2O2(30%) solution for 30 min. Then, the acids were removed by three times rinsing the wafers in hot ultrapure water (Millipore, Billerica, MA, USA), 20 min each. All samples were prepared in a clean room environment (class 100), resulting in a water contact angle of 0° directly after cleaning. Upon usage, the silicon wafers showed advancing water contact angles of less than 10° (see Table 1 for details) and are therefore termed “hydrophilic.” To gain a second set of wafers with a “hydrophobic” surface (Θ>90°), a self-assembled monolayer (SAM) of silane molecules with a CH3 tailgroup [octadecyl-trichlorosilane (OTS), Sigma Aldrich, Germany] was applied to the wafers following standard procedures.72, 73 The water contact angles on hydrophobized wafers were larger than 110° (Table 1) with a hysteresis smaller than 5°. (The contact angle hysteresis describes the difference between advancing Θa and receding Θr contact angles.) By additionally measuring the contact angles for glycerol and 1-bromonathalene, the surface energies as well as the Lifshitz–van der Waals and the Lewis acid-base components can be determined,74 as listed in Table 2.
Table 1.
Silicon wafer characterization results.
| d (SiO) (nm) | Hydro- | rms (nm) | (deg) | (deg) | (deg) | |
|---|---|---|---|---|---|---|
| 2.0(1) | philic | 0.09(2) | 5(2) | Complete wetting | 11(3) | 13(4) |
| 192(1) | philic | 0.13(3) | 7(2) | Complete wetting | 17(3) | 15(3) |
| 2.0(1) | phobic | 0.12(2) | 111(1) | 107(1)° | 95(2) | 62(4) |
| 192(1) | phobic | 0.15(2) | 112(1) | 108(2)° | 92(2) | 63(3) |
Table 2.
Surface energy γ and their Lifshitz–van der Waals γLW and Lewis acid-base γAB components of the substrates, as determined by contact angle measurements, the results of which are listed in Table 1.
| d (SiO) (nm) | Hydro- | γ (mJ∕m2) | γLW (mJ∕m2) | γAB (mJ∕m2) |
|---|---|---|---|---|
| 2.0(1) | philic | 64.2 | 43.5 | 20.7 |
| 192(1) | philic | 63.2 | 43.1 | 20.1 |
| 2.0(1) | phobic | 24.1 | 24.1 | 0.0 |
| 192(1) | phobic | 23.6 | 23.6 | 0.0 |
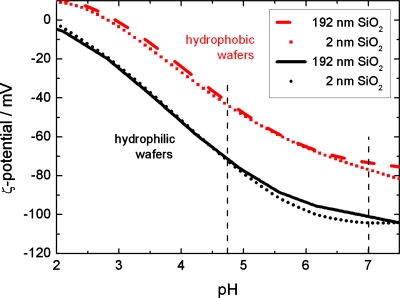
Zeta-(ζ)-potential measurements75 on wafers with thin and thick oxide layers—with and without the OTS monolayer—were performed for pH values ranging from 2.0 to 7.5, see Fig. 1. Obviously, the hydrophilic surfaces carry a higher negative charge than the hydrophobic wafers. The oxide layer thickness, however, does not play any role and zeta potential values are identical within the experimental error.
Figure 1.
ζ-potential of hydrophobic and hydrophilic silicon wafers with thin and thick oxide thickness as functions of pH. For the ζ-potential, differences in oxide layer thickness are irrelevant. Note that adsorption experiments in this study have been performed at pH 7.0 and 4.75 (vertical dashed lines) (in cooperation with Zimmermann, TU Dresden).
The thicknesses of the silicon oxide and OTS layer were determined by ellipsometry, revealing an oxide thickness of 2 nm for the thin and 192 nm for the thick oxide layers. The thickness of the OTS-SAM is found to be 2.6 nm. The surface roughnesses of the four wafer types were determined by AFM. The measured root mean square (rms) roughness of an (1 μm)2 scan area was below 0.2 nm for all wafer types (see Table 1 for details).
Keeping all other parameters (pH, ionic strength, temperature, and protein concentration) constant, the four wafer types allow for the separation of effects due to the long- and short-range parts of the surface potential:10, 11, 12, 13 Hydrophobization by the OTS-SAM alters the short-range part as can be seen in the contact angle and the ζ-potential. For a substantial alteration of the long-ranged van der Waals potential, the OTS-SAM is too thin. The variation of the oxide layer thickness, however, does not have an influence on the short-range potential since the surface chemistry is identical. Hence, contact angle as well as ζ-potential measurements deliver identical results on thin or thick oxide layers. Vice versa, choosing different subsurface wafer compositions (in our case thin and thick oxide layers) enables an independent variation of the long-range part, i.e., the van der Waals interaction to probe its influence on the formation of protein films.
The above described four types of Si wafers were used for probing protein film formation by ellipsometry. For the in situ AFM experiments, mica was chosen as a substrate. When freshly cleaved, mica exhibits an atomically smooth hydrophilic surface. Therefore, mica is frequently used for protein adsorption studies by AFM.76, 77, 78, 79, 80, 81
EXPERIMENTS
Adsorption studies by ellipsometry
Ellipsometry was used to determine the adsorbed amount of proteins by in situ monitoring the adsorption process. The multiwavelength laser ellipsometer (EP3, Nanofilm, Göttingen, Germany) was operated in polarizator-compensator-sample-analyzer configuration at a wavelength of 532 nm. The ellipsometric angles Ψ and Δ were recorded via the nulling ellipsometry principle82 with a sampling rate of 1.5–6∕min. This rate was sufficient to monitor the formation of protein layers in situ.
To determine the physical properties of the reflecting surface from Ψ and Δ, a model has to be applied.83 For single wavelength measurements, one has to assume the layers to have a constant height in order to be able to determine the refractive index and thickness of all layers. For layers with a thickness below 5 nm, it is not possible to distinguish between a change in refractive index and in film thickness.82 Therefore, de Feijter’s method84 is applied to determine the adsorbed amount Γ as a function of the refractive index nf of the protein film with a fixed film thickness df,
| (1) |
where na denotes the refractive index of the ambient and dn∕dc is the increment of the refractive index of the solution due to the increase of molecule concentration. The refractive index n(c) is assumed to be a linear function84, 85 with a fixed gradient of 0.183 cm3∕g.84, 85
The measurements were carried out in a temperature controlled closed fluid cell made of Teflon. A connection to a flow system enables a continuous exchange of fluid with constant flow rates and the injection of protein solution via a sample injector (rheodyne manual sample injector, IDEX Corporation, Northbrook, USA).
The proteins were dissolved in a 10 mM phosphate buffer solution (pH 7.0 and ionic strength of 20 mM). The fluid system was filled with the same buffer and the buffer was run through the fluid cell at a constant flow rate. After reaching a thermal equilibrium (either at 37 °C or at room temperature) associated with a constant baseline, the adsorption measurement was started by injecting the protein.
In situ AFM imaging
AFM was used to image the surface topography of the substrate as well as the adsorbed proteins in situ. For the first experiments, mica was used as substrate due to its simple handling and its smooth surface. The measurements were performed in noncontact mode to minimize the influence of the scanning tip on the proteins. A triangular cantilever (OTR 8 or SNL, Veeco, Santa Barbara) was oscillated at a frequency of about 9 kHz. The scanning rate was between 0.5 and 1.5 scan lines∕s depending on the scanning size [ranging from (0.5 μm)2 to (3 μm)2]. The lateral resolution of the scans was either 256 or 512 pixels per line. The measurements were carried out in a closed fluid cell (model MTFML, TappingMode™ Fluid Cell, Veeco, Santa Barbara) using a MultiMode (Nanoscope III, Veeco, Santa Barbara). The cell was connected to a flow system (same setup as in ellipsometry measurements) to allow for the exchange of buffer and protein solution. Experiments were performed at room temperature.
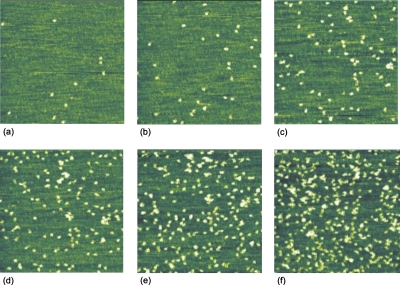
The mica was mounted in the fluid cell directly after cleavage and consequently exposed to acetate buffer of pH 4.75 at a concentration of 10 mM and ionic strength of 8 mM. A control scan of the mica surface was taken before exposing the surface to protein solution. At intervals of 5–10 min, the flow was stopped and topographic scans of the surface were taken (see Fig. 11). By in situ scanning, we avoid artifacts arising from the use of linker molecules, such as glutaraldehyde, which typically lead to networklike structures [Fig. 10c] or drying. Both procedures are frequently used in most AFM studies on protein adsorption to enable scanning in air.9, 78, 80, 81, 86 Possible scan damage was checked by repeated scanning of the identical site at lower magnification and scanning parameters were chosen very carefully to avoid scan artifacts.87, 88, 89, 90 Under the experimental conditions mentioned above (pH, ionic strength, and noncontact mode scanning), no influence of scanning on the distribution of the adsorbed proteins was observed. However, increasing the ionic strength of the solution leads to significant disturbance of the protein pattern upon scanning.
Figure 11.
Series of consecutive AFM images (1 μm×1 μm) of BSA (20 μl of 0.1 mM protein solution in acetate buffer of pH 4.75 and ionic strength I=8 mM at room temperature) adsorbed onto mica taken at the same area (slight drift) under stopped flow conditions. The bright objects represent single proteins.
Figure 10.
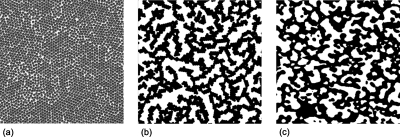
The effect of linker molecules for a stabilization of a protein film: (a) Initial configuration in the MC simulations using the standard form of interactions. (b) Stationary configuration in the computer simulation after adding a short-ranged contribution to the particle-particle interactions to mimic the effect of a linker. (c) AFM image of an amylase film stabilized by glutaraldehyde. For a simple comparison with the simulations, a threshold has been applied to the height scale such that protein is black and substrate is white.
SIMULATIONS
Using local Monte Carlo simulations, it is easily possible to include internal degrees of freedom into the model. We use such an internal degree of freedom to model a reversible change of conformation of a protein from a compact to an expanded state on adsorption to the surface, as shown in Fig. 2. The expanded state optimizes the surface interaction at the expense of the particle∕particle interaction whereas the compact state minimizes the covered surface.
Figure 2.
Schematics of a conformational change from a compact to an expanded state and vice versa using probabilities given by the Metropolis algorithm. In the expanded state, the particle has the shape of the ellipsoid with long axes of the length Y2a and a short axis with a length of Y*2a=2a∕Y2.
The thermodynamic process of adsorption is governed by an interplay of short- and long-range interactions, as described in the Derjaguin–Landau–Verwey–Overbeek (DLVO) theory.91, 92 The DLVO theory considers van der Waals and Coulomb contributions (long range) as well as steric interactions (short range). Within this framework, the potential energy Upp of two particles with radii R1 and R2 and a distance h between their surfaces can be written as
Here, , γj=tanh(Ψp(Rj)∕4), and ; all other parameters can be found in Table 3.
Table 3.
Model parameters.
| Parameter | Symbol | Default value |
|---|---|---|
| Compact particle radius | a | 5 nm |
| Temperature | T | 360.15 K |
| System parameters (lengths are normalized to a) | ||
| Simulation volume | Lx, Ly | 80 |
| Lz,1, Lz,2 | 10 | |
| Mean translation step size | δ | 0.1 |
| Cutoff distance | rC | 5 |
| Chemical potential | μ | −91.5 |
| de Broglie wavelength | λ | 4.43×10⁻¹³ |
| Interaction parameters | ||
| Hamaker constants | App | 4.66 |
| Aps | 2.33 | |
| −3.50 | ||
| Thickness of oxide layer | H | 1.0 |
| Particle charge | σp | 14 |
| Surface potential | Ψs | −3.734 |
| Inverse Debye length | κa | 1.59 |
| Relative permittivity | ϵ | 80.0 |
| Exponent of steric repulsion | g | 6 |
| Internal degree of freedom | ||
| Scaling of long axes of ellipsoid | Y | 1.5 |
| Scaling of short axis of ellipsoid | Y* | 1∕Y2 |
| Selection probability for conformational change | P | 10−2 |
| Maximum distance to surface | z* | 1.1 |
| Surface potential | 0.212 | |
To obtain the radius-dependent surface potential Ψp of a sphere with radius Rj from a given charge σp, the following implicit equation has to be solved:
where
and
The potential energy of a particle with radius R near a silicon wafer with oxide layer is derived from the formulas for two particles as
The conformational change between normal and expanded states of the particle is modeled as a change of geometry, entering in the equations only via the different radii of the particle states. The change from normal to expanded state is anisotropic, giving rise to two different radii for the interactions. Due to the oblate geometry, the effective radius for the interaction with the surface is increased by a factor Y, whereas for neighboring particles, the radius for the interaction is decreased to a∕Y2=aY* (cf. Fig. 2). Since the change of conformation does not change the volume of the particle, Y* depends on Y. Therefore, Y can be regarded as the degree of deformation of an expanded particle with Y=1 obviously denoting no deformation.
The parameters (cf. Table 3) are chosen in accordance with experimentally known parameters to mimic amylase adsorbing to silicon wafers. However, due to the simplicity of the protein model, many results are at least on a qualitative level also valid for other types of proteins.
The acceptance probability of a newly proposed state is given by the Metropolis algorithm,
where ΔE is given as an energy difference between the newly proposed state and the old state. Using this probability ensures the convergence to the equilibrium.
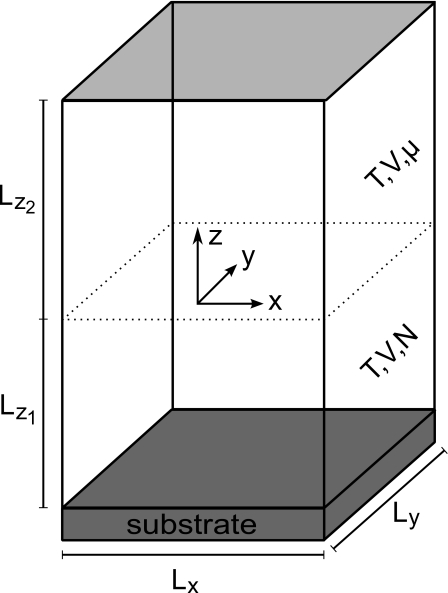
The size of the simulation box is small compared to the volume of the experimental fluid cell. Applying a canonical ensemble for the whole simulation box, the drift of the protein concentration in the solvent would be largely overestimated. Therefore it was necessary to use two subvolumes (cf. Fig. 3) with height Lz,1 and Lz,2. The upper part mimics an infinite reservoir of particles using a grand canonical ensemble with chemical potential μ, whereas the lower part being in contact with the surface had to be simulated using a constant number of particles, which was only changed by particles entering or leaving the box by means of diffusion.
Figure 3.
Simulation box.
RESULTS AND DISCUSSION
Adsorption kinetics
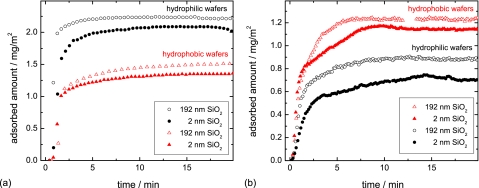
The adsorption kinetics of lysozyme and α-amylase are shown in Fig. 4. They display a typical feature of adsorption kinetics: After a fast initial adsorption, the adsorption rate decreases until a plateau value of the adsorbed amount is reached. This final adsorbed amount depends mostly on the chemistry of the surface.
Figure 4.
Adsorption kinetics of (a) lysozyme and (b) amylase on the four different types of surfaces. Experiments are carried out in a 10 mM phosphate buffer of pH 7 at 37 °C.
The adsorbed amount of lysozyme is higher on hydrophilic samples than on hydrophobic ones. This can be explained by considering the positive net charge70 of lysozyme (+8e) at pH 7 as well as the negative charge of the silicon wafers. The hydrophilic wafers (−103 mV) carry a higher negative charge than the hydrophobic ones (−75 mV), see Fig. 1. Thus, a stronger attractive Coulomb interaction promotes the adsorption of lysozyme on hydrophilic wafers.
In the case of α-amylase, the adsorbed amount is higher on hydrophobic wafers than on hydrophilic ones due to the hydrophobic effect:93 The higher attraction toward the surface originates from minimizing the contact of water with hydrophobic side groups of the protein and with the hydrophobic surface. As the pH of the solution is close to the isoelectric point of α-amylase (pI 6.9), the protein carries no net charge. Therefore, the Coulomb interaction just plays a minor role for adsorption affinity.
Comparing the results of different experimental series, however, the final adsorbed amount varies due to slightly different experimental conditions by about 0.1 mg∕m2. Therefore, no systematics can be deduced by comparing the final adsorbed amount on thin and thick silicon oxide wafers, yet the shape of the curve is reproduced.
Focusing on the curve shape of all kinetics of Fig. 4, the data for amylase on Si wafers with thin SiO2 [Fig. 4b, solid black circles and solid red triangles] deviate from the others as they exhibit a clear linear regime with a constant adsorption rate.8, 9 In the following, we call this shape “non-Langmuir-like,” in contrast to the curves with a monotonically decreasing adsorption rate, which we term “Langmuir-like” (disregarding possible deviations from a simple Langmuir model3). For lysozyme, Fig. 4a, the initial adsorption is too fast to allow for an observation of a possible linear regime with the present experimental setup.
Our hypothesis for the interpretation of the different curve shapes (Langmuir- and non-Langmuir-like) is that proteins with the ability to undergo major conformational (or geometrical) changes are able to react stronger if subject to different surface potentials as compared to rigid proteins. Changes of conformation due to adsorption are frequently described in literature.20 As compared to the small and compact lysozyme, α-amylase can be described as a soft protein.3 Therefore, major conformational changes are more likely for α-amylase than for lysozyme.
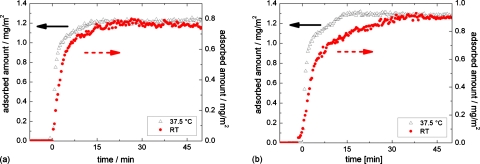
To test the hypothesis described above, we used BSA as the third protein in this study, for its well-known ability to change conformation,20, 21, 22, 23 e.g., due to changes of the pH of the surrounding solution. As shown in Fig. 5, BSA exhibits two different kinds of adsorption kinetics depending on the thickness of the silicon oxide layer: Langmuir-like adsorption on thick oxide layer and non-Langmuir-like on thin oxide layer,9 a similar tendency as recorded for α-amylase. When decreasing the temperature from physiological 37 °C to room temperature, the regime of constant adsorption rate is elongated. The initial adsorption, however, is only slightly slowed down. Although BSA carries a negative net charge at pH 7 (in contrast to α-amylase), it displays the same two types of adsorption kinetics as α-amylase. Repeating the experiments with acetate buffer at the pI of BSA (pH 4.75) reveals the same results (not shown here). Therefore, this effect cannot be explained by charge effects and Coulomb interactions. The appearance of a linear regime must rather depend on the variation of the long-range part of the interaction potential, i.e., the van der Waals interaction as well as the conformational stability of the protein.
Figure 5.
BSA adsorption kinetics on hydrophobized silicon wafers with (a) thick and (b) thin silicon oxide layers. Measurements at room temperature and 37.5 °C are shown. A non-Langmuir-like adsorption kinetics can only be observed on wafers with thin oxide layers and the intermediate linear regime is elongated at room temperature.
At this point it has to be stressed that numerous experimental studies focusing on thin film formation or dynamics usually do not give details on the subsurface composition of the samples in the study. The subsurface composition therefore is one to date mostly uncontrolled sample property. It is very likely that many diverse results about biofilm formation of different groups worldwide may be traced back to using different composite samples (still exhibiting the identical surface chemistry). We therefore pledge for a detailed characterization of samples including, e.g., a possible layering. For the widely used Si wafer, for instance, it is inevitable to characterize its oxide layer. (Being precise, not only oxide layer thickness shall be characterized but also the refractive index since depending on the production process, different porosities of amorphous Si dioxide layers can be gained).
Since an experimental study of possible conformational changes of individual proteins during the adsorption process is too challenging to date, colloidal MC simulations were launched using an effective particle model. Here, the sensitivity of the adsorption kinetics to conformational (or even simpler: geometrical) changes of adsorbing objects shall be probed and the results shall then be compared to the experimental findings in order to be able to propose a suitable model. At first sight, a colloidal approach seems too rough to give reliable results for protein adsorption. However, to match the time scale of the experiment and to be able to include conformational changes, colloidal MC simulations are the method of choice.
MC approach
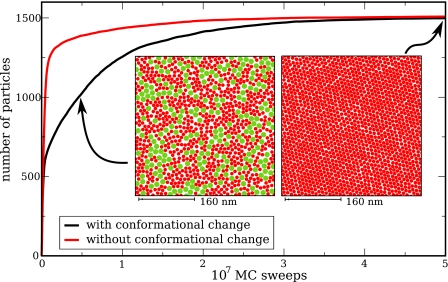
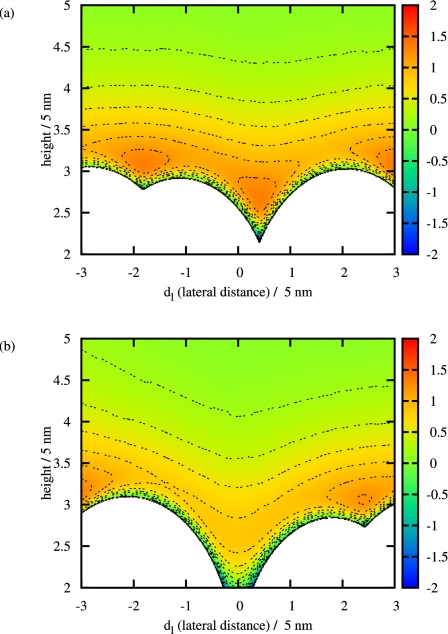
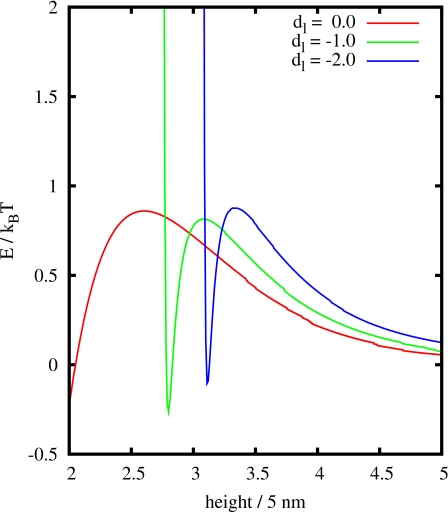
Using the particle model including a conformational change, as presented in Sec. 4, we observe a considerable deviation from simple, Langmuir-like adsorption kinetics,8, 9 cf. Fig. 6. Furthermore, particles adsorbing to the surface are directed to their adsorption site by the interaction with other particles already adsorbed. This is a major difference compared to RSA, where possible adsorption sites are randomly chosen. Figure 7 shows two snapshots of the energy landscape for a particle approaching the surface. In Fig. 7b, there is enough free space for a particle to adsorb to the surface. As a consequence, the energy barrier evoked by the particles already adsorbed is lower than in the first plot. Passing this barrier, a particle is trapped in an attractive potential, as illustrated in Fig. 8. Therefore, the particle will most likely follow the gradient to the minimum in the energy landscape and is eventually directed to the adsorption site. Actually, Fig. 7a evolved from Fig. 7b: Adsorbing to the surface, a particle moved its neighbors slightly so that it could fit to the adsorption site. The particle was removed again for the plot to ensure a better comparison of the energy landscape.
Figure 6.
Adsorption kinetics of simulations with (black) and without (red) change of conformation. For lower surface coverages, the expanded state is more stable than the compact one. Packing more particles to the surface, the contrary occurs.
Figure 7.
The energy landscape of a particle approaching the surface for two different points in time. The isolines mark steps of 0.2; the white area has infinite potential energy (measured in kBT).
Figure 8.
The energy landscape of a particle approaching the surface: This is a plot of the potential energy for different lateral distances, as shown in Fig. 7b.
Typically, the comparison of the simulation results with the experimental findings is carried out via the measured kinetics. It is suggested by experimental results that the deviation from Langmuir-like kinetics is due to different surface potentials provoked by different Si oxide layer thicknesses, which affect the conformational stability of the proteins. In the simulations, a different kinetics can be achieved by the assumption of a geometrical change of the adsorbed particles.
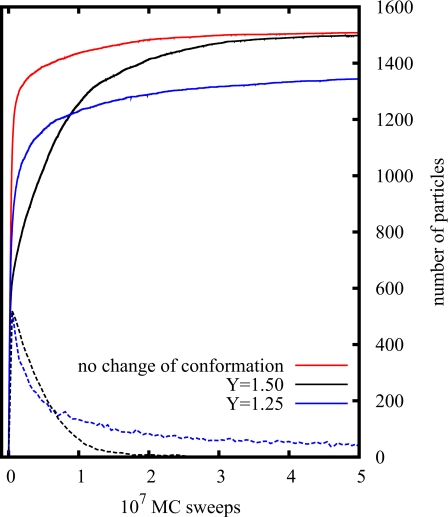
The degree of deformation of an adsorbed protein depends obviously on the strength of the surface potential. In the model, the degree of deformation for adsorbed particles is considered via the scaling of the long axes Y, i.e., for stronger surface interactions larger values of scaling are expected (c.f. Fig. 2). In Fig. 9, the kinetics of adsorption is shown for different values of Y, where the curves for Y=1 (no conformational changes, solid red curve) and Y=1.5 (solid black curve) are already shown in Fig. 6. Comparing the impact of all other parameters in the simulations, it turns out that the variation of the deformation has the strongest influence on the adsorption kinetics. The amplitude of the surface potential (which can be influenced by a variation of the oxide layer thickness), for instance, has only little impact on the adsorption kinetics. These model results are consistent with the experimental observations where significant variations of the adsorption kinetics are only recorded for different oxide layers if flexible proteins are used.
Figure 9.
The influence of the particle deformation (denoted by Y) on the type of kinetics: Solid curves mark the total number of adsorbed particles and the dashed curves the fraction of particles in the expanded state.
Combining experimental and theoretical results, we suppose that van der Waals-induced conformational changes are the reason for the experimentally observed kinetics. Yet, as the same theoretical curves could possibly be generated in different ways, a comparison of the distribution of the adsorbed particles in both simulation and experiment is desirable. Using ellipsometry, the statistical distribution cannot be probed and statistical properties such as the pair correlation function or the Euler characteristics cannot be obtained. To overcome this deficiency in situ AFM measurements can be performed, as presented in the next section.
AFM results
Ideally, AFM scans are performed on the same substrates (and under the same conditions) as ellipsometry measurements. To date, however, we did not yet succeed to perform in situ AFM scans on these systems. Stabilizing the protein layer by, e.g., glutaraldehyde, leads to artifacts of the protein pattern due to cross-linking as demonstrated in Fig. 10 in simulation [(a) and (b)] and experiment (c). Therefore, this method is not adequate to gain the statistical distribution of adsorbed proteins.
On mica, however, in situ AFM scanning with stable scanning conditions as described in B was possible, and no fixation of the protein was needed. Figure 11 displays a consecutive series of in situ AFM scans of adsorbed BSA on mica.
The elevated objects (bright colors) have an ellipsoidal shape with a long axis of 22±7 nm and a short axis of 15±5 nm (without tip deconvolution: nominal tip radius 15 nm). These dimensions are in good agreement with the dimensions reported in literature3 (14×4×4 nm3) indicating that single BSA molecules are displayed on the surface. The height of the proteins ranges between 0.7 and 1.6 nm, depending on the scanning parameters in noncontact mode AFM and is therefore not a reliable measure for such small and soft objects.94 Due to the restrictions in resolution, conformational changes are very likely not resolvable.
For the measurements on mica, no surface mobility was detected. The interaction between the highly negatively charged mica and the BSA is believed to hinder the mobility of the proteins. To test this hypothesis, the Debye screening length can be reduced by increasing the ionic strength of the buffer. However, reducing the attraction between the proteins and the surface leads to fragile scanning conditions.
The proteins were found to adsorb only within a monolayer, as at no occasion protein heights of two times of a “usual” protein height are recorded. Moreover, they do not preferentially form clusters on the surface, but rather exhibit a random distribution. According to the simulation results, however, an influence of the mutual interactions on the particle distribution is expected. Yet on mica, the particle-surface interactions seem to exceed the particle-particle interactions by far, suppressing any collective effect. Hence, for future studies it seems rewarding to search for surfaces on which single protein adsorption is detectable (e.g., by AFM) while the adsorbed proteins still maintain a certain surface mobility. Then, the knowledge of the statistics of adsorption sites will open an opportunity to determine the interaction potential between the adsorbed proteins and their surface mobility by comparison of experimental results and simulations.
In this study, we have developed a consistent qualitative picture of protein adsorption on tailored surfaces. The simulation results indicate that induced conformational changes may lead to qualitatively different adsorption kinetics. In particular, the possibility of the particles to undergo transitions from compact to flattened states and back results in a collective transition process at the surface. The time scale of the collective transition process is determined by the particle mobility at the surface as well as the ratios of particle radii. This process deviates from the time scale of the actual adsorption process, leading to the regime of constant adsorption rate in the kinetics. This is consistent with the experimental observations. From the simulations, we expect that the thin oxide layer in combination with the applied experimental conditions leads to the right particle mobility at the surface as well as the right ratio of particle radii to enable an observation of the reported non-Langmuir-like kinetics. A variation of experimental conditions as, e.g., altered protein concentration, rougher surfaces, different pH values, and—as shown—different surface forces suppresses the regime of constant adsorption rate. In contrast, decreasing the temperature leads to a prolonged linear regime corroborating the theoretical expectation of a deceleration of surface mobility and reduced transition rate between the particle states.
SUMMARY AND CONCLUSIONS
The experimental and theoretical characterizations of protein-biofilms are challenging tasks. In this work, we used a number of different methods in order to characterize the adsorption kinetics of proteins at different kinds of surfaces. The experimental results showed that both the long- and short-ranged interactions strongly influence the adsorption kinetics of the proteins. By means of ellipsometry, it has been shown that flexible proteins, e.g., amylase and BSA, show an intermediate linear regime upon adsorption on Si wafers with thin oxide layer, which we termed non-Langmuir-like kinetics. Complementary computer simulations, which describe the proteins as single spherical particles with an internal degree of freedom, indicate that this kind of kinetics is the result of conformational changes induced by density-density fluctuations. This scenario has been tested experimentally by using different kinds of proteins and substrates. Yet, the adsorption of more rigid proteins—such as lysozyme—led to a Langmuir-like adsorption kinetics on all Si wafer types.
A proof-of-concept is given by in situ AFM scans of BSA on mica. A future challenge is to in situ study the statistics of adsorption sites on silicon wafers, which enables a direct comparison of experimental and theoretical results. Future experiments will explore regimes of different surface mobility of the adsorbing molecules.
To conclude, three points are important for future biofilm studies: (i) Van der Waals forces must be taken into account (therefore a detailed characterization of samples is mandatory), (ii) conformational changes upon adsorption can be triggered by particle-particle and particle-surface interactions (where long-ranged forces have to be taken into account, too), and (iii) colloidal simulations are currently the only method of choice for describing the kinetics of these systems, which span over minutes to hours.
ACKNOWLEDGMENTS
The authors acknowledge financial support by the German Science Foundation under Grant Nos. GRK 1276 and GRK 532 as well as technical support by Wacker Siltronic AG, Burghausen, Germany.
References
- Norde W., Adv. Colloid Interface Sci. 25, 267 (1986). 10.1016/0001-8686(86)80012-4 [DOI] [PubMed] [Google Scholar]
- Denis F. A., Hanarp P., Sutherland D. S., Gold J., Mustin C., Rouxhet P., and Dufrêne Y. F., Langmuir 18, 819 (2002). 10.1021/la011011o [DOI] [Google Scholar]
- Biopolymers at Interfaces, edited by Malmsten M. (Dekker, New York, 2003). [Google Scholar]
- Michael K. E., Vernekar V. N., Keselowsky B. G., Meredith J., Latour R. A., and Garcia A. J., Langmuir 19, 8033 (2003). 10.1021/la034810a [DOI] [Google Scholar]
- Gray J. J., Curr. Opin. Struct. Biol. 14, 110 (2004). 10.1016/j.sbi.2003.12.001 [DOI] [PubMed] [Google Scholar]
- Keselowsky B. G., Collard D. M., and García A., Proc. Natl. Acad. Sci. U.S.A. 102, 5953 (2005). 10.1073/pnas.0407356102 [DOI] [PMC free article] [PubMed] [Google Scholar]
- Teughels W., Assche N. V., Sliepen I., and Quirynen M., Clin. Oral Implants Res. 17, 68 (2006). 10.1111/j.1600-0501.2006.01353.x [DOI] [PubMed] [Google Scholar]
- Quinn A., Mantz H., Bellion M., and Jacobs K., Europhys. Lett. 81, 56003 (2008). 10.1209/0295-5075/81/56003 [DOI] [Google Scholar]
- Bellion M., Santen L., Mantz H., Hähl H., Quinn A., Nagel A., Gilow C., Weitenberg C., Schmitt Y., and Jacobs K., J. Phys.: Condens. Matter 20, 404226 (2008). 10.1088/0953-8984/20/40/404226 [DOI] [Google Scholar]
- Seemann R., Herminghaus S., and Jacobs K., J. Phys.: Condens. Matter 13, 4925 (2001). 10.1088/0953-8984/13/21/319 [DOI] [Google Scholar]
- Seemann R., Herminghaus S., and Jacobs K., Phys. Rev. Lett. 86, 5534 (2001). 10.1103/PhysRevLett.86.5534 [DOI] [PubMed] [Google Scholar]
- Seemann R., Herminghaus S., Neto C., Schlagowski S., Podzimek D., Konrad R., Mantz H., and Jacobs K., J. Phys.: Condens. Matter 17, S267 (2005). 10.1088/0953-8984/17/9/001 [DOI] [Google Scholar]
- Huber G., Mantz H., Spolenak R., Mecke K., Jacobs K., Gorb N. S., and Arzt E., Proc. Natl. Acad. Sci. U.S.A. 102, 16293 (2005). 10.1073/pnas.0506328102 [DOI] [PMC free article] [PubMed] [Google Scholar]
- Israelachvili J., Intermolecular and Surface Forces (Academic, New York, 1992). [Google Scholar]
- Schmidt C. F., Zimmermann R. M., and Gaub H. E., Biophys. J. 57, 577 (1990). 10.1016/S0006-3495(90)82573-X [DOI] [PMC free article] [PubMed] [Google Scholar]
- Wertz C. F. and Santore M. M., Langmuir 18, 1190 (2002). 10.1021/la0108813 [DOI] [Google Scholar]
- Ishiguro R., Yokoyama Y., Maeda H., Shimamura A., Kemeyama K., and Hiramatsu K., J. Colloid Interface Sci. 290, 91 (2005). 10.1016/j.jcis.2005.04.008 [DOI] [PubMed] [Google Scholar]
- Daly S., Przybycien T. M., and Tilton R. D., Langmuir 19, 3848 (2003). 10.1021/la026690x [DOI] [Google Scholar]
- Baujard-Lamotte L., Noinville S., Boubard F., Marque P., and Pauthe E., Colloids Surf., B 63, 129 (2008). 10.1016/j.colsurfb.2007.11.015 [DOI] [PubMed] [Google Scholar]
- Norde W. and Favier J. P., Colloids Surf. 64, 87 (1992). 10.1016/0166-6622(92)80164-W [DOI] [Google Scholar]
- Foster J., Albumin Structure, Function and Uses (Pergamon, Oxford, NY, 1977), pp. 53–84. [Google Scholar]
- Carter D. C. and Ho J. X., Adv. Protein Chem. 45, 153 (1994). 10.1016/S0065-3233(08)60640-3 [DOI] [PubMed] [Google Scholar]
- Olivieri J. R. and Craievich A. F., Eur. Biophys. J. 24, 77 (1995). [DOI] [PubMed] [Google Scholar]
- Marx D., ChemPhysChem 7, 1848 (2006). 10.1002/cphc.200600128 [DOI] [PubMed] [Google Scholar]
- Latour R. A., BioInterphases 3, FC2 (2008). 10.1116/1.2965132 [DOI] [PMC free article] [PubMed] [Google Scholar]
- Rimola A., Corno M., Zicovich-Wilson C. M., and Ugliengo P., Phys. Chem. Chem. Phys. 11, 9005 (2009). 10.1039/b913311a [DOI] [PubMed] [Google Scholar]
- Nikitina E., Sulimov V., Grigoriev F., Kondakova O., and Luschekina S., Int. J. Quantum Chem. 106, 1943 (2006). 10.1002/qua.20943 [DOI] [Google Scholar]
- Nikitina E., Sulimov V., Zayets V., and Zaitseva N., Int. J. Quantum Chem. 97, 747 (2004). 10.1002/qua.10778 [DOI] [Google Scholar]
- Wada M. and Sakurai M., J. Comput. Chem. 26, 160 (2005). 10.1002/jcc.20154 [DOI] [PubMed] [Google Scholar]
- Yu N., Yennawar H. P., and K. M.Merz, Jr., Acta Crystallogr., Sect. D: Biol. Crystallogr. 61, 322 (2005). 10.1107/S0907444904033669 [DOI] [PubMed] [Google Scholar]
- Friesner R. A. and Guallar V., Annu. Rev. Phys. Chem. 56, 389 (2005). 10.1146/annurev.physchem.55.091602.094410 [DOI] [PubMed] [Google Scholar]
- Gordon M. S., Mullin J. M., Pruitt S. R., Roskop L. B., Slipchenko L. V., and Boatz J. A., J. Phys. Chem. B 113, 9646 (2009). 10.1021/jp811519x [DOI] [PubMed] [Google Scholar]
- Fedorov D. G. and Kitaura K., J. Phys. Chem. A 111, 6904 (2007). 10.1021/jp0716740 [DOI] [PubMed] [Google Scholar]
- Li X., Li Y., Cheng T., Liu Z., and Wang R., J. Comput. Chem. 31, 2109 (2010). 10.1002/jcc.21498 [DOI] [PubMed] [Google Scholar]
- Deev V. and Collins M. A., J. Chem. Phys. 122, 154102 (2005). 10.1063/1.1879792 [DOI] [PubMed] [Google Scholar]
- Collins M. A. and Deev V. A., J. Chem. Phys. 125, 104104 (2006). 10.1063/1.2347710 [DOI] [PubMed] [Google Scholar]
- Collins M. A., J. Chem. Phys. 127, 024104 (2007). 10.1063/1.2746025 [DOI] [PubMed] [Google Scholar]
- Gordon M. S., Freitag M. A., Bandyopadhyay P., Jensen J. H., Kairys V., and Stevens W. J., J. Phys. Chem. A 105, 293 (2001). 10.1021/jp002747h [DOI] [Google Scholar]
- Minikis R. M., Kairys V., and Jensen J. H., J. Phys. Chem. A 105, 3829 (2001). 10.1021/jp0032659 [DOI] [Google Scholar]
- Ishida T., J. Chem. Phys. 129, 125105 (2008). 10.1063/1.2977458 [DOI] [PubMed] [Google Scholar]
- Ishikawa T., Ishikura T., and Kuwata K., J. Comput. Chem. 30, 2594 (2009). 10.1002/jcc.21265 [DOI] [PubMed] [Google Scholar]
- Bolhuis P. G., Chandler D., Dellago C., and Geissler P. L., Annu. Rev. Phys. Chem. 53, 291 (2002). 10.1146/annurev.physchem.53.082301.113146 [DOI] [PubMed] [Google Scholar]
- Kim M. K., Chirikjian G. S., and Jernigan R. L., J. Mol. Graphics Modell. 21, 151 (2002). 10.1016/S1093-3263(02)00143-2 [DOI] [PubMed] [Google Scholar]
- Kern D. and Zuiderweg E. R. P., Curr. Opin. Struct. Biol. 13, 748 (2003). 10.1016/j.sbi.2003.10.008 [DOI] [PubMed] [Google Scholar]
- Freddolino P. L., Liu F., Gruebele M., and Schulten K., Biophys. J. 94, L75 (2008). 10.1529/biophysj.108.131565 [DOI] [PMC free article] [PubMed] [Google Scholar]
- Sun Y. and Latour R. A., J. Comput. Chem. 27, 1908 (2006). 10.1002/jcc.20488 [DOI] [PubMed] [Google Scholar]
- Sun Y., Dominy B. N., and Latour R. A., J. Comput. Chem. 28, 1883 (2007). 10.1002/jcc.20716 [DOI] [PubMed] [Google Scholar]
- Voelz V. A., Bowman G. R., Beauchamp K., and Pande V. S., J. Am. Chem. Soc. 132, 1526 (2010). 10.1021/ja9090353 [DOI] [PMC free article] [PubMed] [Google Scholar]
- van der Vaart A., Theor. Chim. Acta 116, 183 (2006). 10.1007/s00214-005-0004-1 [DOI] [Google Scholar]
- Monticelli L., Kandasamy S. K., Periole X., Larson R. G., Tieleman D. P., and Marrink S., J. Chem. Theory Comput. 4, 819 (2008). 10.1021/ct700324x [DOI] [PubMed] [Google Scholar]
- Tozzini V., Curr. Opin. Struct. Biol. 15, 144 (2005). 10.1016/j.sbi.2005.02.005 [DOI] [PubMed] [Google Scholar]
- Bereau T. and Deserno M., J. Chem. Phys. 130, 235106 (2009). 10.1063/1.3152842 [DOI] [PMC free article] [PubMed] [Google Scholar]
- Karplus M. and McCammon J. A., Nat. Struct. Mol. Biol. 9, 646 (2002). 10.1038/nsb0902-646 [DOI] [PubMed] [Google Scholar]
- Doliwa B. and Heuer A., Phys. Rev. E 61, 6898 (2000). 10.1103/PhysRevE.61.6898 [DOI] [PubMed] [Google Scholar]
- Gao Y. Q., Yang L., Fan Y., and Shao Q., Int. Rev. Phys. Chem. 27, 201 (2008). 10.1080/01442350801920334 [DOI] [Google Scholar]
- Escobedo F. A., Borrero E. E., and Araque J. C., J. Phys.: Condens. Matter 21, 333101 (2009). 10.1088/0953-8984/21/33/333101 [DOI] [PubMed] [Google Scholar]
- Makrodimitris K., Masica D. L., Kim E. T., and Gray J. J., J. Am. Chem. Soc. 129, 13713 (2007). 10.1021/ja074602v [DOI] [PubMed] [Google Scholar]
- Van Tassel P. R., Viot P., and Tarjus G., J. Chem. Phys. 106, 761 (1997). 10.1063/1.473164 [DOI] [Google Scholar]
- Talbot J., Tarjus G., van Tassel P. R., and Viot P., Colloids Surf., A 165, 287 (2000). 10.1016/S0927-7757(99)00409-4 [DOI] [Google Scholar]
- Adamczyk Z. and Weronski P., J. Colloid Interface Sci. 189, 348 (1997). 10.1006/jcis.1997.4832 [DOI] [Google Scholar]
- Oberholzer M. R., Stankovich J. M., Carnie S. L., Chan D. Y. C., and Lenhoff A. M., J. Colloid Interface Sci. 194, 138 (1997). 10.1006/jcis.1997.5095 [DOI] [PubMed] [Google Scholar]
- Semmler M., Mann E. K., Rička J., and Borkovec M., Langmuir 14, 5127 (1998). 10.1021/la9801559 [DOI] [Google Scholar]
- Adamczyk Z., Zembala M., Siwek B., and Warszyński P., J. Colloid Interface Sci. 140, 123 (1990). 10.1016/0021-9797(90)90329-M [DOI] [Google Scholar]
- Van Tassel P. R., Viot P., Tarjus G., and Talbot J., J. Chem. Phys. 101, 7064 (1994). 10.1063/1.468332 [DOI] [Google Scholar]
- Lavalle P., Schaaf P., and Ostafin M., Proc. Natl. Acad. Sci. U.S.A. 96, 11100 (1999). 10.1073/pnas.96.20.11100 [DOI] [PMC free article] [PubMed] [Google Scholar]
- Lončarević I., Budinski-Petković L., and Vrhovac S. B., Phys. Rev. E 76, 031104 (2007). 10.1103/PhysRevE.76.031104 [DOI] [PubMed] [Google Scholar]
- Hirayama K., Akashi S., Furuya M., and ichi Fukuhara K., Biochem. Biophys. Res. Commun. 173, 639 (1990). 10.1016/S0006-291X(05)80083-X [DOI] [PubMed] [Google Scholar]
- Hu S., Xie M. Y., Ramachandran P., Loo R. R. O., Loo J. A., and Wong D. T., Proteomics 5, 1714 (2005). 10.1002/pmic.200401037 [DOI] [PubMed] [Google Scholar]
- Arnebrant T., Biopolymers at Interfaces (Dekker, New York, 2003) Chap. 29, pp. 811–855. [Google Scholar]
- Roth C. M. and Lenhoff A. M., Langmuir 11, 3500 (1995). 10.1021/la00009a036 [DOI] [Google Scholar]
- Malamud D. and Drysdale J. W., Anal. Biochem. 86, 620 (1978). 10.1016/0003-2697(78)90790-X [DOI] [PubMed] [Google Scholar]
- Wasserman S. R., Whiteside G. M., Tidswell I. M., Ocko B. M., Pershan P. S., and Axe J. D., J. Am. Chem. Soc. 111, 5852 (1989). 10.1021/ja00197a054 [DOI] [Google Scholar]
- Brzoska J. B., Azouz I. B., and Rondelez F., Langmuir 10, 4367 (1994). 10.1021/la00023a072 [DOI] [Google Scholar]
- Mykhaylyk T. A., Evans S. D., Fernyhough C., Hamley I., and Henderson J. R., J. Colloid Interface Sci. 260, 234 (2003). 10.1016/S0021-9797(02)00188-1 [DOI] [PubMed] [Google Scholar]
- Zimmermann R., Dukhin S., and Werner C., J. Phys. Chem. B 105, 8544 (2001). 10.1021/jp004051u [DOI] [PubMed] [Google Scholar]
- Kim D. T., Blach H. W., and Radke C. J., Langmuir 18, 5841 (2002). 10.1021/la0256331 [DOI] [Google Scholar]
- Silva L. P., Curr. Protein Pept. Sci. v6, 387 (2005). 10.2174/1389203054546389 [DOI] [PubMed] [Google Scholar]
- Cheung J. W. C. and Walker G. C., Langmuir 24, 13842 (2008). 10.1021/la802452v [DOI] [PubMed] [Google Scholar]
- Ouerghi O., Touhami A., Othmane A., Ouada H. B., Martelet C., Fretigny C., and Jaffrezic-Renault N., Biomol. Eng. 19, 183 (2002). 10.1016/S1389-0344(02)00046-1 [DOI] [PubMed] [Google Scholar]
- Bergkvist M., Carslsson J., Karlsson T., and Oscarsson S., J. Colloid Interface Sci. 206, 475 (1998). 10.1006/jcis.1998.5630 [DOI] [PubMed] [Google Scholar]
- Marchin K. L. and Berrie C. L., Langmuir 19, 9883 (2003). 10.1021/la035127r [DOI] [Google Scholar]
- Azzam R. M. A. and Bashara N. M., Ellipsometry and Polarized Light (North-Holland, Amsterdam, 1977). [Google Scholar]
- Cuypers P. A., Corsel J. W., Janssen M. P., Kop J. M., Hermens W. T., and Hemker H. C., J. Biol. Chem. 258, 2426 (1983). [PubMed] [Google Scholar]
- de Feijter J. A., Benjamins J., and Veer F. A., Biopolymers 17, 1759 (1978). 10.1002/bip.1978.360170711 [DOI] [Google Scholar]
- Ball V. and Ramsden J. J., Biopolymers 46, 489 (1998). [DOI] [Google Scholar]
- Agheli H., Malmstrm J., Larsson E., Textor M., and Sutherland D. S., Nano Lett. 6, 1165 (2006). 10.1021/nl060403i [DOI] [PubMed] [Google Scholar]
- Lea A. S., Pungor A., Hlady V., Andrade J. D., Herron J. N., and Voss J. E. W., Langmuir 8, 68 (1992). 10.1021/la00037a015 [DOI] [PMC free article] [PubMed] [Google Scholar]
- Agnihotri A. and Siedlecki C. A., Langmuir 20, 8846 (2004). 10.1021/la049239+ [DOI] [PubMed] [Google Scholar]
- Siedlecki C. A., Eppel S. J., and Marchant R. E., J. Biomed. Mater. Res. 28, 971 (1994). 10.1002/jbm.820280902 [DOI] [PubMed] [Google Scholar]
- Eppell S. J., Zypman F. R., and Marchant R. E., Langmuir 9, 2281 (1993). 10.1021/la00033a007 [DOI] [Google Scholar]
- Verwey E. J. W. and Overbeek J. T. G., Theory of the Stability of Lyophobic Colloids (Dover, New York, 1999), p. 218. [Google Scholar]
- Derjaguin B. and Landau L., Prog. Surf. Sci. 43, 30 (1993). 10.1016/0079-6816(93)90013-L [DOI] [Google Scholar]
- Tanford C., Science 200, 1012 (1978). 10.1126/science.653353 [DOI] [PubMed] [Google Scholar]
- Knoll A., Magerle R., and Krausch G., Macromolecules 34, 4159 (2001). 10.1021/ma001311x [DOI] [Google Scholar]


