Abstract
We present an application of a novel DNA separation matrix, cholesterol-bearing pullulan (CHP) nanogels, for microchip electrophoresis. The solution of the CHP showed a unique phase transition around 30 mg∕ml and formed gel phase over this critical concentration. This gel phase consists of the weak hydrophobic interactions between the cholesterols could be easily deformed by external forces, and thus, loading process of the CHP nanogels into microchannels became easier. The high concentration of the CHP nanogels provided excellent resolutions especially for small DNA fragments from 100 to 1500 bp. The separation mechanism was discussed based on Ogston and Reptation models which had developed in gels or polymer solutions. The result of a single molecule imaging gave us an insight of the separation mechanism and the nanogel structures as well.
INTRODUCTION
There have been increasing demands for developments in DNA separation matrices, which directly dictate the separation resolution and difficulty of microchannel loading as well. Other than the well studied uncross-linked polymer, such as linear polyacrylamide,1 hydroxyethyl cellulose,2 and their derivatives,3, 4 a number of different polymers have been developed according to the separation targets, e.g., single- or double-stranded DNA, denatured or nondenatured protein, sugar isomers, low-molecular compounds, and so on. In microchip electrophoresis, a large surface area of the microchannel always affects a loading process of separation matrices into the microchannel and separation efficiencies due to a nonspecific adsorption onto the microchannel. To avoid these problems, thermoresponsive and self-coating polymeric matrices have been developed. For instance, thermothinning polymer solutions including the mixture of hydroxypropyl cellulose and hydroxyethyl cellulose5 showed a thermodynamic solubility-to-insolubility phase transition. At room temperature, these polymers form an entangled network and exhibit viscous solution. The polymer chains collapse with temperature elevation and a tremendous reduction in solution viscosity occurs, and as a result, the solution could be easily introduced into the microchannel under low applied pressure. Thermothickening matrices exhibit an opposite behavior, that is, these polymer solutions have a low viscosity at room temperature or lower and increase the viscosity according to temperature elevation. Pluronic F127 (Refs. 6, 7, 8, 9, 10, 11) and poly-N-isopropylacrylamide grafted poly(ethylene oxide)12, 13 are typical themothicking matrices and used for double-stranded DNA sizing and single-stranded DNA separation. These unique characteristics of the polymer solutions attribute to the thermal induced microdomain driven by weak hydrophobic interaction of branches of graft copolymers or components of block polymers. This kind of polymers generally showed thixotropic flow: Viscosity drops dramatically with application of shear force and the process of matrix filling into the microchannel was allowed quickly and easily even at room temperature. However an enormous initial pressure is required to fill the solutions into the microchannel because the zero-shear viscosities are high on the order of 105 cP. This might cause a serious problem on microchip itself because most plastic microchips could tolerate only 50 psi (350 kPa). In this study, we applied a new type of DNA separation matrix, cholesteryl-bearing pullulan (CHP),14 which forms hydrogel nanoparticles so-called nanogels at low concentration as shown in Fig. 1.15, 16, 17 At higher concentration above approximately 30 mg∕ml, the viscosity of the solution drastically increased and formed macroscopic gels by association of hydrophobically modified pullulans. However, the zero-shear viscosity is still on the order of 102–103 cP even after the phase transition, and thus, loading of the CHP solution into the microchannel could be achieved by moderate pressure (10–40 kPa). In this study, we applied this unique feature of the CHP nanogel to microchip electrophoresis and investigated the separation mechanism of DNA fragments.
Figure 1.
Chemical structures of cholesterol modified pullulans and schematic illustration of the formation of a nanogel by self-association of the cholesteryl groups in water.
METHODS AND MATERIALS
Nanogel preparation
CHP nanogel was synthesized as previously reported.14 The average molecular weight (Mw) of pullulan was 1.08×10⁵ and the degree of substitution of hydrophobic groups of CHP was approximately 1.6 per glucose units. The CHP nanogel was dissolved in phosphate buffered saline and provided for the following electrophoresis experiments.
DNA sample preparation
For fluorescence detection of DNA molecules in microchip electrophoresis, YOYO-1 (Invitrogen, Tokyo, Japan) was premixed at a final concentration of 3.0 μM with various concentration of CHP solution in 0.5× tris-borate-ethylenediaminetetraacetic acid buffer. For separation experiments, 100 bp DNA ladders (100–1000 and 1500 bp) were obtained from Takara Bio Inc. (Shiga, Japan). For single DNA molecule imaging, T4GT7 DNA (166 kbp, Nippon Gene Co. Ltd., Tokyo, Japan) were stained with YOYO-1 at a dye-to-base ratio of 1:10.
Microchip electrophoresis
All electrophoretic experiments were conducted by Hitachi SV1110 microchip electrophoresis system. The system specifications were described elsewhere.18 The poly(methyl methacrylate) microchips, which consist of 100 μm wide and 30 μm deep simple cross channel, were used. The effective separation length was 30 mm. The solution of the CHP nanogel at concentrations from approximately 25.0–35.0 mg∕ml was introduced into the microchannels by mild pressure through a conventional hand syringe. DNA sample loading and injection processes were performed at 200 and 92 V∕cm, respectively.
Single DNA molecule imaging
A straight microchannel consisting of a 200 μm wide, 50 μm high, and 1.1 cm long was used for the imaging experiments. The microchannel was fabricated based on the conventional soft lithography techniques.19 A 50 μm thick layer of a negative photoresist, SU-8 3050 (Nippon Kayaku Co., Ltd., Tokyo, Japan), was spincoated on a silicon wafer. The SU-8 coated master mold was exposed with UV light through the microchannel pattern on the transparency-film photomask using mask aligner (MJB3, SUSS Micro Tec KK, Yokohama, Japan). After development of the cross-linked SU-8 by immersing in SU-8 developer (Nippon Kayaku Co., Ltd., Tokyo, Japan) with agitation, the emerging pattern was used as a master. The master was silanized by exposure to the vapor of trichloro(3,3,4,4,5,5,6,6,7,7,8,8,8-tridecafluorooctyl) silane (Sigma-Aldrich, Tokyo, Japan) under vacuum for 3 h. Poly(dimethylsiloxane) (PDMS) base and curing agent (Sylgard 184, Dow Corning, Tokyo, Japan) were mixed thoroughly at a ratio of 10 to 1 by weight. The prepolymer was poured over the master, cured overnight, and then peeled off. The PDMS microchannel was exposed to oxygen plasma (PIB-10, Vacuum Device Inc., Mito, Japan) for 15 s and immediately bonded to a glass cover plate. We mounted the chip on an inverted epifluorescence microscope (Eclipse TE300, Nikon, Japan) and observed the DNA molecule using a 100×, 1.4 numerical aperture oil immersion objective. The images were captured by an electron bombardment charge coupled device camera (C7190-43, Hamamatsu Photonics, Hamamatsu, Japan) and recorded on a DVCAM tape (PDV-184N, SONY, Tokyo, Japan) by a DVCAM recorder (DSR-11, SONY, Tokyo, Japan). The electric fields were applied in each reservoir by a programmable high voltage power supply (HVS448-1500, LabSmith, Livermore, CA) through platinum electrodes.
RESULTS AND DISCUSSION
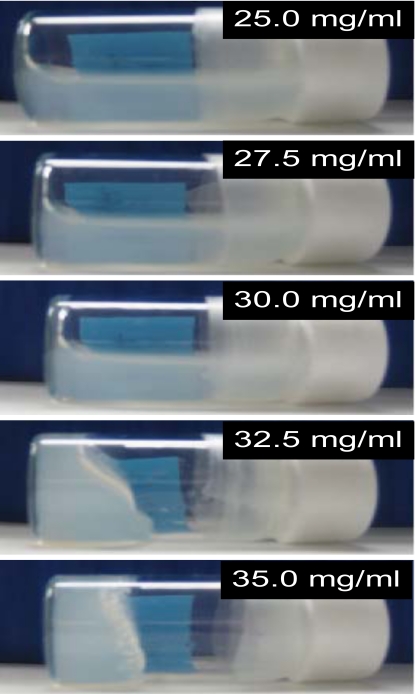
CHP nanogel solution was reported to show a pronounced shear thinning behavior above 30 mg∕ml, that is, the viscosity rapidly increased at approximately 20.0 mg∕ml and gel formation was observed above 35 mg∕ml, by Kuroda et al.17 To confirm these macroscopic behaviors, we simply observed and captured the state of the CHP nanogel solution at various concentrations in the tilted vials. As shown in Fig. 2, the gelation was gradually progressed above 30 mg∕ml.
Figure 2.
Photographs of the CHP nanogel solution at various concentration in the vials.
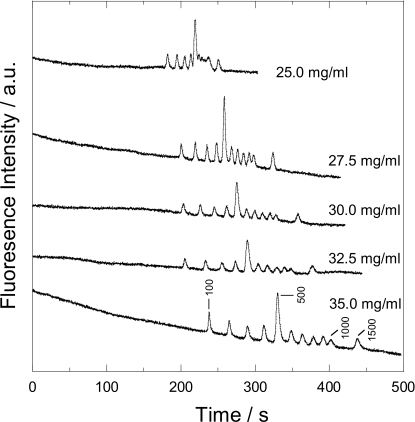
DNA electrophoresis experiments were performed under various concentrations of the CHP nanogel solution, from 25.0 to 35.0 mg∕ml. As shown in Fig. 3, the DNA fragments ranging from 500 to 1000 bp were not fully separated in 25.0 mg∕ml solution of the CHP nanogel. Although the DNA fragments of 900 and 1000 bp were still not separated well in 27.5, 30.0, and 32.5 mg∕ml solution, baseline separations of these DNA fragments were achieved at a concentration of 35 mg∕ml. This tendency, in which higher concentration of the CHP nanogel gave better resolutions, agreed with a general rule of DNA sieving matrices. Therefore, we examined separation mechanisms in the CHP nanogel by applying existing separation models.
Figure 3.
Separation of 100 bp DNA ladder in various concentration of the CHP solution. All the electric field strength for separation was 92 V∕cm and the effective separation length was 30 mm.
The sieving ability of nanogel was characterized by the Ferguson plot, which describes the relation between the DNA electrophoretic mobility in the separation medium and the concentration of the separation medium at the given electric field as
| (1) |
where μ0 is the DNA-free solution electrophoretic mobility, Kr is a retardation coefficient which proportional to (r+Rg)2, with r being the radius of the gel fibers and Rg is the radius of the DNA molecule, C is the gel concentration, and K is a constant of proportionality. Figure 4 shows plots of logarithmic DNA electrophoretic mobility versus nanogel concentration for 11 DNA fragments. All data points were obtained from the electropherograms with different concentrations of nanogel as the separation medium at 25 °C. If we assume that the radius of gyration of the 100 bp fragment is larger than the radius of the gel fibers, Eq. 1 predicts that the Ogston-type separation should lead to straight line with negative slope. However, the straight line, having a correlation coefficient of r=0.974, intercepts the y-axis at a value of 3.02×10⁻⁴ cm2 V−1 s−1, which does not agree well with the experimental data of free solution mobility reported elsewhere.20, 21, 22, 23 If we take a closer look around 30.0 mg∕ml, a distinct mobility gap between 30.0 and 32.5 mg∕ml of CHP could be found, which might be attributable to the phase transition of nanogels, as shown in Fig. 2. If the regression line was fitted for three data points at 25.0, 27.5, and 30.0 mg∕ml, the y-intercept (3.82×10⁻⁴ cm2 V−1 s−1) became closer to the reported values20, 21, 22, 23 with a good correlation efficiency, r=1.000. The other regression line for the rest of points also showed the similar value of slope and y-intercept, 4.16×10⁻⁴ cm2 V−1 s−1. These values extrapolated from the mobilities at different nanogel concentrations suggested that the electrophoretic behavior of the 100 bp fragments obeyed the Ogston-type separation even under two different nanogel phases, sol and gel phases. The mobility gap between 30.0 and 32.5 mg∕ml, which might attribute to the nanogel phases transition, did not affect the electrophoretic behavior of the 100 bp fragments. In contrast, at concentrations of 25.0, 27.5, and 30.0 mg∕ml, the values of the slope became higher according to the size of DNA fragments and the y-intercepts were increased up to 9.29×10⁻⁴ cm2 V−1 s−1 (Fig. 4). The electrophoretic behavior of DNA fragments sized over 100 bp could not attribute to the Ogston model anymore under the above separation conditions. Therefore, we applied the biased reptation model (BRM), which generalizes the mobility of long DNA fragments in gels, to interpret the experimental data at the semiquantitative level.24
Figure 4.
Dependence of the electrophoretic mobility of 100 bp DNA ladder on (a) the CHP concentration and (b) the reciprocal of DNA size. Each data point represents the average of three to nine electropherograms.
In the BRM, the mobility of DNA fragments increases linearly with the electric field and the inverse molecular weight as shown in the following equation:
| (2) |
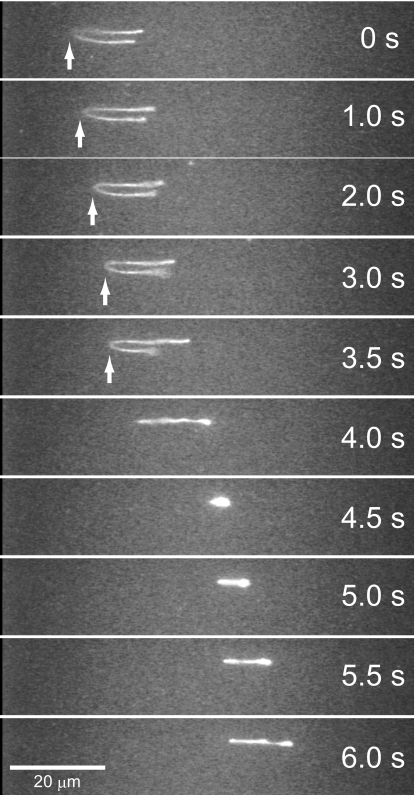
where ε is the ratio of the electrostatic potential energy to the thermal energy, associated with the displacement of a “blob” by a distance equal to its size.24 As shown in Fig. 4, all fitting lines (r≥0.999) from 200 to 1500 bp at all concentration ranges predict that the electrophoretic behaviors in the CHP solutions obey the BRM, regardless of whether the CHP nanogel takes sol or gel phase. These results suggest that a wide size range of DNA fragments (200–1500 bp) was separated based on the same separation mechanism, the BRM, both in sol and gel phases, and on the other hand, the phase transition of CHP solution at 30.0–32.5 mg∕ml affects only the absolute electrophoretic mobility. The slopes of the fitting lines in Fig. 4 suggest that higher concentration of the CHP solution provides better separation resolutions. This might be caused by the formation of temporary cross-linking by the intermolecular association of the hydrophobic cholesterol groups. When highly charged DNA molecule migrates in the CHP solution, it should avoid hydrophobic nanogel cores and passes through hydrophilic pullulan chain and interstitial domains. According to the increase of the CHP concentration, these interstitial domains for DNA migration will be decreased by the formation of interpolymer hydrophobic association and lead to the increase of the slopes, as shown in Fig. 4. Since the slopes in Fig. 4 did not show distinct CHP concentration dependency, microscopic structure of the CHP might not be dramatically changed, as observed in macroscopically observed sol-gel phase transition in Fig. 2. The result of a single molecule observation during DNA electrophoresis in the CHP solution also supported this assumption. In the CHP solution at 30.0 mg∕ml, DNA molecules were hooked by CHP nanogels and formed U-shape. However, this kink part of DNA migrated for a second, and then, long “arm” pulled short one and shrunk again, as shown in Fig. 5. If the tight mesh structures were formed like acrylamide and other gels, the kink part of DNA hooked by the mesh should not move during electrophoresis. Therefore, the formation of interpolymer hydrophobic association was not so rigid to constrain the DNA motion and be against the BRM.
Figure 5.
Migration behavior of a single DNA molecule in the CHP solution at 30 mg∕ml. The applied electric field was 18 V∕cm. The kink part of the DNA molecule indicated by the white arrows migrated for the first 3 s, and then, the U-shape was resolved by pulling the short arm.
CONCLUSIONS
We introduced a useful DNA separation matrix, the CHP nanogels, for microchip electrophoresis. In this paper, we demonstrated the separation of 100 bp DNA ladder both in sol and gel phases of the CHP nanogels solution, and that higher concentration gave better separation resolutions. Owing to the unique property of nanogels, thixotropy, loading of the solution into microchannel was easily achieved by mild pressure even at high concentration. In future work, we hope to be able to couple this thixotropic property with amphiphilic structures and achieve biomolecule separation based not only on physical sieving but also on chemical affinity interactions on a microchip.
ACKNOWLEDGMENTS
This research is partly supported by the Japan Society for the Promotion of Science (JSPS) through its “Funding Program for World-Leading Innovative R&D on Science and Technology (FIRST Program)”.
References
- Barron A. E., Sunada W. M., and Blanch H. W., Electrophoresis 17, 744 (1996). 10.1002/elps.1150170421 [DOI] [PubMed] [Google Scholar]
- Barron A. E., Soane D. S., and Blanch H. W., J. Chromatogr. A 652, 3 (1993). 10.1016/0021-9673(93)80639-P [DOI] [PubMed] [Google Scholar]
- Albarghouthi M. N., Buchholz B. A., Doherty E. A., Bogdan F. M., Zhou H., and Barron A. E., Electrophoresis 22, 737 (2001). [DOI] [PubMed] [Google Scholar]
- Baba Y., Ishimaru N., Samata K., and Tsuhako M., J. Chromatogr. A 653, 329 (1993). 10.1016/0021-9673(93)83191-T [DOI] [PubMed] [Google Scholar]
- Sassi A. P., Barron A., Alonso-Amigo M. G., Hion D. Y., Yu J. S., Soane D. S., and Hooper H. H., Electrophoresis 17, 1460 (1996). 10.1002/elps.1150170910 [DOI] [PubMed] [Google Scholar]
- Liang D. and Chu B., Electrophoresis 19, 2447 (1998). 10.1002/elps.1150191416 [DOI] [PubMed] [Google Scholar]
- Liu T., Liang D., Song L., Nace V. M., and Chu B., Electrophoresis 22, 449 (2001). [DOI] [PubMed] [Google Scholar]
- Wan F., Zhang J., Lau A., Tan S., Burger C., and Chu B., Electrophoresis 29, 4704 (2008). 10.1002/elps.200800267 [DOI] [PMC free article] [PubMed] [Google Scholar]
- Wu C., Liu T., and Chu B., Electrophoresis 19, 231 (1998). 10.1002/elps.1150190216 [DOI] [PubMed] [Google Scholar]
- Zhang J., Gassmann M., He W., Wan F., and Chu B., Lab Chip 6, 526 (2006). 10.1039/b515557f [DOI] [PubMed] [Google Scholar]
- Zhang J., Liang D., He W., Wan F., Ying Q., and Chu B., Electrophoresis 26, 4449 (2005). 10.1002/elps.200500099 [DOI] [PubMed] [Google Scholar]
- Liang D., Song L., Zhou S., Zaitsev V. S., and Chu B., Electrophoresis 20, 2856 (1999). [DOI] [PubMed] [Google Scholar]
- Liang D., Zhou S., Song L., Zaitsev V. S., and Chu B., Macromolecules 32, 6326 (1999). 10.1021/ma9901792 [DOI] [Google Scholar]
- Akiyoshi K., Deguchi S., Moriguchi N., Yamaguchi S., and Sunamoto J., Macromolecules 26, 3062 (1993). 10.1021/ma00064a011 [DOI] [Google Scholar]
- Lee I. and Akiyoshi K., Biomaterials 25, 2911 (2004). 10.1016/j.biomaterials.2003.09.065 [DOI] [PubMed] [Google Scholar]
- Akiyoshi K., Kobayashi S., Shichibe S., Mix D., Baudys M., Kim S. W., and Sunamoto J., J. Controlled Release 54, 313 (1998). 10.1016/S0168-3659(98)00017-0 [DOI] [PubMed] [Google Scholar]
- Kuroda K., Fujimoto K., Sunamoto J., and Akiyoshi K., Langmuir 18, 3780 (2002). 10.1021/la011454s [DOI] [Google Scholar]
- Dang F., Zhang L., Jabasini M., Kaji N., and Baba Y., Anal. Chem. 75, 2433 (2003). 10.1021/ac034110a [DOI] [PubMed] [Google Scholar]
- Xia Y. N. and Whitesides G. M., Annu. Rev. Mater. Sci. 28, 153 (1998). 10.1146/annurev.matsci.28.1.153 [DOI] [Google Scholar]
- Grossman P. D. and Soane D. S., Biopolymers 31, 1221 (1991). 10.1002/bip.360311010 [DOI] [PubMed] [Google Scholar]
- Stellwagen N. C., Gelfi C., and Righetti P. G., Biopolymers 42, 687 (1997). [DOI] [PubMed] [Google Scholar]
- Strutz K. and Stellwagen N. C., Electrophoresis 19, 635 (1998). 10.1002/elps.1150190504 [DOI] [PubMed] [Google Scholar]
- Tinland B., Pernodet N., and Weill G., Electrophoresis 17, 1046 (1996). 10.1002/elps.1150170612 [DOI] [PubMed] [Google Scholar]
- Viovy J. -L., Rev. Mod. Phys. 72, 813 (2000). 10.1103/RevModPhys.72.813 [DOI] [Google Scholar]


