

Abstract
Using an ex vivo liver sanguinous perfusion system, hemodynamic and biochemical changes of the porcine livers were studied, which were preserved cold (4°C) for 24 hr in University of Wisconsin solution and reperfused with normothermic (37°C) (n=8) or hypothermic (32°C) (n=8) blood for 3 hr. Six more livers were reperfused with normothermic blood (37°C) immediately after procurement as controls. The total hepatic blood flow was adjusted to 1 ml/min/g liver weight, in which hepatic artery and portal vein flows were administered at a 1:2 ratio. In livers stored cold for 24 hr in UW solution and perfused normothermically, a statistically higher hepatic artery resistance was exhibited at 30 and 60 min after reperfusion (P<0.05), and there was lower bile output (P<0.05) at 90 and 120 min as compared to the controls. In livers stored cold for 24 hr in UW solution and perfused hypothermically, as compared to ones perfused normothermically, statistically higher hepatic-artery and portal-vein resistances (P<0.05) were observed throughout the perfusion period and 60 min after reperfusion, respectively. In addition, bile output and oxygen consumption of these livers were statistically lower than those of ones perfused normothermically (P<0.05). In contrast, chemistries of the perfusate of livers perfused hypothermically were comparable to ones perfused normothermically. Histologic examination of the liver perfused hypothermically demonstrated hepatic arterial and/or portal venous congestion and mild-to-moderate hemorrhage in the portal triads. This study suggests that livers preserved for a prolonged period of time demonstrate a high hepatic arterial resistance shortly after revascularization, and that recipient hypothermia after revascularization may be a risk factor for the development of hepatic arterial thrombosis following liver transplantation.
Recent introduction of University of Wisconsin solution now allows preservation of the hepatic graft safely for up to 24 hr (1). Nevertheless, little is known about the effect of prolonged cold storage on vascular resistance of the hepatic allograft. The purpose of this study was to identify the changes in the resistance of the graft hepatic artery and portal vein after revascularization and to evaluate the effect of hypothermia, a condition commonly encountered during liver transplantation procedures (2–4), on vascular resistance as well as on the viability of the hepatic graft.
MATERIALS AND METHODS
Organ harvesting
Outbred pigs weighing 17.3–30.0 kg (mean, 21.8 kg) were used for the experiment. The animals were anesthetized with 25 mg/kg of i.v. thiamylal and were given 100% oxygen via an endotracheal tube. Details of the techniques of allograft hepatectomy and the sanguinous perfusion system are described elsewhere (5). Briefly, livers were harvested from a total of 22 pigs. The livers were procured during in situ flushing with 2000 ml of lactated Ringer’s solution (4°C) via the portal vein at a pressure of approximately 60 cmH2O and then stored cold (4°C) after being flushed with the preservation solution studied. The cystic duct was ligated, and the common bile duct was cannulated with a 16-gauge catheter to monitor bile output.
Isolated perfusion
A total of 3000 ml of blood was obtained from two blood donor animals as well as from a liver donor. The hematocrit of the perfusate was adjusted to approximately 20% by dilution with lactated Ringer’s solution. One L/min of oxygen was administered through the oxygenator while the circuit was warmed by a heat exchanger to maintain a stable temperature (37 or 32°C). The pH of the perfusate was adjusted to 7.40 with the administration of sodium bicarbonate or carbon dioxide gas into the circuit. The livers were reperfused via the portal vein with a continuous flow and via the hepatic artery with a pulsatile flow. The total liver flow of 1 ml/min/g liver tissue was maintained for 3 hr. The flow was divided into 0.67 ml/min/g liver tissue through the portal vein and 0.33 ml/min/g liver tissue through the hepatic artery. The blood flow was measured using a Transonic full-flow illumination transit-time ultrasonic flowmeter, model T201 (Transonic Systems Inc., Ithaca, NY). The portal venous flow was maintained by adjusting the height of the upper reservoir, and the hepatic arterial flow was controlled by adjusting the stroke volume of the pulsatile pump. The pulse rate of the pulsatile pump was fixed at 70/min. The biliary cannula was externally drained to measure bile output. Blood samples were obtained at the end of every 30 min, and bile output was recorded for the full 30 min. Livers biopsied were obtained hourly for histologic evaluation of the graft. Glutamic-oxaloacetic transaminase (GOT),* glutamic-pyruvic transaminase (GPT), lactate dehydrogenase (LDH), and electrolytes were measured from the perfusate every 30 min. Hemolysis could be seen grossly in the perfusate samples but was not measured.
Oxygen consumption was calculated every 30 min according to the following formula:
where AO2 sat = oxygen saturation of the affluent (%); EO2 sat = oxygen saturation of the effluent (%); Hgb = hemoglobin of the perfusate (g/dl); FHA = hepatic arterial flow (ml/min); FPV = portal venous flow (ml/min).
The grafts were divided into 3 groups.
Group 1 (n=6)
Livers were preserved in lactated Ringer’s solution and perfused normothermically (37°C) for 3 hr following minimal cold preservation time (0.83–2.5 hr; mean, 1.4 hr).
Group 2 (n=8)
Livers were preserved cold for 24 hr in UW solution (4°C) and then perfused normothermically (37°C).
Group 3 (n=8)
Livers were preserved cold for 24 hr in UW solution (4°C) and then perfused hypothermically (32°C).
In groups 2 and 3, UW solution was flushed out just prior to sanguinous reperfusion with 500 ml of lactated Ringer’s solution at a pressure of approximately 60 cm H2O.
The Student’s t test was used for the statistical evaluation.
RESULTS
Table 1 lists the preservation time and the perfusate temperature in each group.
Table 1.
Preservation time and perfusion temperature
| Group | Preservation time (hr) | Perfusion temperature (°C) |
|---|---|---|
| 1 (n=6) | 1.4±0.53a | 36.9±0.2 |
| 2 (n=8) | 24.0±0.4 | 37.1±0.3 |
| 3 (n=8) | 23.9±0.3 | 32.4±0.42 |
Mean ± SD.
Hepatic arterial resistance (Fig. 1)
Figure 1.
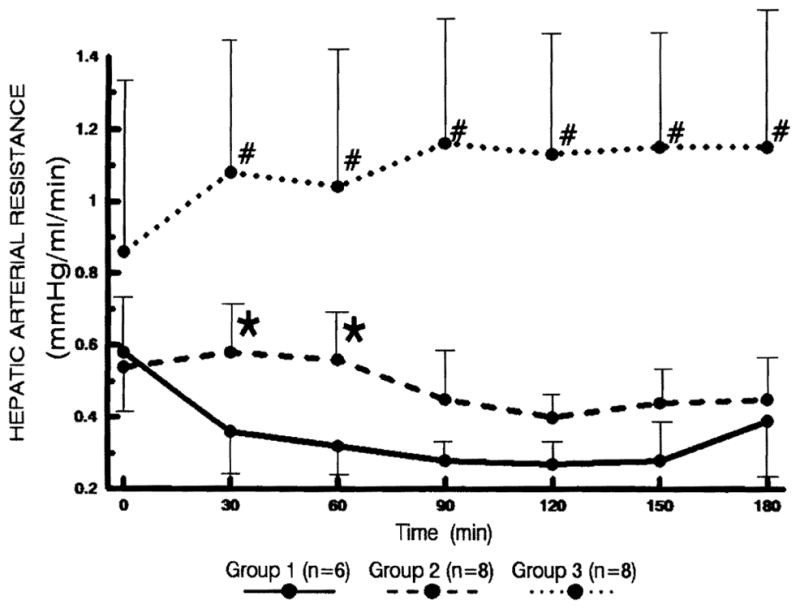
Changes in the hepatic arterial resistance. Statistical significance was achieved between groups 1 and 2 (* P<0.05) as well as between groups 2 and 3 (# P<0.05).
In group 1, the arterial resistance showed a rapid reduction and remained low thereafter, while the resistance began to increase slightly after 150 min. In group 2, the arterial resistance remained unchanged for the first 60 min and then started to decrease thereafter. In group 3, the arterial resistance was significantly higher than that of group 2 after the initial measurement (P<0.05).
Portal venous resistance (Fig. 2)
Figure 2.
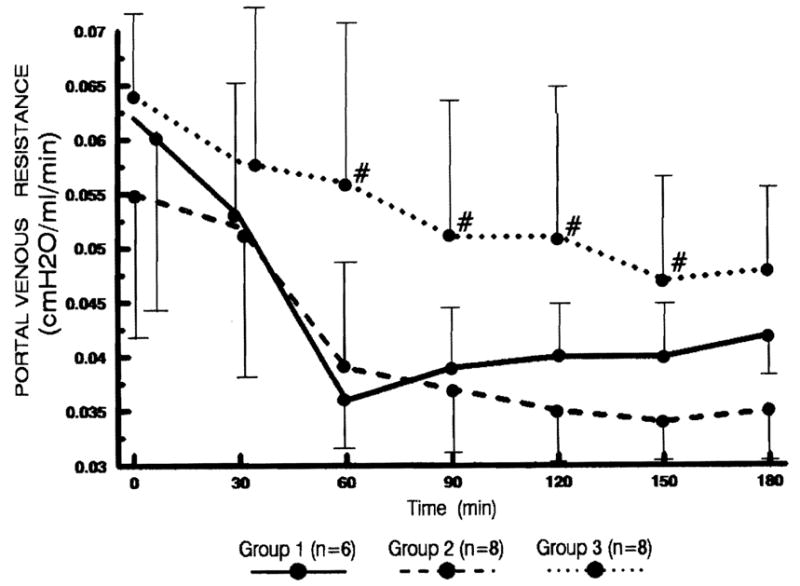
Changes in portal venous resistance. Statistical significance was achieved between groups 2 and 3 (# P<0.05).
In groups 1 and 2, the changes in the portal venous resistance were similar; the resistance declined rapidly during the first 60 min. In group 3, the portal venous resistance decreased much slower than that of group 2 (P<0.05 at 60, 90, 120, and 150 min).
Bile flow (Fig. 3)
Figure 3.
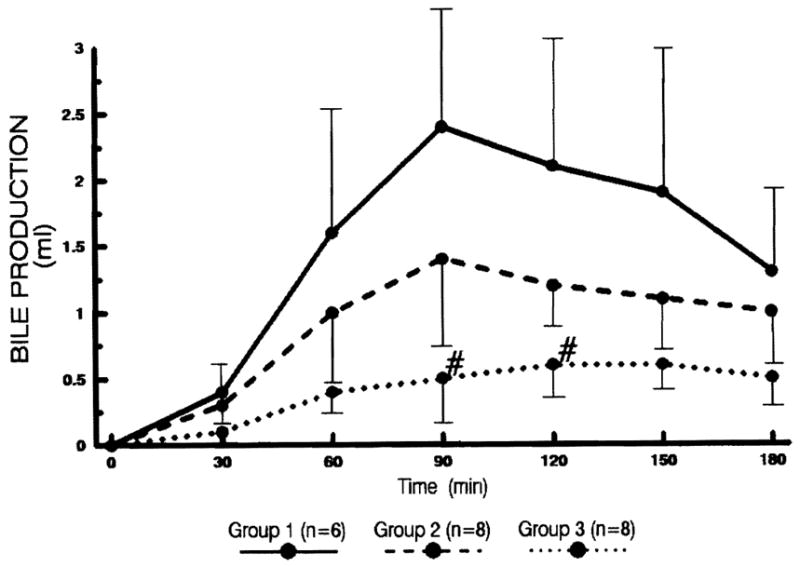
The amount of bile production every 30 min after sanguinous reperfusion. Statistical significance was achieved between groups 2 and 3 (# P<0.05).
Livers in groups 1 and 2 commenced to produce thick, yellowish bile within 30 min after reperfusion, while the output was lower among the livers in group 2. The bile production of the livers in groups 1 and 2 peaked at 90 min and decreased thereafter. The bile output of the livers in group 3 was significantly lower than that of group 2 (P<0.05 at 90 and 120 min). Most of the livers in group 3 produced thin and watery bile.
Oxygen consumption (Fig. 4)
Figure 4.
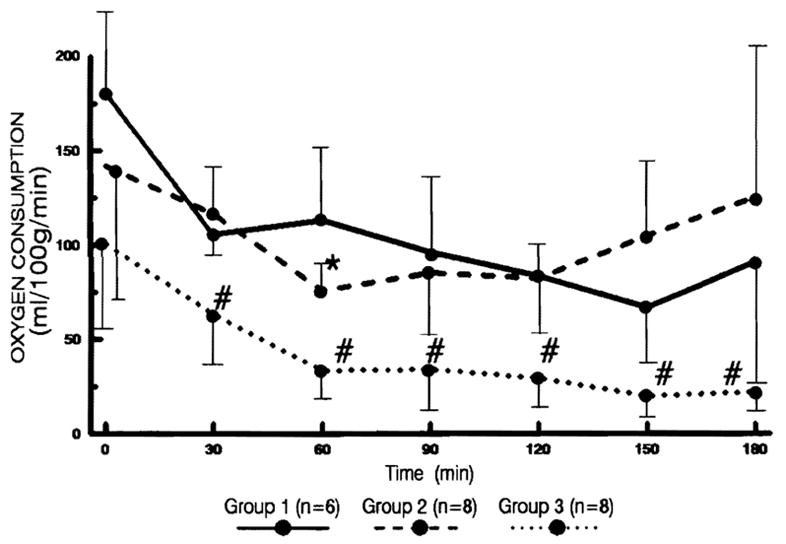
The changes in oxygen consumption per gram of liver tissue every 30 min after reperfusion. Statistical significance was achieved between groups 1 and 2 (* P<0.05) as well as between groups 2 and 3 (# P<0.05).
Although changes in oxygen consumption were similar in each group, the livers in group 3 consumed significantly less oxygen per gram of liver tissue than did groups 1 or 2 (P<0.05).
Liver weight
As shown in Table 2, the liver weight of each group increased significantly after the perfusion. However, the degree of weight gain was comparable in all groups.
Table 2.
Changes in liver weight after revascularization
| Group | Liver weight (g) |
Weight gain (%) | |
|---|---|---|---|
| Preperfusion | Postperfusion | ||
| 1 (n=6) | 558.3±63.6a | 761.5±106.9 | 36.4±0.5 |
| 2 (n=8) | 511.3±67.4 | 681.3±107.3 | 33.2±0.3 |
| 3 (n=8) | 526.3±113.5 | 671.3±106.7 | 27.6±2.7 |
Mean ± SD.
Perfusate GOT level (Fig. 5)
Figure 5.
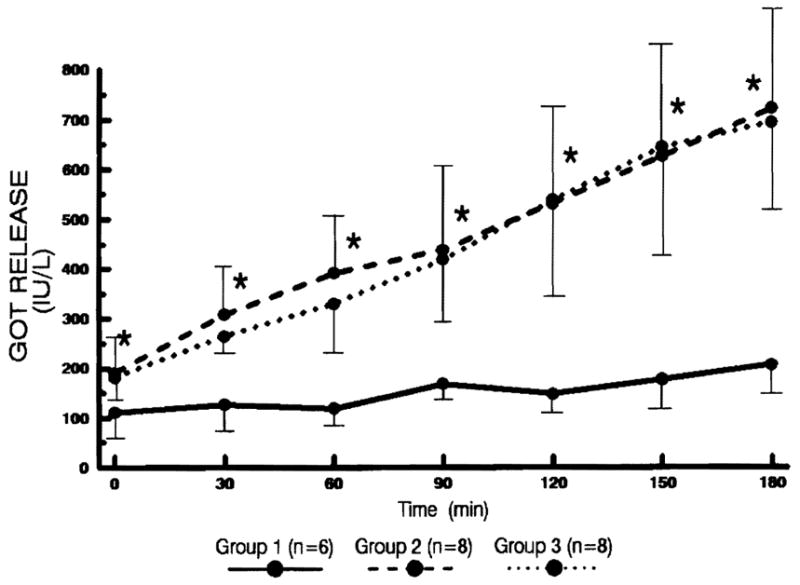
The changes of GOT levels in the perfusate every 30 min after reperfusion. Statistical significance was achieved between groups 1 and 2 (* P<0.05).
The GOT level increased steadily in groups 2 and 3, which were comparable. In group 1, the increase was minimal and achieved statistically significant difference from group 2 (P<0.05).
Perfusate LDH level (Fig. 6)
Figure 6.
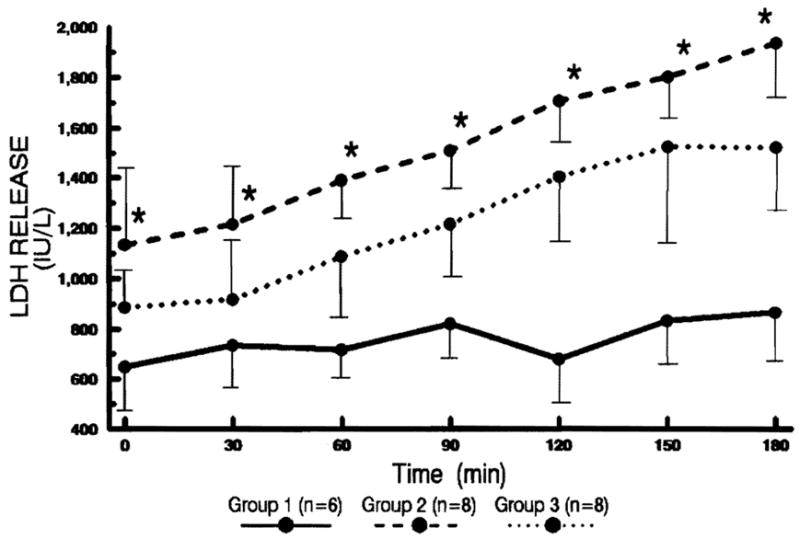
The changes of LDH levels in the perfusate every 30 min after reperfusion. Statistical significance was achieved between groups 1 and 2 (* P<0.05).
The change was similar to that of GOT. The LDH release was most pronounced in group 2.
There were no significant changes in GPT, bilirubin, acid phosphatase, and electrolytes of the perfusate in each group.
Histologic examination
Livers in group 1 exhibited mild periportal sinusoidal congestion, scattered hepatocellular necrosis, and diffuse microvesicular steatosis at 2–3 hr after reperfusion. Just prior to reperfusion, the histologic features of the livers in groups 2 and 3 were similar to that of group 1. Two to 3 hr after reperfusion, the livers in group 2 exhibited worsening microvesicular steatosis and periportal sinusoidal congestion with scattered hepatocellular necrosis. In group 3, 5 of 8 livers demonstrated hepatic arterial and/or portal venous congestion as well as mild-to-moderate hemorrhage in the portal triads (Fig. 7). Although microvesicular steatosis and mild scattered hepatocellular necrosis were also observed, histologic changes were pronounced in the portal triads contrary to the other two groups.
Figure 7.

Sections from a liver in group 3 at 120 min after reperfusion. A. Hemorrhage in the portal tracts and portal to portal areas is seen. No hepatocellular necrosis is observed (H&E; original magnification ×4). B. High magnification demonstrates hemorrhage in the portal tract as well as congestion of the portal vein and the hepatic artery (arrows) (H&E; original magnification ×100).
DISCUSSION
This liver perfusion system in large animals allowed reproducible evaluation of various biochemical and hemodynamic changes associated with revascularization of the liver. During normothermic sanguinous reperfusion, livers stored cold for 24 hr in UW solution exhibited higher hepatic arterial resistance as compared to the control. The bile production has been known as a sensitive indicator of the viability of the liver (6–9), which tended to be lower in the livers preserved 24 hr in UW solution. On the other hand, portal vein resistance and oxygen consumption were comparable between the two groups. Although perfusate hemolysis was always present, this was time related, and since the reperfusions were of equal duration in all the groups hemolysis was an unlikely explanation for the differences between groups.
Hypothermia is a commonly encountered phenomenon during liver transplantation, especially in children. Rapid reduction of the body temperature takes place soon after revascularization (2–4). In our study, livers perfused at 32°C exhibited higher hepatic arterial and portal venous resistances.
As to the cause of increased hepatic arterial and portal venous resistance in hypothermic perfusion of the liver, Adams et al. (10) demonstrated in dogs that the liver in hypothermia increased its size and contained excessive blood. They speculated that this might reflect redistribution of blood from the extremities to the splanchnic beds. In our study, most of the livers perfused hypothermically exhibited swelling during perfusion. However, the weight of the liver graft was not any heavier than that of livers perfused normothermically. Histologic examination of the livers perfused hypothermically, on the other hand, exhibited hepatic arterial and/or portal venous congestion. These findings seem to indicate that congestion of the blood in the sinusoids rather than cellular edema is responsible for the swelling of the graft. In the hypothermic state, hemoconcentration and increase in the viscosity of blood take place in the peripheral blood (11, 12). These variables might have played a role in the congestion of the liver.
As to the functional alteration of the liver in hypothermia, Brokaw, and Penrod (13) demonstrated a 75 % increase in bromsulfophthalein retention in dogs that were cooled to 23°C as compared with 37°C. Kalser et al. (14, 15) observed reduced metabolic and excretory function of the liver during hypothermia (25°C and 17°C) with the use of C14-atropine in the perfused rat liver. Brauer et al. (16) demonstrated that bile production ceases at approximately 25°C and is maximal between 38 and 40°C in the isolated rat liver. Teramoto et al. (17) reported that arteriovenous O2 difference decreases 36% at 29°C in dogs. Thus, liver function seems to be diminished quantitatively during hypothermia. In the livers perfused cold, the bile production and the oxygen consumption were less than 30 and 50% of those perfused normothermically, respectively. On the other hand, intracellular enzymes (GOT and LDH) in the perfusate were comparable to those perfused normothermically after 24 hr of cold storage. Furthermore, their histologic findings exhibited no significant pathologic damage in the hepatic parenchyma.
Hypothermic sanguinous perfusion of the liver may therefore be associated with diminished function but without parenchymal injuries to the liver.
The high hepatic arterial resistance in the livers preserved cold for 24 hr and perfused hypothermically seems to indicate that hypothermia after revascularization of the hepatic graft may be a contributing factor to the development of hepatic arterial thrombosis following liver transplantation, especially after prolonged preservation.
Footnotes
This work was supported by research grants from the Veterans Administration and Project Grant No. AM29961 from the National Institute of Health, Bethesda, Maryland.
Abbreviations: GOT, glutamic-oxaloacetic transaminase; GPT, glutamic-pyruvic transaminase; LDH, lactate dehydrogenase.
References
- 1.Todo S, Nery J, Yanaga K, Podesta L, Gordon RD, Starzl TE. Extended preservation of human liver allografts with U.W. solution. JAMA. 1989;261:711. [PMC free article] [PubMed] [Google Scholar]
- 2.Aldrete JA, Clapp HW, Starzl TE. Body temperature changes during organ transplantation. Anesth Analg. 1970;49:384. doi: 10.1213/00000539-197005000-00016. [DOI] [PMC free article] [PubMed] [Google Scholar]
- 3.Zadrobilek E, Mauritz W, Wensl FE, Sporn P. Hemodynamic and metabolic changes during liver transplantation. Anaesthesist. 1988;37:672. [PubMed] [Google Scholar]
- 4.Borland LM, Rouke M, Cook R. Anesthesia for pediatric orthotopic liver transplantation. Anesth Analg. 1985;64:117. [PubMed] [Google Scholar]
- 5.Yanaga K, Makowka L, Lebeau G, et al. A new liver perfusion and preservation system for transplantation research in large animals. J Invest Surg. 1990;3:65. doi: 10.3109/08941939009140337. [DOI] [PMC free article] [PubMed] [Google Scholar]
- 6.Vladovic-Relja T. Some functional parameters in the isolated calf liver after hypothermic preservation. Cryobiology. 1984;21:511. doi: 10.1016/0011-2240(84)90049-x. [DOI] [PubMed] [Google Scholar]
- 7.Bowers BA, Branum GD, Rotolo FS, Watters CR, Meyers WC. Bile flow—an index of ischemic injury. J Surg Res. 1987;42:565. doi: 10.1016/0022-4804(87)90033-3. [DOI] [PubMed] [Google Scholar]
- 8.Kamiike W, Nakahara M, Nakao K, et al. Correlation between cellular ATP level and bile excretion in the rat liver. Transplantation. 1985;39:50. doi: 10.1097/00007890-198501000-00005. [DOI] [PubMed] [Google Scholar]
- 9.Jamieson NV, Sumdberg R, Lindell S, Southard JH, Belzer FO. A comparison of cold storage solutions for hepatic preservation using the isolated perfused rabbit liver. Cryobiology. 1988;25:300. doi: 10.1016/0011-2240(88)90038-7. [DOI] [PubMed] [Google Scholar]
- 10.Adams-Ray J, Hagberg S, Hjelmstrom P. The liver volume in hypothermia followed by rapid heating in the dog. Acta Clin Scand. 1955;109:261. [PubMed] [Google Scholar]
- 11.Eiseman B, Spencer FC. Effect of hypothermia on the flow characteristics of blood. Surgery. 1962;52:532. [Google Scholar]
- 12.Lynch HF, Adolf EF. Blood flow in small blood vessels during deep hypothermia. J Appl Physiol. 1957;11:192. doi: 10.1152/jappl.1957.11.2.192. [DOI] [PubMed] [Google Scholar]
- 13.Brokaw R, Penrod KE. Bromsulphalein removal rates during hypothermia in the dog. Am J Physiol. 1945;159:356. doi: 10.1152/ajplegacy.1949.159.2.365. [DOI] [PubMed] [Google Scholar]
- 14.Kalser SC, Kelvington EJ, Randolph MM, Santomenna DM. Drug metabolism in hypothermia: I. Biliary excretion of C14-atropine metabolism in the intact and nephrectomized rat. J Pharmacol Exp Ther. 1965;147:252. [PubMed] [Google Scholar]
- 15.Kalser SC, Kelvington EJ, Randolph MM, Santomenna DM. Drug metabolism in hypothermia: II. C14-atropine uptake metabolism and excretion by the isolated perfused rat liver. J Pharmacol Exp Ther. 1965;147:260. [PubMed] [Google Scholar]
- 16.Brauer RW, Leong GF, Holloway RJ. Mechanics of bile secretion: effect of perfusion pressure and temperature on bile flow and bile secretion pressure. Am J Physiol. 1954;177:103. doi: 10.1152/ajplegacy.1954.177.1.103. [DOI] [PubMed] [Google Scholar]
- 17.Teramoto S, Shumacker HB. Hepatic blood flow in the moderately hypothermic state. J Surg Res. 1962;11:3. doi: 10.1016/s0022-4804(62)80023-7. [DOI] [PubMed] [Google Scholar]