

Abstract
The ribosomal L1 stalk is a mobile structure implicated in directing tRNA movement during translocation through the ribosome. This article investigates three aspects of L1 stalk:tRNA interaction. First, by combining through the molecular dynamics flexible fitting method data from cryo-electron microscopy, X-ray crystallography, and molecular dynamics simulations, atomic models of different tRNAs occupying the hybrid P/E state interacting with the L1 stalk are obtained. These models confirm the assignment of FRET states from previous single-molecule investigations of L1 stalk dynamics. Second, the models reconcile how initiator tRNAfMet interacts less strongly with the L1 stalk than elongator tRNAPhe, as seen in previous single-molecule experiments. Third, results from a simulation of the entire ribosome in which the L1 stalk is moved from a half-closed to its open conformation are found to support the hypothesis that L1 stalk opening is involved in tRNA release from the ribosome.
Keywords: translocation, modified ribonucleosides, flexible fitting, MDFF, FRET
Introduction
Proteins are synthesized by the ribosome, a universal molecular machine present in all cells consisting of a large and a small subunit (50S and 30S in bacteria, respectively). The ribosome contains around 50 proteins and three ribosomal RNAs (rRNAs), namely 16S, 5S, and 23S in bacteria. Transfer RNAs (tRNAs) deliver amino acids and have to travel through three main binding sites in the ribosome labeled A, P, and E (A = aminoacyl-tRNA; P = peptidyl-tRNA; E = exit). The tRNAs and, accordingly, the A, P, and E sites span both 50S and 30S subunits. Early chemical probing experiments demonstrated that tRNAs occupy hybrid binding configurations, in which the acceptor stem moves to the next binding site on the 50S before the anticodon-stem loop (ASL) moves in the 30S1. For example, a P/E tRNA has its ASL bound to the 30S P site while the acceptor stem is bound to the 50S E site. After peptide bond formation, which results in a deacylated P-site tRNA and a peptidyl A-site tRNA, a dynamic equilibrium is established, as discovered by single-molecule fluorescence resonance energy transfer (smFRET) studies2, in which tRNAs fluctuate between classical (A/A-P/P) and hybrid (A/P-P/E) states. The pretranslocation ribosome complex, formed directly after peptidyl transfer, also exhibits fluctuations between two states, which differ by a relative intersubunit rotation3,4,5. Elongation factor G (EF-G) binds to the pretranslocation complex and stabilizes the rotated state that contains hybrid A/P-P/E tRNAs6,7,8,3. GTP hydrolysis by EF-G promotes then translocation of the messenger RNA (mRNA) by one codon, resulting in the posttranslocation complex, i.e, a nonrotated ribosome with classical P/P-E/E tRNAs9.
The L1 stalk is a flexible protuberance of the ribosome composed of ribosomal protein L1 and helices 76–78 of the 23S rRNA. There are at least three main conformations of the L1 stalk that correlate with tRNA and intersubunit rotation states during translocation: open stalk (vacant E site, nonrotated ribosome), half-closed stalk (E/E tRNA, posttranslocation nonrotated ribosome), and fully closed stalk (P/E tRNA, pretranslocation rotated ribosome)10,11. Analysis of atomic models derived from cryo-electron microscopy (cryo-EM) data shows that two rotation angles account for the major part of the L1 stalk motion (Fig. 1). In the pretranslocation complex, an interaction between the L1 stalk and the P-site tRNA is reversibly established and disrupted12, and the L1 stalk fluctuates between the open and closed states11. In posttranslocation complexes (with an E/E tRNA), the L1 stalk has been described as either static11 or dynamic13; it was suggested that the difference is due to different experimental approaches used to populate the E site13. A question currently under debate in the literature is whether the movements of tRNAs, L1 stalk, and ribosomal subunits occur in a stochastic or correlated manner12,13,11,14,15.
Fig. 1.
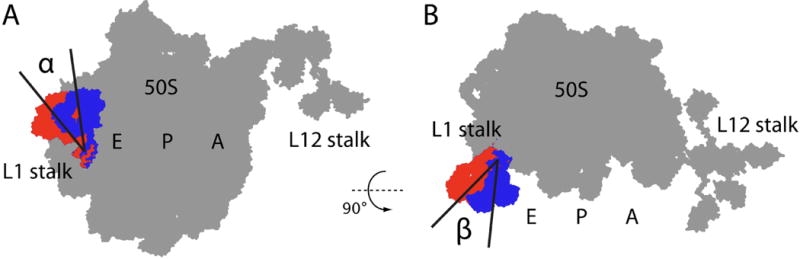
Schematic illustrating two rotation angles (α and β) that account for most of the observed motion of the L1 stalk as seen in cryo-EM-derived atomic models (see Table 4). Two conformations of the L1 stalk are shown (blue = closed; red = open). See Materials and Methods for details on how α and β were calculated.
The importance of the L1 stalk for ribosome function is reflected in the observations that mutant ribosomes depleted of the L1 protein show a reduced rate of protein synthesis16 and a destabilization of the tRNA hybrid states17. Real-time smFRET experiments showed that the interaction between the L1 stalk and the tRNA persists throughout the translocation step, further suggesting an important role for the L1 stalk in assisting tRNA translocation12.
Initiator tRNAfMet (see Fig. 2B), which delivers the first amino acid to the bacterial ribosome18, translocates from the P to the E site slower than elongator tRNAs19,20. A P-site initiator tRNAfMet exhibits a modest to pronounced preference for the classical P/P over the hybrid P/E state, and shifts the thermodynamic equilibrium toward nonrotated subunits8,3 and open L1 stalk3,13 as compared to the elongator tRNAs investiged. Regarding the kinetics of L1 stalk closure and L1 stalk:tRNA interaction, the major differences between tRNAfMet and tRNAPhe are seen for L1 stalk opening and disruption of L1 stalk:tRNA interaction, which occur on a faster time scale for tRNAfMet than for tRNAPhe 13, the faster disruption of L1 stalk:tRNA interaction being presumably due to a lower affinity between P/E tRNAfMet and L1 stalk.
Fig. 2.

RNA modifications highlighted on the (A) tRNAPhe and (B) tRNAfMet structures used in this study. The conformations shown correspond to the last frame of 60-ns MD simulation trajectories of tRNAs in the hybrid P/E state. On the right, secondary structure diagrams for each tRNA are given. Symbols for RNA modifications68: s4U = 4-thiouridine; D = dihydrouridine; Ψ = pseudouridine; ms2i6A = 2-methylthio-N6-isopentenyladenosine; m7G = 7-methylguanosine; acp3U = 3-(3-amino-3-carboxypropyl)uridine; T = thymine; Cm = 2′-O-methylcytidine.
To explain the lower affinity between the L1 stalk and tRNAfMet compared to the elongator tRNAs that have been investigated, we compared structural and dynamical properties of the complex formed between the L1 stalk and P/E tRNAfMet or tRNAPhe. We first obtained atomic models of a ratcheted ribosome with a P/E initiator tRNAfMet or elongator tRNAPhe by applying the molecular dynamics flexible fitting (MDFF)21,22 method to a cryo-EM reconstruction of an EF-G-stabilized ratcheted ribosome7. By employing molecular dynamics (MD) simulations, we analyzed structural and dynamical differences of tRNAs and their interactions with the L1 stalk. Our simulations show that P/E tRNAfMet, when compared to P/E tRNAPhe, binds deeper into the 30S P site, undergoes larger fluctuations in the elbow region and interacts less strongly with the L1 stalk. Consistent with the weaker interaction, correlation-based network analysis of the trajectories suggests that the movement of the hybrid tRNAfMet is less coupled to the L1 stalk motion than is tRNAPhe. We also show evidence that domain II of ribosomal protein L1 can move independently from the rest of the stalk. Cryo-EM-derived ribosome models and MD simulations provide structural support for the assignment of states involving L1 stalk motion from previous smFRET experiments. Finally, we tested the hypothesis that L1 stalk opening induces the release of tRNAs from the E site by simulating a model of a complete ribosome in which the L1 stalk was moved from a half-closed to an open conformation. L1 stalk movement indeed induced movement of the E-site tRNA, supporting the hypothesis that L1 stalk dynamics is involved in tRNA release.
Results and Discussion
Structural differences between tRNAPhe and tRNAfMet in the P/E state
Atomic models of an E. coli ratcheted ribosome with a fully closed L1 stalk and a P/E tRNA were obtained by applying the MDFF method21,22 to a cryo-EM reconstruction of a pretranslocation ribosome complex stabilized by EF-G and GDPNP, a non-hydrolyzable GTP analogue7 (Fig. 3A; see Materials and Methods for details). Two independent models were constructed containing either tRNAfMet or tRNAPhe in the P/E site employing a cryo-EM reconstruction that actually contained tRNAIle. MD simulations were then performed on reduced systems, shown in Figure 3B, encompassing the P/E tRNA and the L1 stalk, as well as the surrounding ribosomal elements. For each tRNA, simulations were performed with or without naturally occurring modifications of its ribonucleosides, the latter listed in Figure 2. For comparison, an MD simulation of a full posttranslocation ribosome containing P/P and E/E tRNAPhe with modified ribonucleosides was also performed. Table 1 lists the MD simulations presented in the current study. The conformations of P/P, P/E, and E/E tRNAPhe, as seen in the MD simulations, are compared in Figure S1.
Fig. 3.

Simulated system. (A) Atomic model of the ribosome containing a hybrid P/E tRNA, obtained by flexibly fitting atomic structures into a cryo-EM reconstruction using MDFF (see Materials and Methods). (B) Simulated subsystem representing a P/E tRNA interacting with the L1 stalk. The simulated system is shown in color with the rest of the ribosome structure shown in light gray for reference. 50S = cyan; 30S = yellow; P/E tRNA = red; mRNA = black.
Table 1.
List of MD simulations presented in this work.
| Simulation description | RNA modifications | System size (atoms) | Duration (ns) |
|---|---|---|---|
| Subsystem with P/E tRNAPhe + L1 stalk | no | 335,720 | 60 |
| Subsystem with P/E tRNAPhe + L1 stalk | yes | 335,522 | 60 |
| Subsystem with P/E tRNAfMet + L1 stalk | no | 340,500 | 60 |
| Subsystem with P/E tRNAfMet + L1 stalk | yes | 340,248 | 60 |
| Full ribosome with P/P and E/E tRNAPhe | yes | 2,926,193 | 80 |
| Full ribosome with EF-Tu, A/T, P/P, and E/E tRNAPhe, pulling L1 stalk open | yes | 2,934,851 | 2 + 3 |
The conformations and orientations of P/E tRNAPhe and tRNAfMet inside the ribosome are remarkably different. Even though the initial model for either tRNA was obtained from the same cryo-EM map, the structures relaxed differently during MD simulations. P/E tRNAfMet was seen to bind deeper into the 30S P site, with its anticodon-stem loop (ASL) positioned 5 Å closer to the small subunit (Fig. 4A). The conformation of P/E tRNAfMet is also found to be distinct from that of tRNAPhe. The average angle γ formed between the two arms of P/E tRNAfMet (98°), over the last 20 ns of simulation, is significantly larger than in case of P/E (78°), P/P (80°), or E/E (81°) tRNAPhe (Fig. 4B–D). The functional significance of the angle γ is unclear. However, it is clear that the higher γ value exhibited by P/E tRNAfMet allows its ASL to bind deeper into the 30S P site (Fig. 4A).
Fig. 4.
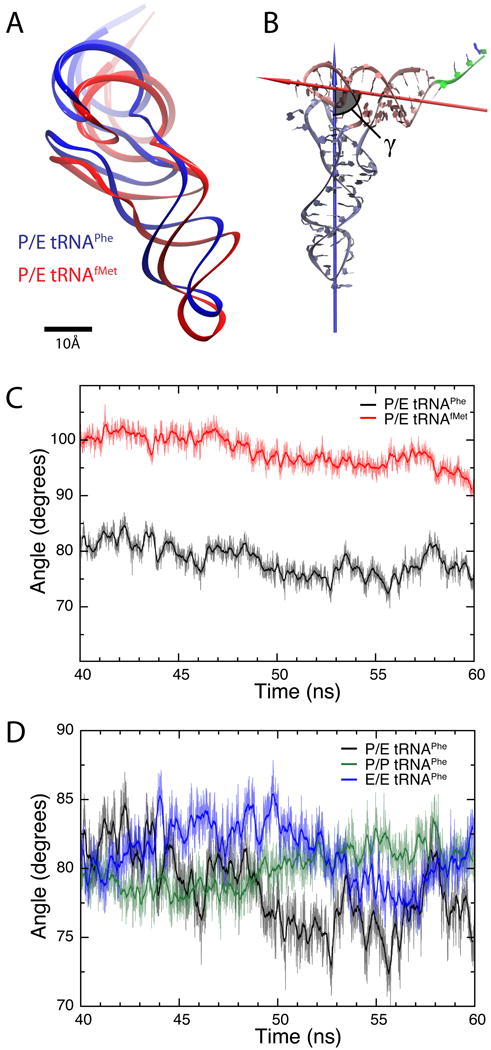
Structure of tRNAs inside the ribosome. (A) Relative position of P/E tRNAPhe (blue) and P/E tRNAfMet (red), calculated as an average from the last 20 ns of each MD simulation (all modified ribonucleosides included). (B) Definition of the angle γ formed between the two arms of the tRNA. One arm consists of the anticodon-stem loop, D loop and variable loop (ice blue), while the other is comprised of the acceptor stem and T loop (pink). The arrows show the principal axes of inertia corresponding to the smallest moments of inertia for each of the two arms. The residues in the single strand at the 3′ terminus (green) were not taken into account in the analysis. (C) Angle γ calculated for the last 20 ns for the simulation of P/E tRNAPhe (black) and P/E tRNAfMet (red). The thick lines show running averages with a 100-ps window. (D) Angle γ calculated for the last 20 ns for the simulations containing tRNAPhe in classical P/P (green) and E/E (blue) as well as hybrid P/E (black) states. The thick lines show corresponding running averages with a 100-ps window.
The angle γ formed between the two arms of tRNA (Fig. 4B) depends on ribonucleoside modifications. In particular, for the fully modified P/E tRNAPhe an average angle of 78° is observed, while in the unmodified structure this angle is 95°. Interestingly, P/E tRNAfMet shows the opposite behavior, an average angle of 98° versus 83° for the modified and unmodified structure, respectively.
Flexibility of tRNAs inside the ribosome
It is to be expected that the observed structural differences between tRNAPhe and tRNAfMet are accompanied by different flexibilities of the tRNAs. The flexibility of tRNAs is characterized through their per-residue root mean square fluctuations (Fig. 5). We first analyzed the effect of the ribonucleoside modifications listed in Figure 2. For P/E tRNAPhe, the modifications render the D and T loops stiffer (Fig. 5A), whereas the opposite is seen for P/E tRNAfMet (Fig. 5B). These loops make up the elbow region that interacts with the 23S rRNA, as shown in Figure 6. Interestingly, one part of the D loop, the region between residues 21 to 27, in P/E tRNAPhe is more flexible when RNA modifications are included, even though there are no modified ribonucleosides in this region; however, RNA modifications do occur in regions spatially close to residue 21 (see Fig. 2).
Fig. 5.

Per-residue root mean square fluctuations (RMSFs) for the individual tRNAs obtained from the last 20 ns of each trajectory. Panels A and B compare non-modified (black) with fully modified (red) P/E tRNAPhe and P/E tRNAfMet. Panel C compares modified P/E tRNAPhe (black) and P/E tRNAfMet (red). The blue triangle indicates the insertion within tRNAfMet with respect to tRNAPhe. Panel D shows a comparison of the RMSFs for the fully modified tRNAPhe in the P/E (black), P/P (red), and E/E (blue) states.
Fig. 6.
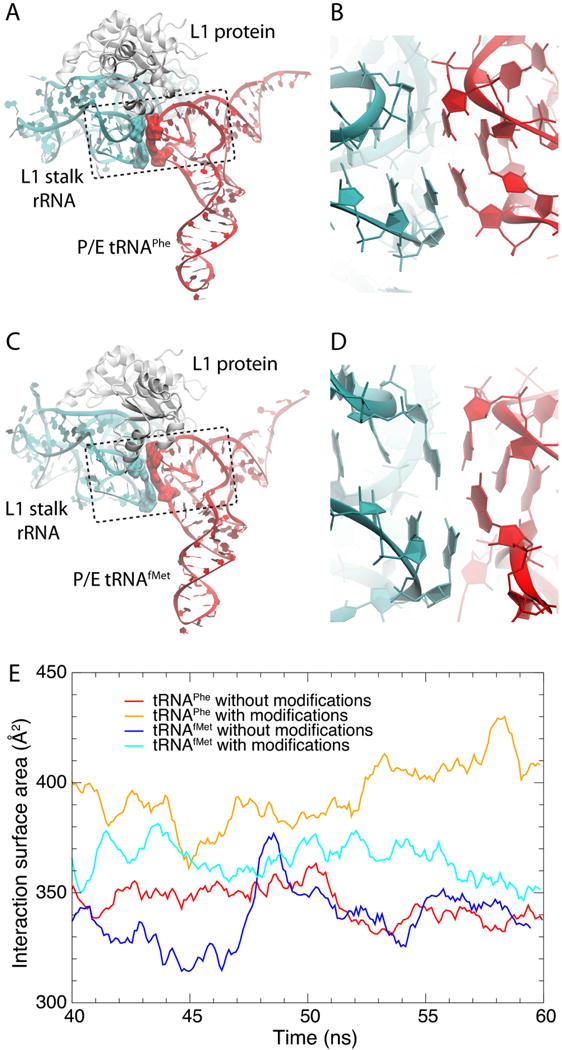
Stacking between P/E tRNA and L1 stalk bases. The figure shows structures obtained after 60 ns of MD simulations of (A, B) tRNAPhe and (C, D) tRNAfMet at the hybrid P/E site interacting with the L1 stalk. All RNA modifications were adopted in the simulations. Highlighted in surface representations are RNA residues involved in stacking interactions between the L1 stalk (G2112–A2169) and tRNA (G19–C56). The dashed boxes represent structural elements formed by sets of residues from both the L1 stalk (helix 77) and the tRNA's elbow involved in a series of stacking interactions. (E) Interaction surface area for residues involved in stacking interactions between tRNA and L1 stalk. Data calculated from the last 20 ns of each trajectory considering every 2 ps and applying a running average with a window size of 20 ps.
As described above, ribonucleoside modifications have opposite effects on the overall tRNA structure in case of P/E tRNAPhe and tRNAfMet: the angle γ between the two tRNA arms decreases for tRNAPhe, but increases for tRNAfMet, when the tRNAs are modified. Interestingly, RNA modifications also have opposite effects on the residue-level flexibility of P/E tRNAPhe and tRNAfMet. In case of tRNAPhe, modifications decrease the flexibility of the D and T loops, while these loops are rendered more dynamic when tRNAfMet is modified. These observations show that ribonucleoside modifications can serve different roles for different tRNA molecules, increasing or decreasing flexibility of key regions that interact with the ribosome, and inducing either more or less compactness of the overall tRNA structure.
Figure 5C compares the internal fluctuations of P/E tRNAPhe and P/E tRNAfMet, both with RNA modifications. The D and T loops, which contact the 23S rRNA, are clearly more flexible in tRNAfMet than in tRNAPhe, which correlates well with a smaller interaction surface between the L1 stalk and P/E tRNAfMet (see Fig. 6E). Furthermore, the entire ASL is far more rigid in tRNAfMet(see Fig. 5C), which may be important for preventing frameshifting during initiation of protein synthesis. We note that tRNAfMet is the only tRNA that is not delivered to the ribosome by EF-Tu, and thus does not have to occupy the A/T state in which the ASL (residues 27–43) is largely distorted23,24. For this reason, there was possibly no evolutionary pressure for a flexible ASL in tRNAfMet compared to elongator tRNAs.
Figure 5D compares the flexibility of P/P, P/E, and E/E tRNAPhe, all including the RNA modifications. The ASL is clearly more flexible in the hybrid P/E state when compared to the classical P/P or E/E states. The D and T stems show more fluctuations in P/E and E/E versus P/P, which indicates that interaction with the L1 stalk leads to additional fluctuations in the elbow region. Also of note is that the acceptor stems of P/E and E/E tRNAPhe show similar flexibilities, which are larger than for P/P tRNAPhe. Presumably base-pairing interactions between the 3′ cytosine-cytosine-adenine (CCA) tail of tRNAPhe at the P site and the 23S P-loop restrict the internal fluctuations more than the stacking interactions between E-site CCA and the 23S rRNA.
Structural and dynamical differences of L1 stalk:tRNA complexes explain smFRET results
According to smFRET experiments, P/E tRNAfMet interacts less strongly with the L1 stalk than elongator tRNAPhe does13. In order to explain the experimental observations, we analyzed structural and dynamical aspects of L1 stalk:tRNA complexes through MD simulations. First, we found that the P/E tRNA engages in stacking interactions with the L1 stalk, similar to those reported earlier25 for a classical E/E tRNA (but we note that in several structures of the ribosome with an E/E tRNA this stacking interaction is absent). Specifically, the tRNA's G19–C56 base pair (E. coli numbering is used throughout this paper) interacts with 23S rRNA's G2112–A2169. This stacking interaction joins tRNA's elbow and helix 77 of the 23S rRNA into one structural unit (Fig. 6A,C). Our findings confirm a suggestion, based on smFRET data, that the contact between the L1 stalk and tRNAs is similar for P/E and E/E tRNAs12. Interestingly, mutations in the strictly conserved G18–Ψ55 base pair (adjacent to G19–C56) lead to an 80-fold reduction in the rate of translocation26, indicating that the stated stacking interaction is functionally important. Figure 6E shows that the interaction between tRNA's elbow and the L1 stalk is weaker in tRNAfMet versus tRNAPhe. This finding is consistent with the observed higher rate of L1 stalk opening and disruption of L1 stalk:tRNA interaction in the tRNAfMet case13. Furthermore, the RNA modifications increase the 23S:tRNA stacking for both tRNAPhe and tRNAfMet (Fig. 6E), although the effect is much stronger for tRNAPhe than for tRNAfMet.
The L1 protein contains several basic residues at its surface near the P/E tRNA. Throughout the 60-ns simulations, direct interactions between these positively charged L1 residues and the negatively charged tRNA backbone (“salt bridges”) are maintained (Fig. S2). During the last 20 ns, the average number of salt bridges for P/E tRNAPhe was 3.2, versus 2.7 for tRNAfMet. The difference in the average number of salt bridges, albeit small, is consistent with a stronger interaction between the L1 stalk and P/E tRNAPhe versus P/E tRNAfMet, which helps explain the higher rate of L1 stalk opening and disruption of L1 stalk:tRNA interaction for tRNAfMet seen in smFRET experiments13.
During the simulation containing fully modified P/E tRNAPhe, the universally conserved noncanonical 23S base pair U1851–G1891 breaks and U1851 flips out of helix 68 (H68), interacting with G70 in the tRNA (Fig. 7). Since stronger interactions with the L1 stalk position the P/E tRNA closer to H68, interactions between the P/E tRNA and both H68 and the L1 stalk may jointly stabilize the hybrid state. The interaction with H68 is not observed in the fully modified P/E tRNAfMet simulation, even though it also contains G70. However, more sampling will be required to fully characterize differences in interaction between H68 and P/E tRNAPhe versus tRNAfMet. Interestingly, mutating C1–A72 to G1–C72 in tRNAfMet, in an attempt to recover an elongator tRNA phenotype, significantly slows the disruption of the L1 stalk:tRNA interaction (Fei and Gonzalez Jr., personal communication). We suggest that this mutation has an indirect effect on the interaction between acceptor stem and H68.
Fig. 7.
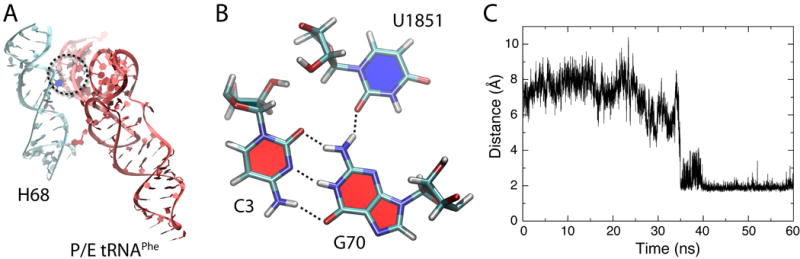
Interaction between U1851 (23S rRNA) and G70 (tRNA), observed in the fully modified P/E tRNAPhe simulation. (A) Part of helix 68 is shown, with a dashed circle highlighting the interaction with P/E tRNAPhe. (B) C3-G70-U1851 base triple is represented in detail. (C) Distance corresponding to the hydrogen bond between U1851 and G70, showing that this interaction forms after about 40 ns in the simulation containing fully modified P/E tRNAPhe and is stable thereafter.
The structural peculiarities of the interface between L1 stalk and tRNAPhe/tRNAfMet, as well as the internal structure and dynamics of the two tRNAs, can be expected to have an influence on the correlation between motions of the L1 stalk and the tRNAs. In order to investigate differences between P/E tRNAPhe and tRNAfMet in this regard, we performed a correlation-based network analysis27 (introduced in Materials and Methods). Table 2 provides both the number of edges connecting the tRNA and the L1 stalk in each case, as well as their mean edge distance. We note that higher correlation translates into smaller edge distances, and edges only exist between residues that are within 4.5 Å of each other for 75% of the trajectory. More highly correlated motion across a molecular interface results in higher numbers of contacts and shorter distances for edges spanning the interface. It can be clearly seen from the mean edge distances listed in Table 2 that the L1 stalk (both L1 protein and 23S rRNA) is more loosely coupled to P/E tRNAfMet than to either P/E or E/E tRNAPhe.
Table 2.
Comparison of dynamical network edges at the L1:tRNA and rRNA:tRNA interfaces. Only simulations including all modified ribonucleosides were analyzed.
| System | L1:tRNA | rRNA:tRNA | ||||
|---|---|---|---|---|---|---|
| num edges | total distance | mean distance | num edges | total distance | mean distance | |
| P/E tRNAfMet | 13 | 23.86 | 1.84 | 14 | 24.01 | 1.71 |
| P/E tRNAPhe | 14 | 14.48 | 1.03 | 10 | 10.77 | 1.08 |
| E/E tRNAPhe | 13 | 21.97 | 1.69 | 16 | 19.29 | 1.21 |
In summary, the simulations reveal clear structural and dynamical differences between P/E tRNAPhe and tRNAfMet interacting with the ribosome. The stacking interactions between the elbow region of the P/E tRNA (G19–C56) and the L1 stalk (G2112–A2169) are more stable for tRNAPhe than for tRNAfMet. The average number of salt bridges between L1 and the acceptor stem of the P/E tRNA is slightly larger for tRNAPhe versus tRNAfMet. Moreover, tRNAPhe is seen to interact with H68 via a base triple (C3–G70–U1851). Finally, the motion of P/E tRNAPhe is more correlated to that of the L1 stalk than in case of tRNAfMet. All the observations above point to a higher affinity of tRNAPhe for the P/E site when compared to tRNAfMet, consistent with smFRET data. The simulations thus provide a structural basis for interpreting smFRET data.
Domain II of ribosomal protein L1 can move independently of the rest of the L1 stalk
The ribosomal protein L1 contains two domains. Domain I encompasses residues 1–67 and 160–234, domain II residues 68–15928. Based on the initial crystal structure of L1, it was stated that there could be significant interdomain flexibility28. By contouring the cryo-EM density map used to obtain the models presented here at increasing threshold values, it becomes apparent that domain II has lower density than the remainder of the stalk, also indicating L1 interdomain motion (Fig. 8A–C). Indeed, in one of our simulations, namely that of P/E tRNAfMet without modified ribonucleosides, one can discern that domain II of L1 detaches from the rest of the L1 stalk and moves independently from it (Fig. 8D–F and Movie S1). The physiological significance of this motion is unclear. Three-color smFRET experiments in which the L1 interdomain movement is measured together with L1 stalk or tRNA motion may shed light onto the possible role of L1 domain II movement, provided that the experimental time resolution is fast enough to capture L1 interdomain motion.
Fig. 8.
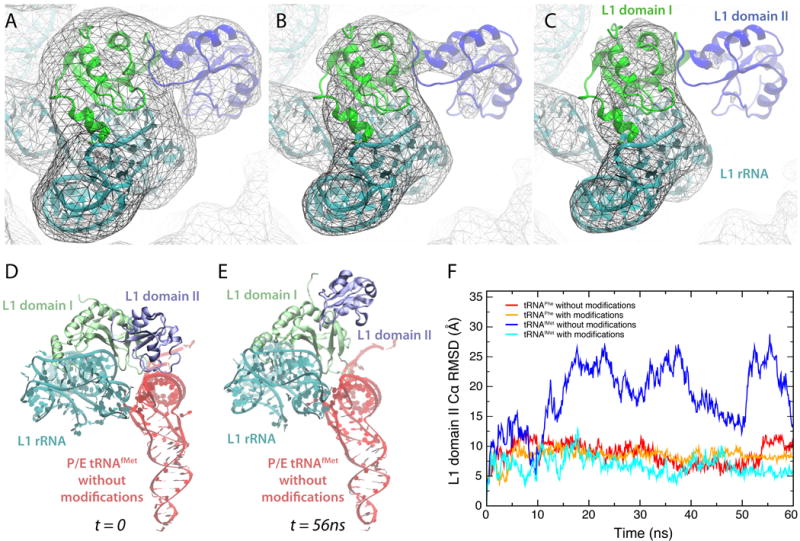
Interdomain motion of ribosomal protein L1. (A, B, C) Cryo-EM density map (EMD 1363, Ref.7) contoured at increasing threshold levels, together with atomic model obtained via flexible fitting (see Materials and Methods). The images clearly show that L1's domain II (residues 69–159) has lower density than domain I, indicating interdomain motion. (D, E) In the simulation of P/E tRNAfMet without modified ribonucleosides, a significant movement of L1's domain II with respect to the rest of the L1 stalk is observed. Shown are snapshots from the MD trajectory that illustrate the observed range of motion. (A movie of the entire trajectory is available in Supplementary Data). (F) Cα RMSD of L1's domain II throughout each MD P/E tRNA trajectory after aligning the entire L1 protein with respect to domain I.
Cryo-EM and simulation data support assignments of smFRET states
Table 3 presents a list of smFRET signals used to address L1 stalk dynamics, along with the apparent FRET efficiencies for the assigned states, one corresponding to a closed L1 stalk conformation and the other one to L1 stalk in contact with P/E tRNA. Apparent FRET efficiencies are given by IA/(IA + ID), where IA and ID correspond to the acceptor and donor intensities, respectively. Only approximate inter-dye distances can be estimated from apparent FRET efficiencies due to the uncertainty in the orientation factor κ2 between the two fluorophores and the required instrument corrections29. In fact, experiments performed by the same group, but using different instrumentation, often yield different apparent FRET efficiencies for the same biological construct (e.g., Refs.12,30). Estimating inter-dye distances from atomic structures is also ambiguous, since the average dye position is unknown, and the mere presence of the rather large fluorophores can lead to structural changes. We note that inter-dye distances shown in Table 3 were calculated from atomic models considering the dye attachment sites only, i.e., the dyes were not included in the simulations. Nonetheless, comparison between FRET-derived distances and simulations of L1 stalk:tRNA complexes provide qualitative support for previously assigned FRET states. In case of smFRET states assigned to the L1 stalk interacting with P/E tRNA, FRET-derived distances from some experiments agree well with our simulations12,13,30, while others show discrepancies14,15 (Table 3). Munro et al. considered five different labeling sites on the L1 protein14,15; even though the absolute FRET-derived distances do not agree well with the ones derived from our simulations, the predicted order between different labeling strategies agrees with the smFRET data.
Table 3.
Comparison between FRET-derived inter-dye distances, corresponding to assigned states simulated in the present work, and distances calculated from the simulations.
| Donor dye position (Cy3) | Acceptor dye position (Cy5) | P/E site | FRET Efficiency | FRET Distance (Å)a | Model Distance (Å)b | Ref. |
|---|---|---|---|---|---|---|
| State corresponding to closed L1 stalk conformation | ||||||
| L33-29 | L1-88 | tRNAfMet | 0.55 | 53 | 53 | 11 |
| L9-18 | L1-202 | tRNAfMet | 0.34 | 61 | 52 | 13 |
| L9-18 | L1-202 | tRNAPhe | 0.34 | 61 | 54 | 13 |
| State corresponding to L1 stalk in contact with P/E tRNA | ||||||
| tRNAPhe-47 | L1-202 | tRNAPhe | 0.84 | 42 | 39 | 12 |
| tRNAPhe-47 | L1-202 | tRNAPhe | 0.76 | 45 | 39 | 30 |
| tRNAfMet-8 | L1-202 | tRNAfMet | 0.60 | 51 | 38 | 13 |
| tRNAfMet-8 | L1-202 | tRNAfMet | 0.5 | 55 | 38 | 14 |
| tRNAfMet-8 | L1-55 | tRNAfMet | 0.65 | 50 | 25 | 14 |
| tRNAPhe-8 | L1-55 | tRNAPhe | 0.65 | 50 | 28 | 14 |
| tRNAfMet-8 | L1-72 | tRNAfMet | 0.1 | 79 | 53 | 14 |
| tRNAfMet-8 | L1-117 | tRNAfMet | 0.4 | 59 | 49 | 14 |
| tRNAfMet-8 | L1-173 | tRNAfMet | 0.45 | 57 | 44 | 14 |
FRET inter-dye distances were estimated assuming R0 = 55 Å (the FRET efficiency is given by 1/(1 + (r/R0)6), where r is the distance between the donor and acceptor dyes).
Model distances were calculated based on the attachment sites of the FRET labels, averaged over the last 10 ns of the corresponding MD simulations, which included all modified ribonucleosides. The following atoms were considered: Cβ for all protein residues (which were mutated to cysteine for labeling purposes in the experiments), sulfur in the thiol group of s4U (tRNAfMet-8), and nitrogen in the amino group of acp3U (tRNAPhe-47).
In addition, we calculated the angles describing L1 stalk motion (see Fig. 1) from cryo-EM-derived atomic models, and we predicted inter-dye distances for smFRET signals reporting on L1 stalk opening/closing (Table 4). Relatively large discrepancies between predicted and FRET-measured absolute distances are seen for the L1-88:L33-39 signal11. The L1 labeling site is located on the mobile domain II (see previous section), and it is possible that the introduction of a dye induces a conformational change of this domain relative to the rest of the stalk. However, the L1-88:L33-39 smFRET signal satisfactorily discriminates between the three main L1 stalk conformations. Distance displacements measured by the L1-202:L9-18 smFRET signal13,30 agree well with predicted displacements. According to the cryo-EM-derived structures, the inter-dye distances for closed and half-closed L1 stalk conformations differ by only ∼2 Å, explaining why these two states cannot be discerned using the L1-202:L9-18 smFRET signal, as previously suggested13. FRET-derived distance displacements are more readily comparable to modeled structures than absolute distances. Errors in the model-derived distances due to the uncertainty on the average dye orientation are expected to partially cancel out when comparing different conformational states. Moreover, complications related to comparing data from different experimental conditions, such as instrumentation and sample preparation, are also mitigated, since in the case of distance displacements FRET efficiences are obtained from a single experiment.
Table 4.
Comparison between FRET-derived inter-dye distances reporting on L1 stalk motion and distances derived from atomic models obtained from cryo-EM reconstructions.
| Ribosome complex (cryo-EM)a | L1 stalk α, β anglesb | L1-88:L33-29 | L1-202:L9-18 | ||||||
|---|---|---|---|---|---|---|---|---|---|
| Rc | FRETd | ΔRe | ΔFRETf | Rc | FRETd | ΔRe | ΔFRETf | ||
| Classical PRE, A/A-P/P, open L1 (EMD 1540)4 | 31°, 34° | 80.4 Å | 0.09 | 0 Å | 0 | 48.0 Å | 0.69 | 0 Å | 0 |
| Ratcheted PRE, A/P-P/E, closed L1 (EMD 1541)4 | 0°, 0° | 44.4 Å | 0.78 | -36.0 Å | 0.69 | 54.1 Å | 0.52 | 6.1 Å | -0.17 |
| 70S:EF-G, P/E, closed L1 (EMD 1363)7 | 5°, -23° | 55.5 Å | 0.49 | -24.9 Å | 0.40 | 52.7 Å | 0.56 | 4.7 Å | -0.13 |
| 70S:EF-Tu, A/T-P/P-E/E, half-closed L1 (EMD 5036)23 | 17°, 50° | 61.8 Å | 0.33 | -18.6 Å | 0.24 | 51.8 Å | 0.59 | 3.8 Å | -0.10 |
| Assigned state (smFRET) | Rg | FRETh | ΔRe | ΔFRETf | Rg | FRETh | ΔRe | ΔFRETf | |
| Pretranslocation complex, P/P, open L1 stalk | 66.1 Å | 0.2511 | 0 Å | 0 | 52.8 Å | 0.5613 | 0 Å | 0 | |
| Pretranslocation complex, P/E, closed L1 stalk | 53.2 Å | 0.5511 | -12.9 Å | 0.30 | 61.4 Å | 0.3413 | 8.6 Å | -0.22 | |
| Posttranslocation complex, E/E, half-closed/closed L1 stalk | 58.8 Å | 0.4011 | -7.3 Å | 0.15 | 61.4 Å | 0.3413 | 8.6 Å | -0.22 | |
Each ribosome complex listed was imaged by cryo-EM single-particicle reconstruction (accesion codes given in parenthesis). For each reconstruction, an atomic model was obtained by applying the MDFF method21. PRE = pretranslocation complex.
The angles reported account for most of L1 stalk motion as seen in cryo-EM-derived models (see Fig. 1).
Dye-dye distances were calculated from the atomic models based on the attachment sites (Cβ atoms) of the FRET labels.
Predicted FRET values were calculated using the given R distances (from cryo-EM-derived atomic models), assuming R0 = 55 Å (see Table 3).
ΔR = R − Rref, where Rref is the distance corresponding to the classical pretranslocation complex (first row).
ΔFRET = FRET - FRETref, where FRETref is the estimated FRET efficiency corresponding to the classical pretranslocation complex (first row).
Inter-dye distances calculated from apparent experimental FRET efficiencies assuming R0 = 55 Å (see Table 3).
Experimental apparent FRET efficiences (original references are given for each case).
E-site tRNA release facilitated by L1 stalk opening
To gain insight into the propensity of L1 stalk opening for directing E-site tRNA release, we prepared a ribosome model based on a previously published structure derived from cryo-EM data23. This structure contained P/P and E/E tRNAs, as well as a ternary complex EF-Tu:aminoacyl-tRNA:GDP. In order to induce L1 stalk opening, MDFF was employed to move the stalk from the half-closed to the open state (Fig. 9A), representing the open state by a simulated density map of the globular part of the open L1 stalk31 (see Materials and Methods).
Fig. 9.
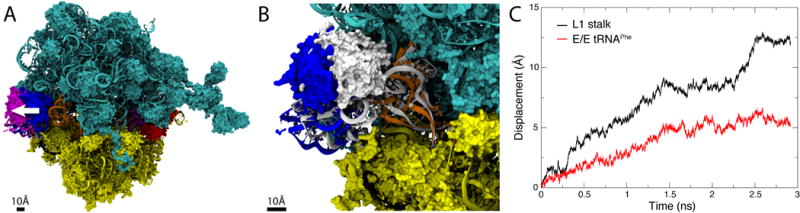
L1 stalk opening simulation. (A) Ribosome model corresponding to the state at which the E/E tRNA is released from the ribosome. The initial half-closed L1 stalk (blue) was moved to the open conformation (magenta) using MDFF in order to observe the effect of L1 stalk opening on the E/E tRNA. The white arrow illustrates L1 stalk opening. (B) Inset showing the initial structure of E/E tRNA and L1 stalk in white and the final structure in the same colors as in panel A. (C) Displacement of the center of mass of the L1 stalk and E/E tRNA elbow during the L1 stalk opening simulation.
Comparing starting and final conformations of the L1 stalk and the tRNA (see Fig. 9B) clearly shows that the E/E tRNA follows the movement of the L1 stalk. To monitor the coupling between tRNA and L1 stalk, we tracked the displacements of the center of mass of L1 stalk and tRNA during the simulation (see Fig. 9C). In the first stages of this simulation, movement of L1 and E/E tRNA are significantly coupled, indicating that the L1 stalk movement does indeed direct E-site tRNA release. However, the L1 stalk:E-site tRNA coupling diminished eventually, likely due to the quick L1 opening enforced by us and necessitated by computational requirements. Nevertheless, the simulation provides evidence that L1 stalk opening contributes to the release of E-site tRNA. This finding is consistent with smFRET data revealing the L1 stalk:tRNA interaction to be stable in a posttranslocation complex, despite fluctuations in the L1 stalk position13. A straightforward interpretation of these data is that the L1 stalk fluctuates between its half-closed and open position with the E/E tRNA bound to it until, eventually, the tRNA is released from the ribosome.
Although there is evidence that the complex employed in the simulation described above may correspond to the functional state in which the E/E tRNA is released13,32, the exact timing and mechanism of the E-site tRNA release are still a matter of debate33. Most recent evidence from smFRET experiments suggests that the A site is unoccupied upon E-site tRNA release34. Our findings are independent of the controversy concerning the timing of the E-site tRNA release, because only local interactions between the E-site tRNA and the L1 stalk are probed on the achieved simulation time scale.
Conclusion
In the last few years, smFRET has proven to be a powerful technique for studying the dynamics of conformational transitions in the ribosome elongation cycle. In particular, the L1 stalk has been studied with two main kinds of smFRET signals, reporting L1 stalk movement with respect to the ribosome11,13 or L1 stalk:tRNA interaction12,13,30,14,15. Three-color sm-FRET experiments combining signals on L1 stalk:tRNA interaction and tRNA hybrid states formation were also reported14,15. It was shown that the L1 stalk exhibits clear dynamical differences when comparing ribosome complexes bearing initiator tRNAfMet in the P site versus bearing a subset of elongator tRNAs3,11,13,14,15. In particular, ribosome complexes with P-site initiator tRNAfMet exhibit higher rates of L1 stalk opening11,13 and of disruption of the L1 stalk:tRNA interaction13,14,15 as compared to tRNAPhe and tRNATyr. Since our L1 stalk:P/E tRNA models, derived from cryo-EM data7, correspond to assigned sm-FRET states for the closed L1 stalk interacting with a P/E tRNA, the simulations reported here provide a structural basis for interpreting and explaining the smFRET observations.
The simulations show several differences between P/E tRNAfMet and tRNAPhe that explain the lower affinity between L1 stalk and initiator tRNA than for elongator tRNAPhe. It will be interesting to investigate if these observations hold for other elongator tRNAs. Compared to tRNAPhe, tRNAfMet binds deeper into the 30S P site by about 5 Å, exhibits a distinct internal conformation, as probed by the angle formed by the two tRNA arms, and its elbow region is more flexible. Stacking interactions between the 23S rRNA and the elbow of the P/E tRNA, as well as the number of salt bridges between the L1 protein and the P/E tRNA backbone, are smaller for tRNAfMet versus tRNAPhe. In the tRNAPhe simulation, an additional contact between the tRNA's acceptor stem and H68 of the 23S rRNA was formed, that was not seen in a tRNAfMet simulation. Correlation-based network analysis also shows that communication between P/E tRNAfMet and the L1 stalk is smaller than for P/E tRNAPhe. Thus, our data point to a weaker L1 stalk:tRNA interaction for tRNAfMet compared to tRNAPhe consistent with the aforementioned differences in rates measured by smFRET3,13,14,15.
Atomic models of the ribosome derived from cryo-EM data, together with MD simulations, confirm the assignment of states from previous smFRET experiments. Such models are also valuable for designing new labeling schemes to probe different conformational transitions of the ribosome.
Finally, a simulation of the entire ribosome in which the L1 stalk was moved from the half-closed to the open conformation supports the hypothesis that L1 stalk opening helps release the E-site tRNA from the ribosome, since the tRNA spontaneously follows the movement of the L1 stalk. Thus, the dynamic L1 stalk appears to be actively involved in both hybrid state formation, translocation of tRNAs from the P to the E site, as well as tRNA release from the ribosome.
Materials and Methods
Atomic model of a posttranslocation ribosome
A complete atomic model of the E. coli ribosome was developed based on an X-ray crystal structure (PDB 2I2U/2I2V)35. All missing residues and ribosomal proteins (except for S1) were modeled. A 46-nucleotide messenger RNA (mRNA) molecule was modeled based on X-ray data36. E. coli P/P fMet-Phe-Phe-tRNAPhe and E/E deacylated tRNAPhe were modeled using a T. thermophilus ribosome crystal structure (PDB 2OW8)25. Modeling, simulation setup and analyses were performed with VMD37, unless otherwise noted. MD simulations were performed with NAMD 2.738.
The general simulation setup followed the protocol described earlier22. After completing the all-atom model of the full ribosome, the protonation states of all histidine residues were assigned manually based on their local environment. Additionally, C2575 of the 23S rRNA was protonated according to a prior work39. For systems containing RNA, it is particularly important to accurately place counterions at energetically favorable locations in order to stabilize the structure40. Thus, the system was neutralized with Mg2+ ions using the GPU-accelerated VMD plugin cionize, which places each ion at a minimum in the electrostatic potential, recalculated after each placement41. After completing the solvation shells of all Mg2+ ions40, the system was solvated in three steps. First, all crevices and cavities were solvated with the Dowser plugin42 of VMD, which extends DOWSER43 to support systems containing RNA. In the next step, a water shell was constructed around the presolvated ribosome using the program Solvate44. Finally, the resulting system was placed in a water box, ensuring that the periodic images of the ribosome are separated by at least 55 Å. After the solvation, a concentration of 0.1 M KCl was established by randomly placing ions. The final system contains 2,926,193 atoms, including around 900,000 water molecules and 2,073 Mg2+, 1,688 K+and 1,636 Cl− ions. This ribosome model was employed in the full-ribosome MD simulations with P/P and E/E tRNAs. Due to its direct relevance to the present work, we describe below in detail how the L1 stalk was modeled. Modeling of the remaining ribosomal elements will be described elsewhere.
L1 stalk model
The L1 stalk is a very flexible region, thus generally not well resolved in crystal structures of the ribosome. Part of the 23S rRNA corresponding to the L1 stalk is resolved in the E. coli structure (PDB 2AW4)45. Specifically, residues 2099-2110, 2135-2156, 2179-2190 of the 23S rRNA comprising part of the L1 stalk were resolved in PDB 2AW4; approximately the same region was resolved in a newer E. coli structure (PDB 2I2V)35. The structure of ribosomal protein L1 from S. acidocaldarius complexed with a 55-nucleotide fragment of 23S rRNA from T. thermophilus containing helix 77, shortened versions of helices 76 and 78, and two interconnecting loops was resolved crystallographically (PDB 1MZP)46. This 55-nucleotide fragment was used to build a homology model of the missing residues in the E. coli L1 stalk 23S rRNA. A homology model of the E. coli ribosomal protein L1 was built using MODELLER47. The template structure used was the T. thermophilus ribosomal protein L1 in complex with mRNA (PDB 1ZHO)48.
Four Mg2+ ions were placed on the modelled L1 stalk based on experimental evidence: three Mg2+ ions were resolved in PDB 1MZP46 and included in our model; a K+ ion was resolved in PDB 1ZHO48, but since the K+ concentration used for crystallization was very high (200 mM) and this ion's position is consistent with a predicted Mg2+-biding site49, a Mg2+ was placed at this position instead. By analogy to the number of Mg2+ ions usually associated with tRNAs40, 26 additional diffusively bound Mg2+ ions were placed iteratively at electrostatic potential minima using cionize41, with a minimum solute-ion distance of 7 Å. Finally, 21 K+ ions were added to fully neutralize the system. Crystallographic water molecules from PDBs 1MZP and 1ZHO were included in the L1 stalk when possible, and the system was embedded in a water box with padding of 10 Å. A series of restrained energy minimizations and equilibrations was performed to arrive at a final L1 stalk model.
Since the L1 stalk is half-closed in the presence of an E/E tRNA50,51,23 but is open in the employed X-ray model (PDB 2I2V)35, for the purposes of this study the L1 stalk was modeled in the half-closed state. A simulated density map at 7 Å resolution was generated representing a half-closed L1 stalk23 and used as a target in a 3-ns molecular dynamics flexible fitting (MDFF) simulation21,22. Because the fitting was performed in explicit solvent, no restraints were necessary to maintain the secondary structure. The same procedure was used to close the ribosomal protein L9. Although the positioning of the E-site tRNA is based on the structure 2OW825, which features stacking interactions between the elbow of the E-site tRNA and L1 stalk, no such stacking could be observed in the present model. Interestingly, this stacking is observed in some crystal structures but not in others, such as the two recently published structures of the ribosome in complex with a ternary complex24 or EF-G52. In all investigated crystal structures, a non-cognate tRNA or a mix of tRNAs is present in the E-site not engaging in codon-anticodon interactions with the mRNA, unlike in the present simulations. Thus, the significance of stacking between the E/E tRNA and the L1 stalk is not clear.
Atomic model of a ratcheted ribosome
A model of the ratcheted E. coli ribosome containing a hybrid P/E tRNA was obtained by applying MDFF21,22 to a 10.9-Å cryo-EM map of E. coli 70S:EF-G:GDPNP:puromycin (EMD 1363)7. First, a vacant ribosome, corresponding to the atomic model described above without water, ions, mRNA and tRNA, was used as the initial structure for MDFF, and a multistep fitting protocol previously described21,22 was applied. The L12 stalk was restrained in space during the MDFF simulations, since it was not resolved in the cryo-EM map. Once a ratcheted ribosome model was obtained with MDFF simulations in vacuo, the ribosome model containing water, ions, and mRNA was driven to the ratcheted state through a targeted molecular dynamics (TMD) simulation53. The system was then refined with MDFF, this time with explicit solvent. Water, ions, mRNA, and the L12 stalk were not coupled to either the TMD or the final MDFF refinement, thus being allowed to freely equilibrate.
P/E tRNA models
The initial structure for E. coli tRNAPhe was taken from a crystal structure of the T. thermophilus ribosome in complex with a P-site E. coli tRNAPhe (PDB 2OW8, chain z)25. For E. coli tRNAfMet, the initial structure was obtained from a crystal structure including a formyltransferase (PDB 2FMT, chain C)54. Each tRNA structure was added to the P/E site of the ratcheted ribosome obtained in vacuo (see above) via rigid-body docking using Situs55 and refined using MDFF. During the MDFF refinement, the ribosome structure was positionally restrained; for the P/E-tRNA, base pairs were enforced via distance restraints and dihedral restraints were applied to seven dihedral angles in each residue (see Refs.21,22 for definition of the restraints). Ions and water molecules were added to each fitted tRNA according to the following steps. Five site-bound and 20 diffusively-bound Mg2+ ions were added to each tRNA using cionize41 (minimum allowed distance between ion and tRNA set to 2 Å and 6.5 Å, respectively), and the primary solvation shell of each Mg2+ ion was completed40. The tRNA systems were then solvated using the VMD plugin Dowser56,43. Each solvated tRNA model was placed in a water box and added to the solvated ribosome, removing overlapping water molecules and ions. Each ribosome-tRNA system was then neutralized by randomly adding K+ ions and the tRNAs were refined with MDFF. During the MDFF refinement, the ribosome was initially fixed and subsequently only backbone atoms of the ribosome were positionally restrained, while secondary structure restraints were applied to each P/E tRNA (see Refs.21,22). After MDFF refinement, the following tRNA-ribosome interactions57 were enforced by means of interactive molecular dynamics58: (1) codon-anticodon interactions between the P/E tRNA and the P-site mRNA codon; (2) A-minor interactions between the 16S rRNA and the tRNA; and stacking interactions between the tRNA's CCA and the 23S rRNA.
Molecular dynamics simulations
L1 stalk and P/E tRNA subsystems
Molecular dynamics simulations of subsystems encompassing the L1 stalk and a P/E tRNA (tRNAfMet or tRNAPhe) were conducted using NAMD 2.738. Atoms within 20 Å of the L1 stalk or the P/E tRNA were included in the subsystem, which was put in a water box with padding of 10 Å. Backbone atoms farther than 10 Å from the L1 stalk and the P/E tRNA were positionally restrained. Potassium ions were added randomly to neutralize any charge imbalance generated in the definition of each subsystem. The equations of motion were integrated using periodic boundary conditions and a 2-fs time step, with bonded interactions calculated every 2 fs; nonbonded, short-range interactions calculated every 4 fs; and nonbonded, long-range electrostatic interactions calculated every 6 fs using the Particle Mesh Ewald (PME) method with pencil decomposition. The PME grid density was never less than 1/Å3. A distance cut-off of 10 Å was used in the calculation of short-range nonbonded interactions, with a switching function applied at 9 Å.
Each system was simulated in the NpT ensemble (T=310 K, p=1 atm) with the following protocol: water and ions were equilibrated for 200 ps with the remainder of the system restrained, after which the side chain restraints were released and each system was equilibrated for an additional 800 ps. Finally, backbone restraints were removed (except for system boundaries, see above) and each system was equilibrated for around 60 ns. Codon-anticodon interactions were enforced via harmonic restraints during the first 5 ns of free equilibration. The simulations presented here were performed with the AMBER99 force field59 with the SB60 and BSC061 corrections, with or without modified ribonucleosides62. For technical reasons, the force field was converted to CHARMM force field format (see below). In simulations using the CHARMM27 force field63,64 with the CMAP correction65, not described in this paper, the L1 stalk rRNA was not stable (Fig. S3).
Full posttranslocation ribosome
The all-atom posttranslocation ribosome complex described above was equilibrated by means of an MD simulation. A multistep protocol was employed in which the ribosome was gradually equilibrated to 310 K first using NVT and subsequently NpT (p=1 atm) conditions. The total equilibration time was 24.5 ns. It is noteworthy that during the first 7.5 ns of the final steps of the equilibration distance restraints were enforced to keep intact the codon-anticodon interactions in the P and E sites, as well as the base pairing between the 23S rRNA P-loop and the CCA of the P/P peptidyl-tRNA, allowing the ribosome to adjust. After this equilibration phase a trajectory of 60 ns was collected.
The AMBER99 force field59 with the SB60 and BSC061 refinements and parameters for all necessary modified ribonucleosides62 was adopted for all simulations (see below for details). The equations of motion were integrated with periodic boundary conditions and a 1-fs time step, with bonded interactions calculated every 1 fs; short-range, nonbonded interactions calculated every 2 fs; and long-range electrostatic interactions calculated every 4 fs using PME with pencil decomposition and grid density of at least 1 Å3. A distance cut-off of 12 Å was used in the calculation of short-range nonbonded interactions, with a switching function applied at 10 Å.
Simulation of L1 stalk opening with full-ribosome model
The simulations of L1 stalk opening employed a pre-equilibrated (20 ns) all-atom complex of the E. coli ribosome described above bound to a ternary complex (aminoacyl-tRNA:EF-Tu:GTP). The structure of the ternary complex was obtained from Ref.23 with GDP replaced by GTP. The final system was obtained by flexibly fitting (with explicit-solvent MDFF) the 70S atomic model described above into a 7-Å simulated map generated from the structure in Ref.23 while restraining the conformation of the decoding center to the structure reported in Ref51. Since some crystal structures (e.g., Refs.25,51) show stacking between the L1 stalk and the E-site tRNA, we prepared a complex featuring these interactions. The stacking between base pairs G2112-A2169 (23S) and G19-C56 (tRNA) was adjusted according to an X-ray based model 2J00/2J0151 using MDFF in combination with interactive molecular dynamics58. The fitting was followed by a 2-ns equilibration. During this initial equilibration, however, the stacking between the D loop and the L1 stalk was disrupted. Note that in the case of hybrid P/E tRNA these interactions were stable on a much longer time scale. Nevertheless, this partially stacked structure was used as a starting point for the L1 stalk opening simulation.
The simulation of the L1 stalk opening was performed using MDFF. To define the target position of the open conformation, we generated a 7-Å simulated map of the globular part of the modeled L1 stalk (see above) aligned to the partially resolved L1 stalk in the X-ray model reported in Ref.31. This particular structure was chosen because of the relatively large displacement, about 15Å, of the center of mass of the globular part of the L1 stalk relative to the closed state. The opening simulation protocol was identical to that for the full ribosome with the exception that MDFF was applied. To allow for slow opening, the MDFF coupling parameter ξ (see Refs.21,22) was set to 0.001 instead of the usual 0.3; no additional secondary structure restraints were enforced. The total simulation time for opening was 3 ns.
Molecular dynamics force fields
Since it was not possible to build the full 2.9-million-atom ribosome system using the LeaP module of the AMBER10 suite66, we converted the AMBER force field59 to CHARMM format in order to be able to set up the system with the psfgen plugin of VMD. The conversion was performed in an automated manner using in-house programs developed solely for this purpose.
The ff99SB set of parameters containing the basic force field for nucleic acids and proteins as well as the refinements of protein backbone dihedrals60 (SB refinement) was downloaded from http://ambermd.org/dbase.html. The refined parameters for the backbone dihedrals of nucleic acids61 (BSC0 refinement) were downloaded from http://mmb.pcb.ub.es/PARMBSC0/. Finally, topologies and parameters for all the necessary modified ribonucleosides62 were retrieved from the Modifieds Database server http://ozone3.chem.wayne.edu/.
The conversion was performed starting from the basic topologies and parameters, adding SB and BSC0 refinements and finally the parameters and topologies of the modified ribonucleosides. This strategy corresponds to the way the LeaP module of the AMBER suite loads topologies and parameters. However, in the present case we did not permit redefinitions of parameters by the data sets for the modified ribonucleosides. Since each of the modified ribonucleosides was paramerized individually, i.e., redefinitions of parameters occured within the complete set of modified nucleosides, it was necessary to create a unique set of parameters. Moreover, these parameters must not interfere with the existing parameters for nucleic acids and proteins. Thus, only parameters for bonds, dihedrals, and impropers interactions were included which were different from those already present in the basic force field plus the SB and BSC0 refinements. Finally, parameters for protonated cytidine67 contributed by Pavel Banáš and Jir̆í Šponer were included.
The accuracy of the conversion was verified with NAMD. Equivalent input files were prepared with both LeaP and psfgen in AMBER and CHARMM format, respectively, both of which are supported by NAMD. In order to verify the correctness of the conversion we compared the pairwise energies for all the interaction terms in the force field using a modified version of NAMD and an in-house program developed for this purpose. This procedure was performed for tripeptide and trinucleotides constructed in such a way that every amino acid or nucleoside is at the second position. All termini were verified using a similar protocol. The final test was the comparison of the pairwise interaction of all the ribosomal proteins as well as the fully modified 16S rRNA.
Angle measurements for the L1 stalk
The angles defining the opening of the L1 stalk (Fig. 1) were measured based on inertia tensors. The frame of reference was defined as the inertia tensor for 5S and 23S rRNAs excluding L1 stalk, L7/L12 stalk, and the central protuberance. In the following it is implied that the axes of inertia are ordered according to their corresponding moments, i.e., the first axis would correspond to the largest moment of inertia. The orientation of the L1 stalk was defined by the the third axis of inertia of 23S rRNA residues 2093 to 2196. This axis roughly coincides with the axis of helix 76. Subsequently, this axis was projected onto the three planes spanned by the axes of the frame of reference (see Fig. S4). For the calculation of the α angle (Fig. 1), the L1 stalk axis was projected onto the plane parallel to the subunit interface; the normal vector to this plane is the first axis of the reference system. The angle was then calculated between this projection and the second axis of the reference frame. Similarly, for the β angle (Fig. 1) a projection was performed onto the plane normal to the third axis of the reference system. The β angle was defined as the angle of this projection relative to the first axis of the reference system.
Correlation-based network analysis
Weighted L1 stalk:tRNA networks were constructed for each system based on contacts as outlined previously27. Each amino acid is represented by a single node, and nucleotides are split into two nodes: one for the nucleobase and another corresponding to the sugar and backbone atoms. Edges between nodes are defined by dynamical contacts. A contact is present when a heavy atom corresponding to one node is within 4.5 Å of a heavy atom from another node for at least 75% of the trajectory frames analyzed (50 ps intervals from the last 20 ns of each simulation). Covalently bonded neighbors were neglected. The edge distances dij were derived from correlation values (Cij) that define the probability of information transfer across a given edge: dij = −log(|Cij|) where , Δr⃗i(t) = r⃗i(t) − 〈r⃗i(t)〉, and r⃗i(t) is the position of the atom corresponding to the ith node.
Supplementary Material
Acknowledgments
The authors thank Joachim Frank for a fruitful collaboration, Pavel Banáš and Jir̆í Šponer for providing force field parameters for protonated cytidine, and Jingyi Fei and Scott Blanchard for useful discussions. This work was supported by the National Institutes of Health (P41-RR005969) and the National Science Foundation (PHY0822613 and MCB0844670). E.S. was supported by a fellowship from the Humboldt Foundation. Computer time was provided through the National Resources Allocation Committee (MCA93S028).
Glossary
Abbreviations used:
- smFRET
single-molecule fluorescence resonance energy transfer
- cryo-EM
cryo-electron microscopy
- MDFF
molecular dynamics flexible fitting
- ASL
anticodon-stem loop
- EF-G
elongation factor G
- EF-Tu
elongation factor Tu
Footnotes
Publisher's Disclaimer: This is a PDF file of an unedited manuscript that has been accepted for publication. As a service to our customers we are providing this early version of the manuscript. The manuscript will undergo copyediting, typesetting, and review of the resulting proof before it is published in its final citable form. Please note that during the production process errors may be discovered which could affect the content, and all legal disclaimers that apply to the journal pertain.
References
- 1.Moazed D, Noller H. Intermediate states in the movement of transfer RNA in the ribosome. Nature. 1989;342:142–148. doi: 10.1038/342142a0. [DOI] [PubMed] [Google Scholar]
- 2.Blanchard SC, Kim HD, Gonzalez RL, Puglisi JD, Chu S. tRNA dynamics on the ribosome during translation. Proc Natl Acad Sci USA. 2004;101:12893–12898. doi: 10.1073/pnas.0403884101. [DOI] [PMC free article] [PubMed] [Google Scholar]
- 3.Cornish PV, Ermolenko DN, Noller HF, Ha T. Spontaneous inter-subunit rotation in single ribosomes. Mol Cell. 2008;30:578–588. doi: 10.1016/j.molcel.2008.05.004. [DOI] [PMC free article] [PubMed] [Google Scholar]
- 4.Agirrezabala X, Lei J, Brunelle JL, Ortiz-Meoz RF, Green R, Frank J. Visualization of the hybrid state of tRNA binding promoted by spontaneous ratcheting of the ribosome. Mol Cell. 2008;32:190–197. doi: 10.1016/j.molcel.2008.10.001. [DOI] [PMC free article] [PubMed] [Google Scholar]
- 5.Julián P, Konevega AL, Scheres SHW, Lázaro M, Gil D, Wintermeyer W, Rodnina M, Valle M. Structure of ratcheted ribosomes with trnas in hybrid states. Proc Natl Acad Sci USA. 2008;105:16924–16927. doi: 10.1073/pnas.0809587105. [DOI] [PMC free article] [PubMed] [Google Scholar]
- 6.Frank J, Agrawal RK. A ratchet-like inter-subunit reorganization of the ribosome during translocation. Nature. 2000;406:318–322. doi: 10.1038/35018597. [DOI] [PubMed] [Google Scholar]
- 7.Valle M, Zavialov A, Sengupta J, Rawat U, Ehrenberg M, Frank J. Locking and unlocking of ribosomal motions. Cell. 2003;114:123–134. doi: 10.1016/s0092-8674(03)00476-8. [DOI] [PubMed] [Google Scholar]
- 8.Ermolenko DN, Majumdar ZK, Hickerson RP, Spiegel PC, Clegg RM, Noller HF. Observation of intersubunit movement of the ribosome in solution using FRET. J Mol Biol. 2007;370:530–540. doi: 10.1016/j.jmb.2007.04.042. [DOI] [PubMed] [Google Scholar]
- 9.Frank J, Gao H, Sengupta J, Gao N, Taylor DJ. The process of mRNA-tRNA translocation. Proc Natl Acad Sci USA. 2007;104:19671–19678. doi: 10.1073/pnas.0708517104. [DOI] [PMC free article] [PubMed] [Google Scholar]
- 10.Korostelev A, Ermolenko DN, Noller HF. Structural dynamics of the ribosome. Curr Opin Chem Biol. 2008;12:674–683. doi: 10.1016/j.cbpa.2008.08.037. [DOI] [PMC free article] [PubMed] [Google Scholar]
- 11.Cornish P, Ermolenko DN, Staple DW, Hoang L, Hickerson RP, Noller HF, Ha T. Following movement of the L1 stalk between three functional states in single ribosomes. Proc Natl Acad Sci USA. 2009;106:2571–2576. doi: 10.1073/pnas.0813180106. [DOI] [PMC free article] [PubMed] [Google Scholar]
- 12.Fei J, Kosuri P, MacDougall DD, Gonzalez RL., Jr Coupling of ribosomal L1 stalk and tRNA dynamics during translation elongation. Mol Cell. 2008;30:348–359. doi: 10.1016/j.molcel.2008.03.012. [DOI] [PubMed] [Google Scholar]
- 13.Fei J, Bronson JE, Hofman JM, Srinivas RL, Wiggins CH, Gonzalez RL., Jr Allosteric collaboration between elongation factor G and the ribosomal L1 stalk directs tRNA movements during translation. Proc Natl Acad Sci USA. 2009;106:15702–15707. doi: 10.1073/pnas.0908077106. [DOI] [PMC free article] [PubMed] [Google Scholar]
- 14.Munro JB, Altman RB, Tung CS, Cate JHD, Sanbonmatsu KY, Blanchard SC. Spontaneous formation of the unlocked state of the ribosome is a multistep process. Proc Natl Acad Sci USA. 2010;107:709–714. doi: 10.1073/pnas.0908597107. [DOI] [PMC free article] [PubMed] [Google Scholar]
- 15.Munro JB, Altman RB, Tung CS, Sanbonmatsu KY, Blanchard SC. A fast dynamic mode of the EF-G-bound ribosome. EMBO J. 2010;29:770–781. doi: 10.1038/emboj.2009.384. [DOI] [PMC free article] [PubMed] [Google Scholar]
- 16.Subramanian AR, Dabbs ER. Functional studies on ribosomes lacking protein L1 from mutant Escherichia coli. Eur J Biochem. 1980;112:425–430. doi: 10.1111/j.1432-1033.1980.tb07222.x. [DOI] [PubMed] [Google Scholar]
- 17.Munro JB, Altman RB, O'Connor N, Blanchard SC. Identification of two distinct hybrid state intermediates on the ribosome. Mol Cell. 2007;25:505–517. doi: 10.1016/j.molcel.2007.01.022. [DOI] [PMC free article] [PubMed] [Google Scholar]
- 18.RajBhandary UL. Initiator transfer RNAs. J Bacteriol. 1994;176:547–552. doi: 10.1128/jb.176.3.547-552.1994. [DOI] [PMC free article] [PubMed] [Google Scholar]
- 19.Studer SM, Feinberg JS, Joseph S. Rapid kinetic analysis of EF-G-dependent mRNA translocation in the ribosome. J Mol Biol. 2003;327:369–381. doi: 10.1016/s0022-2836(03)00146-3. [DOI] [PubMed] [Google Scholar]
- 20.Dorner S, Brunelle JL, Sharma D, Green R. The hybrid state of tRNA binding is an authentic translation elongation intermediate. Nat Struct Mol Biol. 2006;13:234–241. doi: 10.1038/nsmb1060. [DOI] [PMC free article] [PubMed] [Google Scholar]
- 21.Trabuco LG, Villa E, Mitra K, Frank J, Schulten K. Flexible fitting of atomic structures into electron microscopy maps using molecular dynamics. Structure. 2008;16:673–683. doi: 10.1016/j.str.2008.03.005. [DOI] [PMC free article] [PubMed] [Google Scholar]
- 22.Trabuco LG, Villa E, Schreiner E, Harrison CB, Schulten K. Molecular Dynamics Flexible Fitting: A practical guide to combine cryo-electron microscopy and X-ray crystallography. Methods. 2009;49:174–180. doi: 10.1016/j.ymeth.2009.04.005. [DOI] [PMC free article] [PubMed] [Google Scholar]
- 23.Villa E, Sengupta J, Trabuco LG, LeBarron J, Baxter WT, Shaikh TR, Grassucci RA, Nissen P, Ehrenberg M, Schulten K, Frank J. Ribosome-induced changes in elongation factor Tu conformation control GTP hydrolysis. Proc Natl Acad Sci USA. 2009;106:1063–1068. doi: 10.1073/pnas.0811370106. [DOI] [PMC free article] [PubMed] [Google Scholar]
- 24.Schmeing TM, Voorhees RM, Kelley AC, Gao YG, Murphy FV, Weir JR, Ramakrishnan V. The crystal structure of the ribosome bound to ef-tu and aminoacyl-tRNA. Science. 2009;326:688–694. doi: 10.1126/science.1179700. [DOI] [PMC free article] [PubMed] [Google Scholar]
- 25.Korostelev A, Trakhanov S, Laurberg M, Noller HF. Crystal structure of a 70S ribosome-tRNA complex reveals functional interactions and rearrangements. Cell. 2006;126:1–13. doi: 10.1016/j.cell.2006.08.032. [DOI] [PubMed] [Google Scholar]
- 26.Pan D, Kirillov S, Zhang CM, Hou YM, Cooperman BS. Rapid ribosomal translocation depends on the conserved 18–55 base pair in P-site transfer RNA. Nat Struct Mol Biol. 2006;13:354–359. doi: 10.1038/nsmb1074. [DOI] [PubMed] [Google Scholar]
- 27.Sethi A, Eargle J, Black AA, Luthey-Schulten Z. Dynamical networks in tRNA:protein complexes. Proc Natl Acad Sci USA. 2009;106:6620–6625. doi: 10.1073/pnas.0810961106. [DOI] [PMC free article] [PubMed] [Google Scholar]
- 28.Nikonov S, Nevskaya N, Eliseikina I, Fomenkova N, Nikulin A, Ossina N, Garber M, Jonsson BH, Briand C, Al-Karadaghi S, Svensson A, Aevarsson A, Liljas A. Crystal structure of the RNA binding ribosomal protein L1 from Thermus thermophilus. EMBO J. 1996;15:1350–1359. [PMC free article] [PubMed] [Google Scholar]
- 29.Roy R, Hohng S, Ha T. A practical guide to single-molecule FRET. Nat Methods. 2008;5:507–516. doi: 10.1038/nmeth.1208. [DOI] [PMC free article] [PubMed] [Google Scholar]
- 30.Sternberg SH, Fei J, Prywes N, McGrath KA, Gonzalez RL., Jr Translation factors direct intrinsic ribosome dynamics during translation termination and ribosome recycling. Nat Struct Mol Biol. 2009;16:861–868. doi: 10.1038/nsmb.1622. [DOI] [PMC free article] [PubMed] [Google Scholar]
- 31.Borovinskaya MA, Shoji S, Holton JM, Fredrick K, Cate JHD. A steric block in translation caused by the antibiotic spectinomycin. ACS Chem Biol. 2007;2:545–552. doi: 10.1021/cb700100n. [DOI] [PMC free article] [PubMed] [Google Scholar]
- 32.Dinos G, Kalpaxis DL, Wilson DN, Nierhaus KH. Deacylated tRNA is released from the E site upon A site occupation but before GTP is hydrolyzed by EF-Tu. Nucleic Acids Res. 2005;33:5291–5296. doi: 10.1093/nar/gki833. [DOI] [PMC free article] [PubMed] [Google Scholar]
- 33.Semenkov YP, Rodnina MV, Wintermeyer W. The “allosteric three-site model” of elongation cannot be confirmed in a well-defined ribosome system from Escherichia coli. Proc Natl Acad Sci USA. 1996;93:12183–12188. doi: 10.1073/pnas.93.22.12183. [DOI] [PMC free article] [PubMed] [Google Scholar]
- 34.Uemura S, Aitken CE, Korlach J, Flusberg BA, Turner SW, Puglisi JD. Real-time tRNA transit on single translating ribosomes at codon resolution. Nature. 2010;464:1012–1017. doi: 10.1038/nature08925. [DOI] [PMC free article] [PubMed] [Google Scholar]
- 35.Berk V, Zhang W, Pai RD, Cate JHD. Structural basis for mRNA and tRNA positioning on the ribosome. Proc Natl Acad Sci USA. 2006;103:15830–15834. doi: 10.1073/pnas.0607541103. [DOI] [PMC free article] [PubMed] [Google Scholar]
- 36.Yusupova G, Jenner L, Rees B, Moras D, Yusupov M. Structural basis for messenger RNA movement on the ribosome. Nature. 2006;444:391–394. doi: 10.1038/nature05281. [DOI] [PubMed] [Google Scholar]
- 37.Humphrey W, Dalke A, Schulten K. VMD – Visual Molecular Dynamics. J Mol Graphics. 1996;14:33–38. doi: 10.1016/0263-7855(96)00018-5. [DOI] [PubMed] [Google Scholar]
- 38.Phillips JC, Braun R, Wang W, Gumbart J, Tajkhorshid E, Villa E, Chipot C, Skeel RD, Kale L, Schulten K. Scalable molecular dynamics with NAMD. J Comp Chem. 2005;26:1781–1802. doi: 10.1002/jcc.20289. [DOI] [PMC free article] [PubMed] [Google Scholar]
- 39.Kubarenko AV, Sergiev PV, Bogdanov AA, Brimacombe R, Dontsova OA. A protonated base pair participating in rRNA structural interactions. Nucleic Acids Res. 2001;29:5067–5070. doi: 10.1093/nar/29.24.5067. [DOI] [PMC free article] [PubMed] [Google Scholar]
- 40.Eargle J, Black AA, Sethi A, Trabuco LG, Luthey-Schulten Z. Dynamics of recognition between tRNA and elongation factor Tu. J Mol Biol. 2008;377:1382–1405. doi: 10.1016/j.jmb.2008.01.073. [DOI] [PMC free article] [PubMed] [Google Scholar]
- 41.Stone JE, Phillips JC, Freddolino PL, Hardy DJ, Trabuco LG, Schulten K. Accelerating molecular modeling applications with graphics processors. J Comp Chem. 2007;28:2618–2640. doi: 10.1002/jcc.20829. [DOI] [PubMed] [Google Scholar]
- 42.Gumbart J, Trabuco LG, Schreiner E, Villa E, Schulten K. Regulation of the protein-conducting channel by a bound ribosome. Structure. 2009;17:1453–1464. doi: 10.1016/j.str.2009.09.010. [DOI] [PMC free article] [PubMed] [Google Scholar]
- 43.Zhang L, Hermans J. Hydrophilicity of cavities in proteins. Proteins: Struct, Func, Gen. 1996;24:433–438. doi: 10.1002/(SICI)1097-0134(199604)24:4<433::AID-PROT3>3.0.CO;2-F. [DOI] [PubMed] [Google Scholar]
- 44.Grubmüller H, Heymann B, Tavan P. Ligand binding and molecular mechanics calculation of the streptavidin-biotin rupture force. Science. 1996;271:997–999. doi: 10.1126/science.271.5251.997. [DOI] [PubMed] [Google Scholar]
- 45.Schuwirth BS, Borovinskaya MA, Hau CW, Zhang W, Vila-Sanjurjo A, Holton JM, Cate JHD. Structures of the bacterial ribosome at 3.5 Å resolution. Science. 2005;310:827–834. doi: 10.1126/science.1117230. [DOI] [PubMed] [Google Scholar]
- 46.Nikulin A, Eliseikina I, Tishchenko S, Nevskaya N, Davydova N, Platonova O, Piendl W, Selmer M, Liljas A, Drygin D, Zimmermann R, Garber M, Nikonov S. Structure of the L1 protuberance in the ribosome. Nat Struct Biol. 2003;10:104–108. doi: 10.1038/nsb886. [DOI] [PubMed] [Google Scholar]
- 47.Sali A, Blundell TL. Comparative protein modelling by satisfaction of spatial restraints. J Mol Biol. 1993;234:779. doi: 10.1006/jmbi.1993.1626. [DOI] [PubMed] [Google Scholar]
- 48.Nevskaya N, Tishchenko S, Volchkov S, Kljashtorny V, Nikonova E, Nikonov O, Nikulin A, Köhrer C, Piendl W, Zimmermann R, Stockley P, Garber M, Nikonov S. New insights into the interaction of ribosomal protein L1 with RNA. J Mol Biol. 2006;355:747–759. doi: 10.1016/j.jmb.2005.10.084. [DOI] [PubMed] [Google Scholar]
- 49.Drygin D, Zimmermann RA. Magnesium ions mediate contacts between phosphoryl oxygens at positions 2122 and 2176 of the 23S rRNA and ribosomal protein L1. RNA. 2000;6:1714–1726. doi: 10.1017/s1355838200001436. [DOI] [PMC free article] [PubMed] [Google Scholar]
- 50.Yusupov MM, Yusupova GZ, Baucom A, Lieberman K, Earnest TN, Cate JHD, Noller HF. Crystal structure of the ribosome at 5.5 Å resolution. Science. 2001;292:883–896. doi: 10.1126/science.1060089. [DOI] [PubMed] [Google Scholar]
- 51.Selmer M, Dunham CM, Murphy FV, IV, Weixlbaumer A, Petry S, Kelley AC, Weir JR, Ramakrishnan V. Structure of the 70S ribosome complexed with mRNA and tRNA. Science. 2006;313:1935–1942. doi: 10.1126/science.1131127. [DOI] [PubMed] [Google Scholar]
- 52.Gao YG, Selmer M, Dunham CM, Weixlbaumer A, Kelley AC, Ramakrishnan V. The structure of the ribosome with elongation factor G trapped in the posttranslocational state. Science. 2009;326:694–699. doi: 10.1126/science.1179709. [DOI] [PMC free article] [PubMed] [Google Scholar]
- 53.Schlitter J, Engels M, Krüger P, Jacoby E, Wollmer A. Targeted molecular dynamics simulation of conformational change — application to the T ↔ R transition in insulin. Mol Sim. 1993;10:291–308. [Google Scholar]
- 54.Schmitt E, Panvert M, Blanquet S, Mechulam Y. Crystal structure of methionyl-tRNAfMet transformylase complexed with the initiator formyl-methionyl-tRNAfMet. EMBO J. 1998;17:6819–6826. doi: 10.1093/emboj/17.23.6819. [DOI] [PMC free article] [PubMed] [Google Scholar]
- 55.Wriggers W, Milligan RA, McCammon JA. Situs: A package for docking crystal structures into low-resolution maps from electron microscopy. J Struct Biol. 1999;125:185–195. doi: 10.1006/jsbi.1998.4080. [DOI] [PubMed] [Google Scholar]
- 56.Gumbart J, Schulten K. The roles of pore ring and plug in the SecY protein-conducting channel. J Gen Physiol. 2008;132:709–719. doi: 10.1085/jgp.200810062. [DOI] [PMC free article] [PubMed] [Google Scholar]
- 57.Shoji S, Walker SE, Fredrick K. Ribosomal translocation: one step closer to the molecular mechanism. ACS Chem Biol. 2009;4:93–107. doi: 10.1021/cb8002946. [DOI] [PMC free article] [PubMed] [Google Scholar]
- 58.Stone J, Gullingsrud J, Grayson P, Schulten K. A system for interactive molecular dynamics simulation. In: Hughes JF, Séquin CH, editors. 2001 ACM Symposium on Interactive 3D Graphics. ACM SIGGRAPH; New York: 2001. pp. 191–194. [Google Scholar]
- 59.Cornell WD, Cieplak P, Bayly CI, Gould IR, Merz KM, Jr, Ferguson DM, Spellmeyer DC, Fox T, Caldwell JW, Kollman PA. A second generation force field for the simulation of proteins, nucleic acids, and organic molecules. J Am Chem Soc. 1995;117:5179–5197. [Google Scholar]
- 60.Hornak V, Abel R, Okur A, Strockbine B, Roitberg A, Simmerling C. Comparison of multiple Amber force fields and development of improved protein backbone parameters. Proteins. 2006;65:712–725. doi: 10.1002/prot.21123. [DOI] [PMC free article] [PubMed] [Google Scholar]
- 61.Perez A, Marchn I, Svozil D, Sponer J, Cheatham TE, Laughton CA, Orozco M. Renement of the AMBER Force Field for Nucleic Acids: Improving the Description of α/γ Conformers. Biophys J. 2007;92:3817–3829. doi: 10.1529/biophysj.106.097782. [DOI] [PMC free article] [PubMed] [Google Scholar]
- 62.Aduri R, Psciuk BT, Saro P, Taniga H, Schlegel HB, SantaLucia J. AMBER force field parameters for the naturally occurring modified nucleosides in RNA. J Chem Theor Comp. 2007;3:1464–1475. doi: 10.1021/ct600329w. [DOI] [PubMed] [Google Scholar]
- 63.MacKerell AD, Jr, Bashford D, Bellott M, Dunbrack RL, Jr, Evanseck J, Field MJ, Fischer S, Gao J, Guo H, Ha S, Joseph D, Kuchnir L, Kuczera K, Lau FTK, Mattos C, Michnick S, Ngo T, Nguyen DT, Prodhom B, Reiher IWE, Roux B, Schlenkrich M, Smith J, Stote R, Straub J, Watanabe M, Wiorkiewicz-Kuczera J, Yin D, Karplus M. All-atom empirical potential for molecular modeling and dynamics studies of proteins. J Phys Chem B. 1998;102:3586–3616. doi: 10.1021/jp973084f. [DOI] [PubMed] [Google Scholar]
- 64.Foloppe N, MacKerell AD., Jr All-atom empirical force field for nucleic acids: I. Parameter optimization based on small molecule and condensed phase macromolecular target data. J Comp Chem. 2000;21:86–104. [Google Scholar]
- 65.MacKerell AD, Jr, Feig M, Brooks CL., III Extending the treatment of backbone energetics in protein force fields: Limitations of gas-phase quantum mechanics in reproducing protein conformational distributions in molecular dynamics simulations. J Comp Chem. 2004;25:1400–1415. doi: 10.1002/jcc.20065. [DOI] [PubMed] [Google Scholar]
- 66.Case DA, Darden TA, Cheatham TE, Simmerling CL, Wang J, Duke RE, Luo R, Crowley M, Walker RC, Zhang W, Merz KM, Wang B, Hayik S, Roitberg A, Seabra G, Kolossváry I, Wong KF, Paesani F, Vanicek J, Wu X, Brozell S, Steinbrecher T, Gohlke H, Yang L, Tan C, Mongan J, Hornak V, Cui G, Mathews DH, Seetin MG, Sagui C, Babin V, Kollman PA. AMBER 10. University of California; San Francisco: 2008. [Google Scholar]
- 67.Banáš P, Rulíšk L, Hánošová V, Svozil D, Walter NG, ner J, Otyepka M. General Base Catalysis for Cleavage by the Active-Site Cytosine of the Hepatitis Delta Virus Ribozyme: QM/MM Calculations Establish Chemical Feasibility. J Phys Chem B. 2008;112:11177–11187. doi: 10.1021/jp802592z. [DOI] [PMC free article] [PubMed] [Google Scholar]
- 68.Limbach PA, Crain PF, McCloskey JA. Summary: the modified nucleosides of RNA. Nucleic Acids Res. 1994;22:2183–2196. doi: 10.1093/nar/22.12.2183. [DOI] [PMC free article] [PubMed] [Google Scholar]
Associated Data
This section collects any data citations, data availability statements, or supplementary materials included in this article.