Abstract
Main sequences, the function describing the relationship between eye movement amplitude and velocity, have been used extensively in oculomotor research as an indicator of first-order dynamics yet it is difficult to find main sequence analysis for accommodative vergence or for disparity vergence in isolation when all mitigating factors have been well controlled and there are no studies in which accommodative vergence and disparity vergence main sequences have been generated for the same group of subjects. The present study measured main sequences in 1) accommodative vergence with disparity vergence open loop, 2) disparity vergence with accommodation open loop, and 3) combinations of accommodative and disparity vergence. A dynamic AC/A ratio was defined and was found to be similar to the traditional static AC/A ratio. Vergence acceleration was measured for all conditions. A pulse-step model of accommodation and convergence was constructed to interpret the dynamics of the crosslinked interactions between the two systems. The model supports cross-coupling of both the pulse and step components and simulates the primary empirical findings that 1) disparity vergence has a higher main sequence slope than accommodative vergence 2) both accommodative and disparity vergence acceleration increase with response amplitude whereas accommodation acceleration does not.
Keywords: AC/A, accommodation, blur, eye movements, human
INTRODUCTION
Blur is the primary stimulus for accommodation and it also stimulates vergence movements indirectly by way of neural crosslinks between the accommodative response and vergence (Alpern & Ellen, 1956). Similarly, disparity is the primary stimulus for vergence but also stimulates accommodation indirectly by way of neural crosslinks between the vergence system and accommodation. Current models of the crosslinks have taken static measurements of accommodative vergence and vergence accommodation into account but the dynamics have not been as well studied (Kotulak & Schor, 1986). Main sequences, the function describing the relationship between eye movement amplitude and peak velocity, have been used extensively in oculomotor research as an indicator of first-order dynamics yet it is difficult to find main sequence analysis for either accommodative vergence or disparity vergence in isolation when all mitigating factors have been well controlled and there are no studies in which accommodative vergence and disparity vergence main sequences have been generated for the same group of subjects.
Past measurements of vergence velocity have most often been conducted with closed feedback loops for both vergence and accommodation where neither disparity nor accommodative vergence were isolated. In these experiments, either real targets at different viewing distances were used so that the stimuli to both systems varied (Erkelens, Collewijn & Steinman, 1989; Zee, Fitzgibbon & Optican, 1992), or targets on a haploscopic display screen were employed wherein the horizontal disparities were varied but the accommodative demand was fixed at the distance of the viewing screen (Munoz, Semmlow, Yuan & Alvarez, 1999; Alvarez, Semmlow, Yuan & Munoz, 1999). The cue conflict inherent in this situation may affect vergence dynamics. An additional complication in evaluating past measurements of main sequences for accommodative and disparity vergence velocity is that oftentimes analyses did not distinguish between trials containing and not containing saccades and saccades are known to greatly increase vergence velocity when they occur in conjunction with vergence movements. [Busettini and Mays (2005) give an excellent overview of this interaction.] Vergence, accommodative vergence in particular, is often measured with the near and far targets aligned with one eye and in alignment with the measurement optometer in order to quantify the accommodative response. When using real targets, the targets are often offset vertically in order that the near target does not obscure the far target. Either of these two procedures is likely to produce saccades when using steps in disparity. Saccades may also be elicited by steps in blur as noted by Kenyon, Ciuffreda and Stark (1978) and as we observed in preliminary experiments. The presence of saccadic intrusions would not only affect measurements of peak vergence velocity but may also result in an overestimation of peak accommodation velocity (Schor & Lott, 1999). Saccades may also produce artifactual measures of accommodation since significant saccades will take the aligned eye off the axis of the optometer which can cause a change in output voltage that would be confounded with any change in accommodation. For these reasons, main sequence data should always separate trials having saccades from those without. Nevertheless, there are several studies in which saccades were properly taken into consideration that provide main sequences for disparity vergence (Hung, Ciuffreda, Semmlow & Horng 1994; Hung, Zhu & Ciuffreda, 1997). In the present experiments, we attempted to avoid saccades by presenting stimuli that would elicit primarily symmetrical vergence movements and trials containing saccades were excluded from the analysis of peak velocity and acceleration.
The dynamics of disparity and accommodative vergence working in concert have been studied extensively over the past several decades by Ciuffreda, Semmlow, Hung and their collaborators. For example, Semmlow and Wetzel (1979) tested the dynamic responses of their subjects with either disparity cues alone or with disparity and blur cues presented together. By subtracting the disparity responses from the combined cue responses they determined that the contribution of accommodative vergence was quite small. Hung, Semmlow and Ciuffreda (1983) realized that the contribution of accommodative vergence was probably underestimated by Semmlow and Wetzel’s method as it would not have accounted for the feedback during the combined response that would have kept the overall response smaller than the linear sum of the two responses. To avoid this problem, Hung et al. (1983) used the variance of accommodative vergence and disparity vergence as markers to identify the contribution of each of the two components in response to stimuli that contained both disparity and blur cues. They determined that the accommodative vergence contribution was larger than previously estimated and occurred late in the response, the assumption, of course, being that the variance would be the same for the cues in isolation and in combination. While these two papers contributed greatly to our current understanding of how disparity vergence and accommodative vergence interact dynamically, neither vergence velocity nor acceleration was methodically measured. In fact, vergence acceleration data has been presented in only one prior paper and this was measured for just one vergence stimulus amplitude (Alvarez, Semmlow, Yuan & Munoz, 2002).
The static properties of crosslinks between the vergence and accommodation systems have been well studied. When a subject views a near target with accommodation open loop, changes in vergence drive accommodation (vergence accommodation) and the amount of accommodation driven per unit of vergence (usually expressed in prism diopters) is the CA/C ratio. Accommodation can be made open loop by using pinholes imaged in the natural pupil (Maxwellian view) (Hung et al., 1994), by using low-pass-filtered targets with natural pupils (Kotulak & Schor, 1987; Tsuetaki & Schor, 1987) or by feeding back the accommodative response to keep the blur error constant (Schor & Kotulak, 1986; Cumming & Judge, 1986). Similarly, when a subject views a near target with disparity vergence open loop, changes in accommodation drive horizontal vergence and the amount of vergence driven per diopter of accommodation is described as the AC/A ratio. Disparity vergence can be held open loop by occluding one eye, by feedback of the vergence movement to keep disparity error constant, by using a stimulus that disappears before the movement occurs (Semmlow, Hung, Horng & Ciuffreda, 1993), or, as in the present experiment, by presenting the subject with horizontal lines that span the apertures of both eyes since with horizontal lines there are no horizontal disparities (Wick and Bedell, 1989).
The dynamic properties of crosslinks have been less well studied. Schor and Kotulak (1986) found that high frequency modulation of accommodation passed to the vergence system but low frequency modulation did not. Vergence accommodation had similar frequency sensitivity. Dynamic models of the crosslinks would be more complete with good estimates of the main sequences of accommodative vergence and disparity vergence and with estimates of both vergence velocity and acceleration that can be used to evaluate crosslink interactions in pulse-step models of accommodation and vergence (Schor and Bharadwaj, 2006). A recent paper comparing the dynamics of blur-driven and vergence-driven accommodation found that the dynamics were similar (Suryakumar, Meyers, Irving & Bobier, 2007). A direct comparison has not been made for disparity-driven and accommodation-driven vergence. Because the vergence plant is the same for both modalities, any difference in the dynamics would have to be due to premotor elements and the difference in dynamics might indicate which control elements in the pulse-step model are passed from the accommodative system to the vergence system. The present experiments tested the first and second order dynamics of accommodative vergence and disparity vergence in the same subjects using conditions as closely matched as possible. The stimuli employed allowed for symmetrical disparity vergence and symmetrical accommodative vergence which reduced the number of saccadic intrusions. The results were interpreted with a pulse-step model of accommodation (Schor and Bharadwaj, 2006) and a similar pulse-step organization for a model of disparity vergence. The model simulations were used to determine if both the pulse and step components of accommodation are passed to the vergence system through the crosslinks.
METHODS
Subjects
Seven young adults were used as subjects, all but one of whom had refractive corrections less than 3 diopters. The ages and refractive corrections are presented in Table 1. The subjects were informed of the nature of the experiments and practiced a few trials of each procedure to make sure they could fuse the horizontal disparities and accommodate to the steps of defocus. Each subject was briefed on the experiments and signed a written consent form that was approved by the human subjects committee at the University of California. Phenylephrine eye drops (2.5%) were administered prior to recording and we made sure that pupil diameter remained constant throughout the experiment, as fluctuations of the pupil would interfere with accurate optometer measurements of accommodation. A concerted effort was made to prevent the subjects from experiencing fatigue. Trials were self-paced and initiated by the subject with a button press. Subjects were encouraged to take frequent breaks and saline eye drops were administered periodically since subjects tend to blink less often when they are in the eye tracker.
Table 1.
Subjects’ ages, refractive correction (spherical equivalent) for right and left eyes, accommodative response to stimulus ratio and accommodative vergence to accommodation ratio (meter angles/diopter).
| Subject | Age | OD | OS | AR | AC/A |
|---|---|---|---|---|---|
| AB | 22 | 0.00 | 0.00 | 1.00 | 0.67 |
| HT | 26 | −1.25 | −1.25 | 1.00 | 0.73 |
| JK | 28 | −3.00 | −2.75 | 0.92 | 0.75 |
| JO | 32 | −3.25 | −3.25 | 0.96 | 1.03 |
| NP | 19 | −2.50 | −2.00 | 0.83 | 1.05 |
| SG | 22 | −0.75 | −0.75 | 0.98 | 0.60 |
| SS | 26 | 0.00 | 0.00 | 0.95 | 0.63 |
Procedure
Targets were projected onto a tangent screen that was 180 cm from the exit pupil of a Badal stimulus optometer mounted in a dual Purkinje eye tracker and Scheiner measurement optometer (SRI). The characteristics of the SRI system have been described previously (Bharadwaj & Schor, 2005). The Badal lens system produces a barely noticeable size change so for all intents and purposes there is no size cue for distance. Preliminary experiments showed that in the absence of disparity or other direction cues, the subjects were unable to judge the direction of blur and as a result the latencies and velocities of accommodative vergence were extremely variable in magnitude and direction. We chose to make the direction of the accommodative step stimuli predictable and the size of the stimuli unpredictable. Naturally occurring accommodative vergence responses would have cues other than blur for direction and distance so we felt justified in allowing subjects to know the stimulus direction. Trials were run in blocks of 24 and subjects were encouraged to rest for several minutes between blocks.
Calibration
To calibrate the optometer, the subject was instructed to focus on a Maltese cross-like target (Fig. 1A) as it changed focus between 0, 2 and 4 diopters. A linear regression was performed between the stimulus input and the output voltages in order to convert volts to diopters. This means of calibration assumes that the subject was fully accommodating the stimulus. The validity of this assumption for these relatively young subjects was born out by the accommodative response function obtained using subjective responses from a Wheatstone mirror stigmascope (Nguyen, Vedamurthy & Schor 2008). The Wheatstone mirror haploscope allowed measures of the vergence phoria with a Nonius technique and the stigmascopes attached to each arm of the haploscope. The response AC/A ratio could be measured when the fixation target was seen only by one eye. Most subjects had slopes (accommodative response vs. blur stimulus) close to 1.0 (Table 1, AR). To calibrate the eye tracker, subjects fixated targets at five known angles (−10, −5, 0, 5, and 10 degrees) and the output voltages were converted to degrees by linear regression. The right and left eyes were tested independently. The horizontal and vertical mirrors of the SRI visual stimulators were set to null the subject’s phoria using an anaglyphic method. We did this so that vergence movements would not be elicited whenever one eye was occluded as required by some of the paradigms. Both the SRI optometer and eye tracker analog voltages were sampled at 200 Hz.
Figure 1.
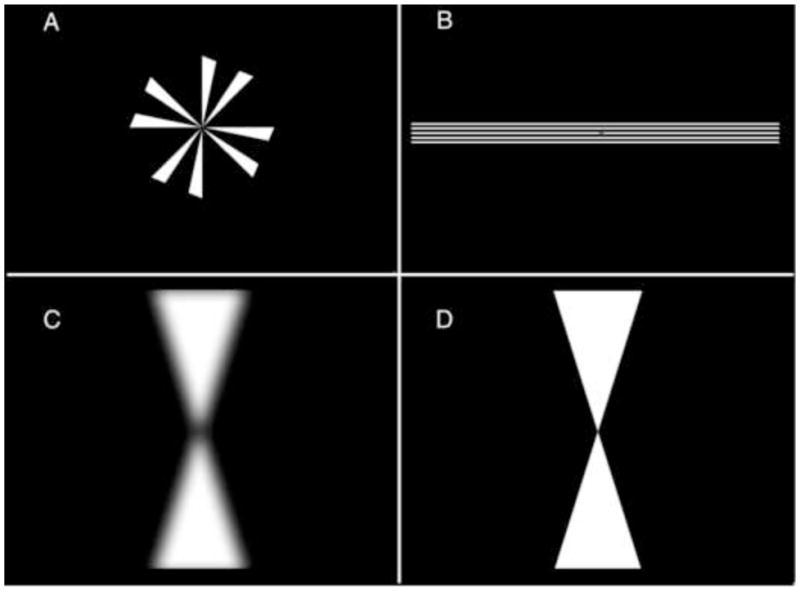
Targets. A. Modified Maltese cross with a diameter of 10 degrees. B. Horizontal lines with a width of approximately 22 degrees (spanning the aperture) and a height of 1.6 degrees. C. Low-pass filtered hourglass-shaped target with a width of 6 degrees and a height of 22 degrees. D. Unfiltered hourglass-shaped target.
Paradigms
Accommodative vergence was primarily elicited by three trial types, Aligned trials, Monocular Horizontal Line trials, and Binocular Horizontal Line trials. Disparity vergence was elicited in Disparity Only trials and accommodative vergence and disparity vergence were both stimulated in Disparity + Blur trials. Accommodation was measured only in the Aligned trials where the left eye was stationary with respect to the optometer.
Preliminary experiments showed that most of our inexperienced subjects were not able to keep their left eyes aligned with the optometer during asymmetric disparity vergence trials when the disparity was introduced entirely to the right eye and an excessive number of trials contained saccades which are known to affect the dynamics of vergence movements. For this reason we decided to measure disparity vergence in response to symmetrical disparity stimuli (detailed below). Additionally, we were concerned that the process involved in suppressing the movement of the left eye during Aligned accommodative vergence trials (Kenyon et al., 1978) may influence the dynamics of accommodative vergence. For example, if a pursuit movement were added to cancel out the vergence signal to the aligned eye this might change the dynamics of the vergence movement relative to symmetrical vergence. To circumvent these problems, we used stimuli that would elicit symmetrical vergence movements for both disparity vergence and accommodative vergence trials. Therefore, all of the data presented are for symmetrical vergence movements, the only exception being for the Aligned trials described above which were necessary to obtain accurate measures of accommodation. The results will show that asymmetrical and symmetrical vergence trials had similar peak velocities and accelerations. The details for the various trial types are as follows:
Aligned Trials (accommodative vergence stimulated)
A modified Maltese cross (Fig. 1A) was projected onto a tangent screen in alignment with the subject’s left eye and with the stimulus optometer. The cross had a diameter of approximately 10 degrees. Unless extraordinary measures are taken (Schor & Lott, 1999) movement of the left eye relative to the optometer may result in an artifactual change in optometer output. For that reason, we made sure that movements of the eye did not exceed a half degree. The subject viewed the target binocularly at first and initiated each trial with a button press. The right eye was then occluded by deflecting the right mirror into a black background and the focus stimulator pseudo-randomly presented steps of 0.75, 1.75, 2.75 or 3.75 diopters. The subjects were instructed to focus the center of the target as well as possible. Occlusion of the right eye allowed for accommodative vergence thereby providing open-loop conditions for disparity vergence.
Monocular and binocular horizontal lines (stimulates accommodative vergence with disparity vergence open loop)
To stimulate symmetrical accommodative vergence, the disparity-vergence loop was opened by having the subjects view a set of horizontal lines (Fig. 1B) having a spatial frequency centered at 3 cycles/deg. The horizontal lines kept horizontal eye position open-loop so that both eyes were free to move horizontally during accommodative vergence. The steps in blur were of the same magnitude as those used in Aligned trials. The subjects viewed the target either binocularly (Binocular H. Line trials) or monocularly (Monocular H. Line trials). Initially, a small dot appeared in the center of the screen so that gaze was binocular and straight ahead in order to avoid adaptation to vergence responses over the course of the experiment. The dot disappeared with the initiation of the trial and the right eye was automatically occluded in the Monocular H. Line trials. The results of the Binocular H. Line trials could be more directly compared to the disparity vergence trials which were binocular and the Monocular H. Line trials could be more directly compared to the Aligned trials which were monocular. As the results will show, the number of eyes viewing the target turned out to be irrelevant.
Disparity Vergence (stimulates disparity vergence with accommodation open loop)
The target for disparity vergence was a binocularly viewed low-pass-filtered hourglass-shaped target (Fig. 1C) that presented binocular disparity while leaving accommodation open loop (Tsuetaki & Schor, 1987). The target had a width at its base of 6 degrees and a height of 22 degrees. Crossed horizontal disparities were presented by equally deflecting the right and left horizontal mirrors of the SRI tracker nasally. Four subjects (AB, SG, JK and SS) were given stimulus amplitudes of 3, 5, 7 and 9 degrees and three subjects (HT, JO and NP) were given disparities that matched the size of the blur cues given in the accommodative vergence trials, 2.5, 6.0, 9.4 and 12.8 degrees. These angles are equal to 0.75, 1.75, 2.75 and 3.75 meter angles (MA), where 1.0 MA is approximately equal to 3.4 degrees. A target at a distance of 1 meter requires 1 MA of convergence and 1 diopter of accommodation. (For the first four subjects we had presented symmetrical disparities and also asymmetrical trials in which the virtual near and far targets were aligned with one eye so that all of the vergence was performed by the unaligned eye. The disparities that were used were kept small enough so that the single eye performing the vergence movement in asymmetrical vergence trials would stay within the range of the eye tracker. Because most of these subjects were unable to make vergence movements without saccades in the asymmetrical trials we discontinued the use of asymmetrical vergence stimuli and increased the amplitude of the vergence stimuli for the remaining subjects to correspond to the power of the blur stimuli. This change did not qualitatively affect the results and conclusions.)
Blur + Disparity (stimulates both accommodative vergence and disparity vergence)
Both a horizontal disparity step and a defocus step were presented simultaneously using an hourglass-shaped target with sharp edges (Fig. 1D). The steps in defocus and disparity were the same as those described above.
Data Analysis
Vergence eye movements and accommodation responses were analyzed by a custom Matlab program to find the response onset, offset, peak velocity, and peak acceleration of each trial. The raw eye position and accommodation signals from the two eyes were first smoothed by a 10-point sliding average filter. Vergence was calculated as left-eye position minus right-eye position and conjugate eye position was calculated as the average of left-eye and right-eye positions. The vergence and accommodation data were differentiated with a central-difference algorithm spanning five samples and subsequently smoothed by a 10-point sliding average filter to obtain velocity (deg/sec) and acceleration (deg/sec2) profiles. The onset of convergence was defined as the point where the convergence velocity of five successive points first exceeded 2 deg/sec and accommodation onset was defined as the point where the velocity first exceeded 0.5 diopters/sec. The peak convergence velocity was taken as the highest velocity within the first 1 second of each trial since we were only interested in the initiation of the movement and not subsequent changes that might have occurred after visual feedback. The offset of the convergence response was defined by the point at which the convergence velocities of five successive points were less than 5% of the peak velocity. Vergence and accommodation amplitudes were calculated as the amplitude at offset minus the amplitude at onset. It is important to note, therefore, that the response amplitudes reported in the main sequence analysis is limited to the amplitude at the end of the initial peak velocity and does not include corrective movements made after visual feedback. The peak acceleration traces were quite noisy with several peaks having nearly the same value so we limited the search for peak acceleration to one occurring within 100 msec before the peak velocity. The program detected if a saccade occurred within 50 ms of the peak vergence velocity since saccades are known to increase the velocity of both vergence and accommodation (Schor & Lott, 1999). A saccade was detected if the velocities of three successive points exceeded 15 deg/sec. The conjugate data were not smoothed because at the sample rate used (200 Hz), extensive smoothing would have made small saccades undetectable. The onset of the saccade was traced back to find the first point where the velocity exceeded 10 deg/sec to determine saccade onset and to where eye velocity fell to 10 deg/sec to determine saccade offset. Saccade amplitude was calculated as the difference in conjugate eye position from onset to offset. Trials with saccades were excluded from further analysis. Each trial was examined visually before accepting the values chosen by the algorithm.
RESULTS
A full set of data is comprised of 5 paradigms with 48 trials for each (= 240 trials). All of the subjects completed all trials except for JK who did not do the Blur + Disparity trials and subject NP who did not do the second block of Aligned trials because his pupils had become responsive. Approximately 23% of the trials are not included in the data analysis because they contained saccades.
The accommodation response function, as measured subjectively on the stigmascope, showed that most of the subjects responded fully to the imposed blur. The slopes of the response functions (AR) are presented in Table 1 which also gives each subject’s age, the refractive correction for each eye and each subject’s response AC/A ratio as measured subjectively on the haploscopic stigmascope. Most of the subjects had response slopes close to unity and the average slope was 0.95. We did not adjust the results to compensate for this small error.
Vergence dynamics
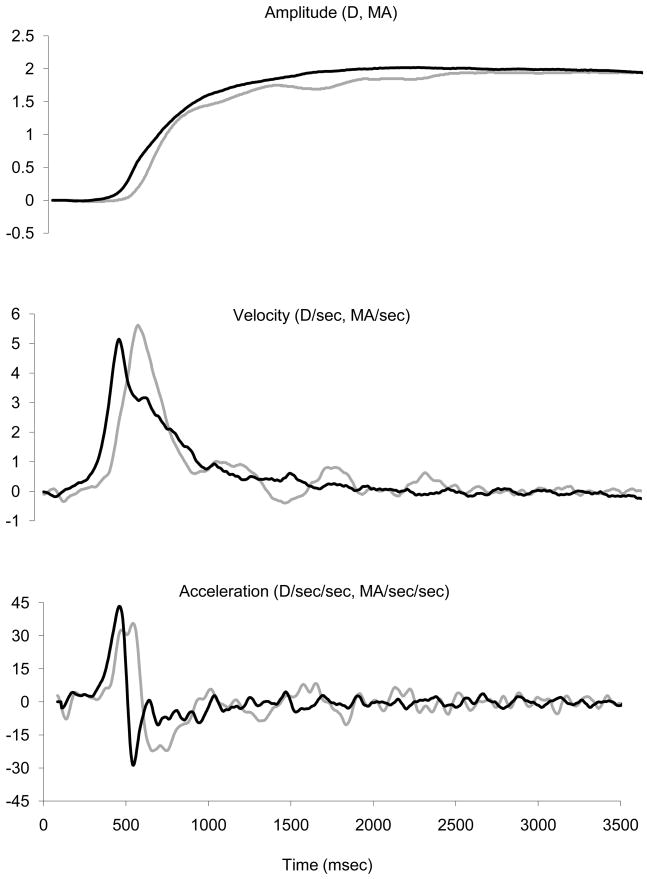
Figure 2 represents the mean response for subject JK for the 1.75 and 2.75 diopter Aligned trials in which the target remained aligned with the left eye and the right eye was occluded at the same time as a step in defocus. Because individual trials are too noisy to obtain unambiguous onset latencies, 15 trials were first temporally aligned by the average time to peak accommodation velocity to obtain a mean accommodation trace. The same data were then aligned by the average time to peak vergence velocity to obtain a mean vergence trace. Averaging the two velocities separately maintained their respective waveforms. The times to peak velocity were unambiguous and both were measured relative to target onset so that the temporal relationship between the two traces was maintained. The averaged traces allowed for accurate measurements of accommodation and vergence latencies. A general observation that can be observed in Figure 2 is that the onset of accommodative vergence occurred earlier than the onset of accommodation. This has been reported before and is thought to be due to the sluggishness of the plant for accommodation (Wilson, 1973; Schor and Lott, 1999). This issue is further addressed in the Discussion. The mean difference in latencies between accommodative-vergence and accommodation for subject JK was approximately 100 msec and typically the difference was 110 to 115 msec. A second general observation (not shown) is that the vergence movements during disparity vergence trials almost always had only one velocity peak whereas vergence velocity was much more variable for accommodative vergence. This was true for all subjects except SG who also had one clean single peak in accommodative vergence velocity. This subject also had a different pattern of main sequences across the different paradigms than all of the other subjects. For SG, who was our only highly experienced subject, accommodative vergence velocities were much higher than disparity vergence velocities and she often overshot the target. This suggested the possibility that this subject was using voluntary vergence to elicit vergence accommodation to help focus the target. We did not have the opportunity to test this supposition further but we have excluded SG’s data from the plots of average vergence velocity and acceleration shown below.
Figure 2.
Example of Aligned trials for subject JK showing vergence (black lines) and accommodation (gray lines) amplitude, velocity and acceleration. Vergence was converted to meter angles (MA) so that it could be plotted on the same scale as accommodation. Traces are the average of 15 trials.
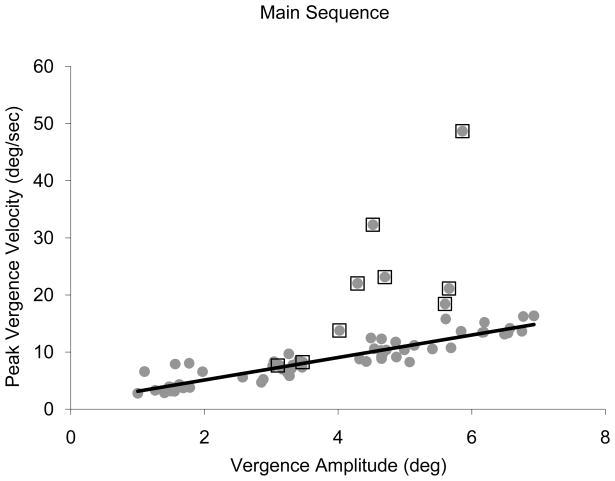
The reason for excluding all trials with saccades is made clear in Figure 3 which is a main sequence (peak vergence velocity as a function of vergence response amplitude) for subject SG, for Blur + Disparity trials. The gray dots represent all trials and the dots with squares around them are trials containing saccades (average saccade size = 1.6 deg). It is obvious that the peak velocities for trials with saccades are much higher than trials without. The slope of the linear regression is 2.8 when the saccade trials are included and 2.0 when they are not and the R-square value is improved from 0.30 when saccades are included to 0.85 when they are not. For this reason, all of the subsequent analysis and figures exclude trials that contain saccades.
Figure 3.
Main sequence for convergence for subject SG Blur + Disparity trials. Circles represent all data and squares represent trials having saccades occurring within50 msec of peak vergence velocity.
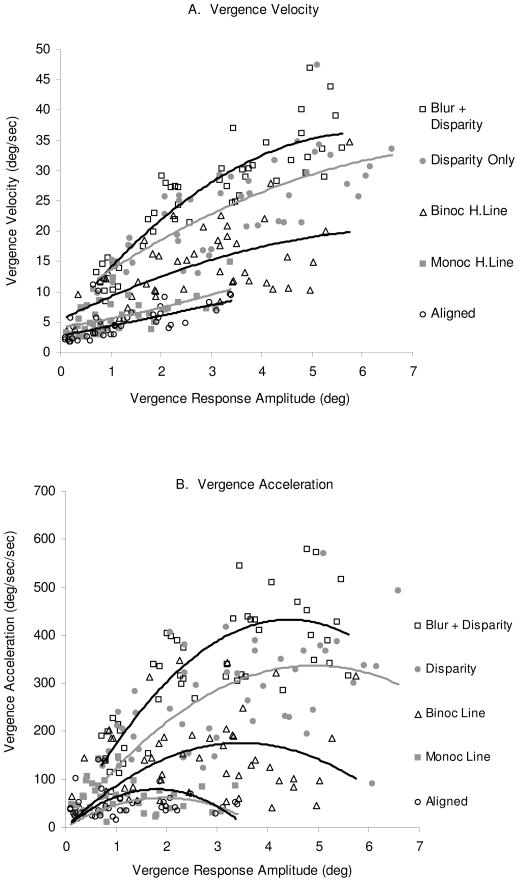
Figure 4A shows the main sequences for subject AB for all five types of trials. For this subject, the greatest vergence velocities and the steepest slopes were attained when blur and disparity were presented together and the lowest velocities resulted for accommodative-vergence stimulated in the Aligned trials and the Monocular Line trials where only blur was given as a stimulus. Main sequences are normally fit by linear regression but these data were in many cases better fit by second order polynomial equations. When fit by linear regression, the slopes for this subject ranged from 1.7 deg/sec/deg for the Monocular Lines trial to 5.4 deg/sec/deg for the Blur + Disparity trials. Figure 4B presents the same analysis for vergence acceleration as a function of vergence response amplitude.
Figure 4.
A. Main sequences for subject AB for the three accommodative vergence trial types (Aligned, Binocular and Monocular H. Line), the disparity vergence trial (Disparity) and the trials in which both cues were given (Disparity + Blur). The lines were fit by second order polynomial equations. The regression lines are ordered as indicated by the legend to the right, e.g., the Blur + Disparity at the top and Aligned at the bottom line. B. Convergence acceleration for the same subject (AB). Format the same as in A.
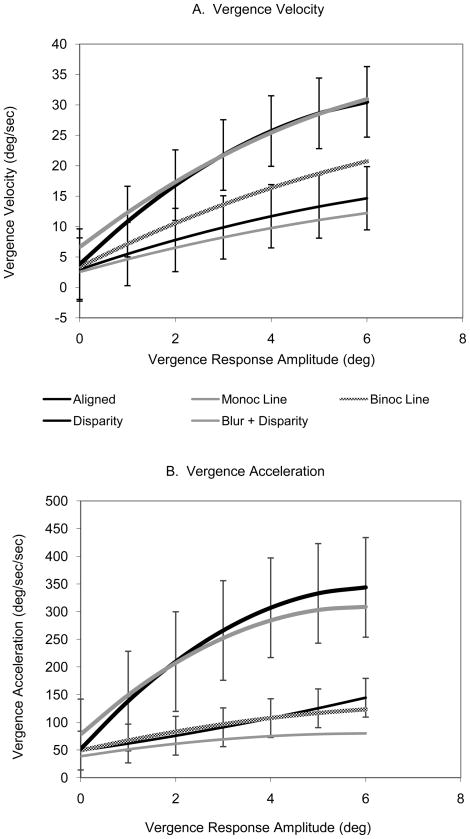
The functions relating vergence velocity and acceleration to vergence response amplitude for the six subjects are illustrated in Figure 5A & B, respectively. Second order polynomials were fit to each subject’s individual data and the coefficients were averaged between subjects to produce an average polynomial fit for each condition. These equations were then used to construct the curves shown in Figures 5A and B. The error bars indicate the standard deviation between the means of the six subjects (all subjects except SG). The velocities of trials with horizontal disparities present in the stimulus (Disparity Only and Blur + Disparity) are about twice as great as trials in which blur alone was the cue (Aligned, Binocular Lines and Monocular Lines trials). The average polynomial equations for each condition are presented in Table 2 along with the equations fit by linear regression and their R2 values. The acceleration values for disparity vergence responses were much higher than for accommodative vergence responses having the same magnitude (Fig. 5B). For the response amplitudes illustrated in Figure 5B, the magnitude of the accelerations for accommodative vergence doubled over a 6 degree range while the magnitude of the accelerations increased by sevenfold for disparity vergence.
Figure 5.
A. Mean second order polynomial fits for six subjects for the three accommodative vergence trial types (Aligned, Binocular and Monocular H. Line), the disparity vergence trial (Disparity) and the trials in response to both cues (Disparity + Blur). The error bars show the standard deviation of the means between subjects for Aligned and Disparity trials. Standard errors for other conditions were similar but not shown for clarity. B. Mean vergence acceleration for six subjects. Same format as A.
Table 2.
Mean linear and polynomial equations and R2 values for all paradigms.
| Vergence Velocity | ||||
|---|---|---|---|---|
| linear | R2 | polynomial | R2 | |
| Aligned | y = 1.7x + 4.3 | 0.56 | y = −0.12x2 + 2.7x +2.9 | 0.56 |
| Monoc Line | y = 1.2x + 4.6 | 0.50 | y = −0.09x2 + 2.2x + 2.5 | 0.45 |
| Binoc Line | y = 1.6x + 9.2 | 0.31 | y = −0.17x2+3.9x + 3.4 | 0.34 |
| Disparity | y = 2.6x + 14.1 | 0.49 | y = −0.15x2 + 7.5x + 3.8 | 0.63 |
| Blur + Disp | y = 3.2x + 11.4 | 0.69 | y = −0.32x2 + 6.0x + 6.6 | 0.70 |
| Vergence Acceleration | ||||
|---|---|---|---|---|
| linear | R2 | polynomial | R2 | |
| Aligned | y = 9.4x + 53.7 | 0.35 | y = 0.62x2 + 12.2x + 49.0 | 0.39 |
| Monoc Line | y = 3.0x + 61.4 | 0.10 | y = −1.1x2 + 13.5x + 38.8 | 0.16 |
| Binoc Line | y = 8.6x + 80.2 | 0.11 | y = −1.1x2 + 19.2x + 49.3 | 0.12 |
| Disparity | y = 23.0x + 171.3 | 0.23 | y = −7.6x2 + 94.0x + 52 | 0.26 |
| Blur + Disp | y = 26.6x + 155.0 | 0.30 | y = −6.5x2 + 77.4x + 78.6 | 0.34 |
Accommodation dynamics and dynamic AC/A
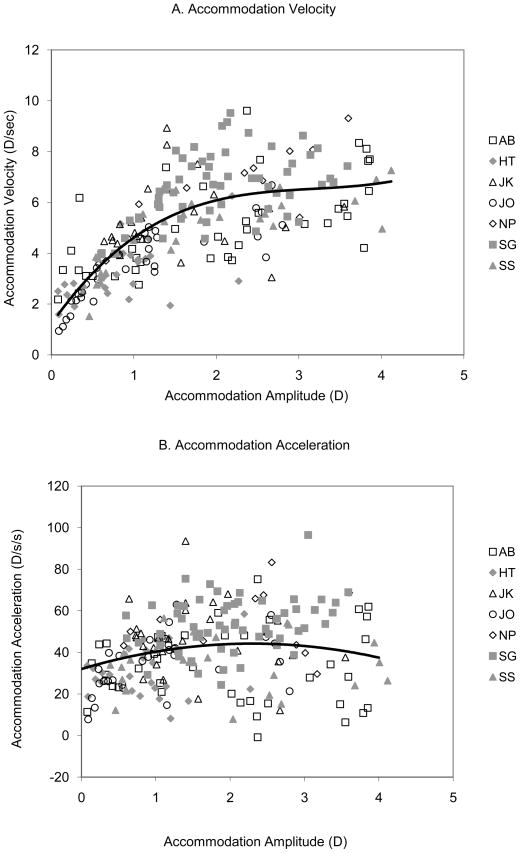
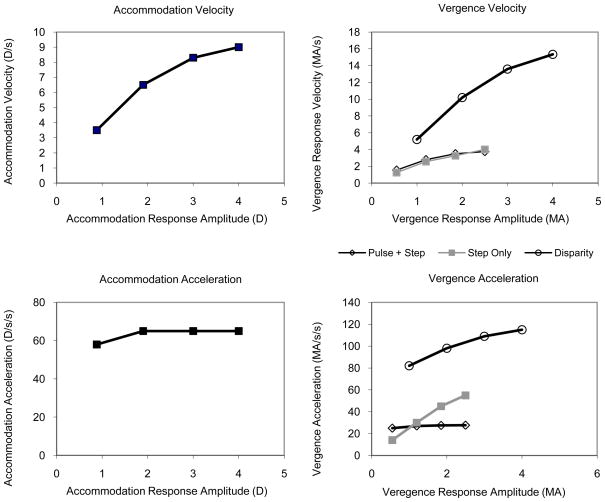
Accommodation was measured only in the Aligned paradigm where the left eye remained nearly stationary with respect to the optometer. Peak accommodation velocity is best fit with a non-linear function as has been observed by others (Kasthurirangan, Vilupuru & Glasser, 2003; Kasthurirangan & Glasser, 2006). Accommodation velocity was plotted as a function of accommodation response for each subject and these data were fit by third order polynomial equations. A mean equation was calculated for the six subjects taken together and is illustrated in Figure 6A. Peak accommodation velocity = 0.15x3 − 1.41x2 + 4.6x + 1.21, R2 = 0.55). Velocity began to saturate at response amplitudes of about 1.0 diopters and a velocity of 4.5 D/sec and then increased more slowly to a maximum of approximately 7 D/sec at a response amplitude of 4 diopters. The change in acceleration with accommodative amplitude, on the other hand, was nearly flat across response amplitudes (Fig. 6B; peak accommodation acceleration = −4.4x2 + 20.5x + 24, R2 = 0.13) as has been shown previously (Bharadwaj and Schor, 2005)
Figure 6.
Accommodation velocity (A) and acceleration (B) for the Aligned trials for seven subjects (different symbols). A polynomial was fit to each subject’s data and the coefficients were averaged to obtain a mean polynomial equation. The accommodation velocity data were fit with a third order polynomial and the acceleration data were fit with a second order polynomial.
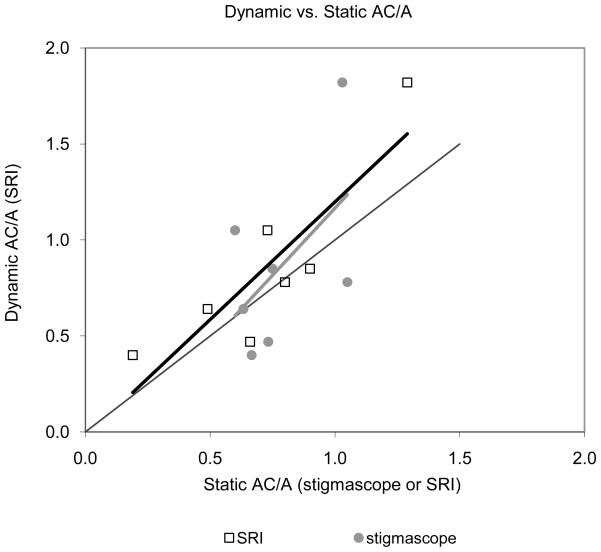
Dynamic response AC/A ratio is defined as the slope of the function relating peak vergence velocity (in meter angles per second) to peak accommodation velocity (diopters per second) for the data obtain from Aligned trials. The slope ranged from 0.4 to 1.8 meter angles of vergence per diopter of accommodation with a mean of 0.86 for the seven subjects. We compared the dynamic AC/A ratio to the static response AC/A ratio as obtained with the stigmascope. We also calculated a static AC/A ratio from the Aligned data by taking the ratio of the vergence amplitude and accommodation amplitude for each trial. The difference between the two static measurements is that the response AC/A measured subjectively on the stigmascope was a true static measurement where the subject had focused the target as well as possible before the measurement was taken whereas in the measurement with the SRI the vergence and accommodation amplitudes were taken as the change in amplitude from the onset to the offset of the movement as determined by the criteria given in Methods. We were only interested in measuring the initiation of the eye movements and changes in accommodation and not the changes in dynamics that may have occurred later in the trial when visual feedback would have played a role. The static AC/A functions taken from the SRI data therefore are sometimes derived from incomplete movements. The two methods of measuring the static AC/A, nevertheless, gave comparable results when compared to the dynamic AC/A (Figure 7). Each point in Figure 7 represents the data of one subject for each of the two methods, stigmascope (circles) or SRI (squares). While there is a fair amount of scatter in the data due to the small sample size, the slopes of the linear regressions were similar (1.22 for the SRI measurements and 1.40 for the stigmascope measurements). The dynamic AC/A appeared slightly higher than the static AC/A although with such a small sample size a statistical analysis would not be meaningful.
Figure 7.
Dynamic AC/A ratio as a function of static AC/A ratio for each subject as measured by the stigmascope (circles) or the Purkinje eye tracker (squares). All AC/A values are response ratios.
Control Experiment
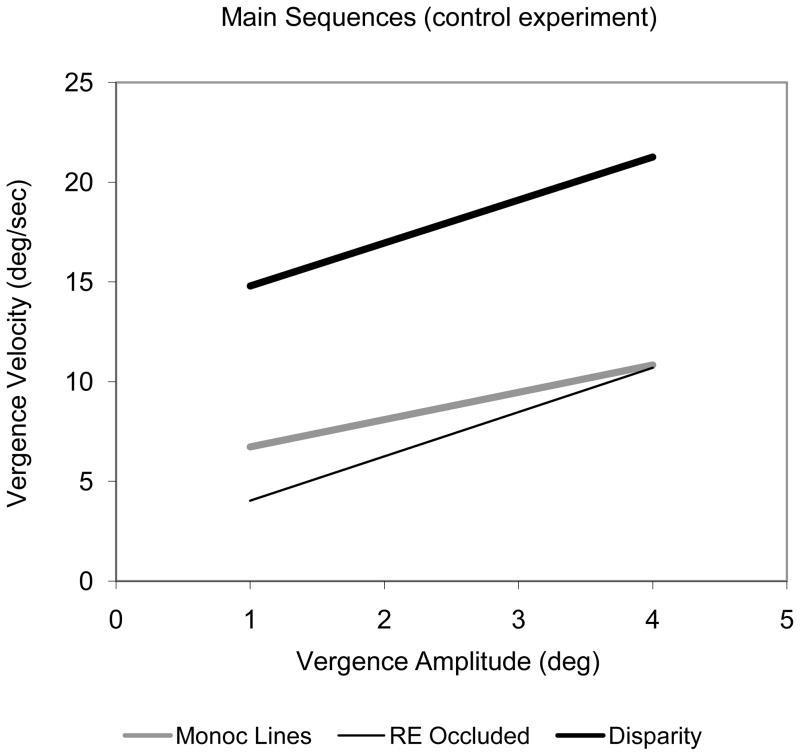
Semmlow and Venkiteswaran (1976) suggested that disparity vergence might slow the dynamics of accommodative vergence when the two modalities occurred simultaneously. They tested this hypothesis by testing accommodative vergence with and without a period of binocular viewing at the beginning of each trial. In the first case, one eye was occluded throughout the experiment. In the other case, the subject viewed the target binocularly and at a random time one eye was occluded at the same time as a step in defocus. The hypothesis was that the slow decay of the disparity vergence integrator would mean that disparity vergence would continue to inhibit the accommodative vergence response even though one eye was occluded during the step in blur. They presented preliminary data in one subject that seemed to support this idea wherein the averaged position traces appeared to have a greater velocity when the stimulus was presented without prior binocular viewing. In all of the experiments described thus far, our subjects viewed the targets binocularly before pressing the button to initiate the test sequence in order to prevent them from adapting their phorias over the course of the experiment. To test the possibility that the decrease in vergence velocity observed in accommodative vergence was due to inhibition by the persistence of an internal disparity signal, it was necessary to test the subjects without presenting the targets binocularly before the button press. To accomplish this, we occluded the right eye so that the subjects were monocular throughout each block of 24 trials. The subjects viewed the room binocularly between blocks of trials and two blocks were run for each condition. Three subjects were tested in sessions that were separate from the main body of data collection presented above. Each subject was tested with Monocular Lines, Disparity Vergence and Control trials. None showed an obvious difference between Monocular Lines trials and the Control trials and the peak velocities of both were much less than the Disparity Vergence trials (Figure 8).
Figure 8.
Average vergence velocity for three subjects for the three conditions of the control experiment. Monocular H. Line trial (solid gray line) and Disparity trial data (solid black lines) were measured as before and Control trials (stippled line) were measured with the right eye constantly occluded.
Modeling
The present study illustrates several newly described properties of the dynamic response of disparity vergence and accommodative vergence. The peak velocity of accommodative vergence was lower than the peak velocity of disparity vergence when response amplitudes were equal. The slope of the main sequence is much higher in disparity vergence than in accommodative vergence. The peak acceleration of both disparity and accommodative vergence increased with response magnitude, in contrast to the relatively constant peak acceleration for accommodation with response amplitude. The dynamic and static measures of the AC/A ratio were similar in magnitude. In addition we replicated the longer latency for accommodation than accommodative vergence (Wilson, 1973; Schor & Lott, 1999).
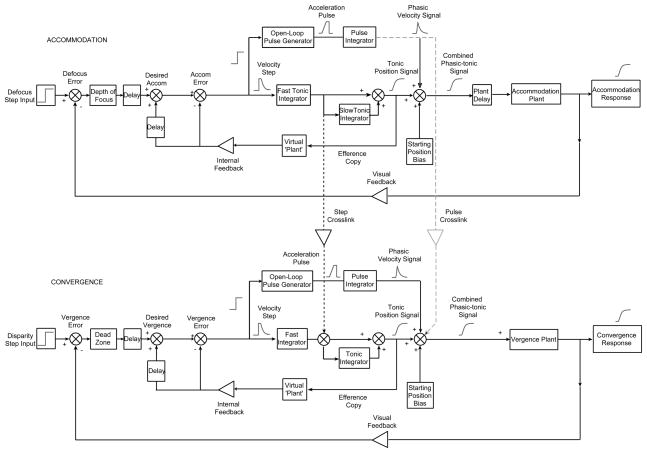
These results were interpreted with a dynamic model (Figure 9) following the architecture of a pulse-step model of accommodation developed by Bharadwaj and Schor (2005) and a model of cross-coupling interactions developed by Schor and Kotulak (1986; Schor, 1992). The pulse-step model of dynamic accommodation (upper panel in Figure 9) proposes that the first and second order dynamics of the accommodative step response are determined by the slope and width of a constant amplitude pulse signal generated in the open-loop circuit, and that the response amplitude is determined by a variable amplitude step signal in a negative feedback close-loop circuit. A similar pulse-step model is constructed for convergence response (lower panel in Figure 9).
Figure 9.
Pulse-step model for accommodation and vergence. The dashed lines indicate two sites where signals from the accommodation system may cross over to drive the vergence system. .See text for details.
Accommodation Model
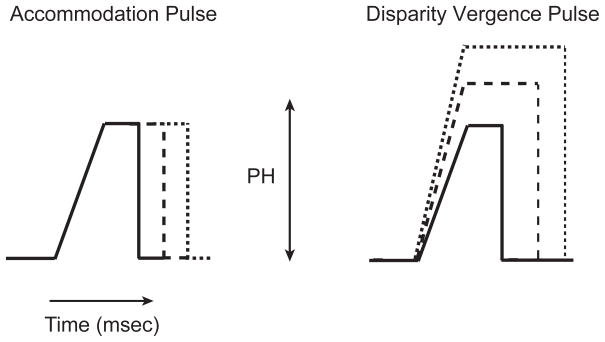
The pulse for both accommodation and vergence has both plateau and ramp components that independently control velocity and acceleration respectively with response size (Fig. 10). The pulse signal for accommodation ramps up to a plateau with a constant time of 133 ms and plateau width increases with response size (Fig. 10A). Therefore, the constant ramp produces a fixed acceleration as response size increases. The acceleration-pulse is transformed by a phasic integrator to a phasic-velocity signal that increases in magnitude with increasing pulse width and response size (Schor & Bharadwaj, 2005, 2006). Peak velocity will increase linearly with response size and the width of the acceleration-pulse as long as the pulse duration is less than the rise time of the phasic integrator. At larger response amplitudes, when pulse duration exceeds the rise time of the phasic integrator, peak velocity will saturate (Schor and Bharadwaj, 2005). This saturation effect appears in the empirical data shown in Figure 6A. The longer latency for accommodation than accommodative vergence was modeled as an additional 100 ms plant delay..
Figure 10.
Pulse signals for the feed-forward loops for accommodation and vergence labeled “acceleration pulse” and “disparity vergence pulse”, respectively, in Figure 9.
Disparity Vergence Model
The model parameters for disparity vergence were adjusted to produce a main sequence that represented the trends observed in the empirically measured disparity vergence responses. First and second order dynamics of disparity vergence both increased with response size and they were modeled by varying the height and width of the pulse signal with response size (Fig. 10B). In contrast, the fixed height and variable width of the pulse signal for accommodation (Fig. 10A), produced constant acceleration with increases in velocity with response size. The slope of the ramp could represent the rate of burst cell recruitment, pulse width could represent duration of burst cell activity and increased pulse height could be due to both increased firing rates and recruitment rate of burst cells.
Cross-link Model
The locations of crosslink interactions between accommodation and convergence are consistent with the adaptation response of slow-tonic vergence to accommodative convergence inputs, and the adaptation response of slow-tonic accommodation to convergence accommodation inputs (Schor & Kotulak, 1986). This adaptive property is modeled by merging the crosslinks prior to the slow-tonic adapters. The dynamic cross-coupling model by Schor and Kotulak did not have the pulse component of the dynamic model for accommodation by Schor and Bharadwaj, leaving open the question of which components (pulse and/or step) are linked between the two systems. We performed model simulations of main sequence curves for velocity and acceleration of accommodative convergence and compared them with the empirical data to identify the cross-coupled sources passed from accommodation.
Model simulations of main sequence plots of velocity and acceleration as a function of response size were run for the same range of stimuli used for the empirical plots. Simulations were run for accommodation, disparity vergence and accommodative vergence. Accommodative vergence was simulated in two ways. The first was to pass only the step innervation of accommodation from a point prior to the adaptable slow-tonic integrator of accommodation to the slow-tonic integrator of the vergence system (Fig. 9, dashed line labeled “step crosslink”). Simulations were also run with both the pulse and step signals of accommodation passed to the vergence system (Fig. 9; dashed lines labeled “step crosslink” and “pulse crosslink”). The pulse innervation from accommodation was input directly before the vergence plant in Figure 9. The main sequence simulations for accommodation reflect the trends of increasing velocity and relatively constant acceleration with the amplitude of the accommodative response (Figs. 11A & B). The main sequence simulations for disparity vergence illustrate the trends of increasing velocity and acceleration with increasing disparity step size (Figs. 11C & D).
Figure 11.
Pulse-step model simulations of accommodation and vergence main sequences. Symbols in C also pertain to figure D.
Velocity Simulations and Dynamic AC/A ratio: The main sequence simulations for both crosslink models produced similar velocities to those in the empirical data. The ratio of accommodative-convergence velocity and its corresponding accommodation velocity (e.g. velocity for 2.4MA convergence-accommodation/4D accommodation = 5.5MA/s/8.5D/s or 0.6 MA/D) approximated the static AC/A ratio which was 0.66 MA/D. The velocity of both cross-link models increased with response size at the same rate and, similar to the empirical data, accommodative vergence velocity increased at one third the rate of disparity vergence velocity with response amplitude (Fig 11C).
Acceleration Simulations
The main sequence simulations of accommodative vergence acceleration for the crosslink originating from the combined pulse and step innervation matched the empirical data better than the step-only model (Figs. 11D, squares). Similar to the empirical data, acceleration for the combined pulse-step crosslink increased with response size at one third the rate as for disparity vergence. Unlike the empirical data, acceleration of the step-only model increased at the same rate as for disparity vergence Thus the factor that discriminates between the two dynamic crosslink models is the main sequence plot for acceleration which supports the crosslink interactions between the combined step and pulse components of the accommodative system with vergence.
DISCUSSION
Dynamic accommodative vergence requires simultaneous measures of accommodation and vergence; however, movements of the eye can make measures of dynamic accommodation difficult. We measured accommodation and vergence simultaneously during Aligned trials. Initially, we were concerned that the process of holding the viewing eye still during Aligned trials would affect vergence dynamics and that is one reason why symmetrical accommodative vergence trials were performed. We also wished to test the difference between monocular and binocular stimulation of accommodative vergence. For most subjects, vergence dynamics were similar for trials where the virtual near and far targets were aligned with the left eye and for trials where the targets were presented in the midsagittal plane. Likewise, there seemed to be little effect on whether one or both eyes viewed the target.
Our decision to eliminate trials containing saccades from the analysis was based on the need to keep one eye lined up with the optometer. In addition, because there is a positive relationship between saccade magnitude and peak vergence velocity (Collewijn, Erkelens & Steinman, 1995; Maxwell & King, 1992) we would have had to bin trials by both saccade magnitude and by accommodation response magnitude that would have required a significant increase in the amount of data collected for each subject. In the present experiment, we removed approximately one-fourth of the trials because they contained saccades. It is important to note, however, that removing trials with saccades precludes a complete picture of natural vergence dynamics since saccades may normally used to speed up both vergence and accommodation responses (Schor et al., 1999). This is especially true for asymmetrical disparity vergence where eye movements usually consist of vergence movements combined with saccades. Whether or not saccades are programmed to be asymmetrical is controversial (Mays, 1998) but it is instructive to note that vergence velocity can be facilitated by saccades even in the absence of horizontal disparities (Wick & Bedel, 1989).
By averaging saccade-free traces together for a given stimulus size (Figure 2) we were able to obtain accurate measurements for the relative latencies of accommodation and accommodative vergence. We have refrained from reporting the onset latencies relative to target onset since our trials were predictable in direction. It may seem somewhat odd that accommodation drives vergence yet vergence leads accommodation by some 100 to 115 msec but this can be accounted for by the relatively slow dynamics of the accommodation plant as first surmised by Wilson (1973). As it turns out, there is direct evidence to support this hypothesis. Judge and Cumming (1986) electrically stimulated the near-response neurons of the supraoculomotor area in monkeys which drive both vergence and accommodation. These cells project directly to oculomotor neurons and to neurons in the Edinger-Westphal nucleus. Stimulation resulted in vergence latencies that led accommodation by approximately 90 msec.
Our main sequence analysis showed a marked difference between the dynamics of accommodative vergence and disparity vergence. The slopes of the main sequences for vergence velocity averaged 1.5 for the three accommodative vergence paradigms, 2.9 for the two disparity vergence paradigms. This result is in accordance with the frequency analysis of sinusoidal data in monkeys which showed that both accommodation and accommodative vergence had higher velocities when both blur and disparity cues were present than with blur cues alone (Cumming & Judge, 1986).
Hung and his collaborators (Hung et al., 1994) constructed main sequences of disparity vergence for three subjects under “free space” using real targets and “instrument space” using a haploscope. Targets in real space had blur cues that changed with distance whereas the targets in the haploscope did not. A prior paper had shown that the addition of blur did not matter when disparity was present (Hung et al., 1983) and our results support that finding in that the responses to Disparity + Blur trials were virtually identical to Disparity Only trials. Hung et al. (1994) did not do a quantitative comparison of the main sequences for the eight different conditions they examined but demonstrated that their results and the results of other labs fell within the 95% confidence interval of their instrument space paradigm. The main sequence slopes of our disparity data also fell within this 95% confidence interval although the average slope for our subjects was somewhat less (3.0 vs. 4.0). A subsequent paper from Hung’s laboratory (Hung, Zhu & Ciuffreda, 1997) gave an average disparity vergence slope of 4.99. Our acceleration data for accommodation and accommodative vergence required a rather aggressive filter in order to reduce the noise for individual trials which may have decreased the peak velocities and accelerations. To test the effect of the filter, we used averaging techniques (as in Figure 2) and less heavy filtering. Based on this, we estimate that velocities could have been 10–15% higher than reported. The smoothing filters did not affect the slopes of the main sequences, however, nor would they have affected the relative measurements between paradigms.
In contrast to the present study showing a marked difference between blur-driven (indirectly through the crosslinks) and disparity-driven vergence, Suryakumar et al. (2007) found similar dynamics for blur-driven and disparity-driven (indirectly through the crosslinks) accommodation. This might indicate that accommodation dynamics is determined primarily by the slow dynamics of the plant. The accommodation dynamics measured in our Aligned paradigm is difficult to compare to the values measured by Suryakumar and collaborators. Blur driven accommodation in their study had a main sequence slope of 2.5 whereas in the present study the slope was 1.2 if it were fit with a linear equation. However, our results showed that these data were better fit with a nonlinear equation such as a polynomial (Fig. 6A) and the slope of a linear fit would depend on the range of blur stimuli used. Our data (Figure 6A) are very similar quantitatively and qualitatively to the comparable plot shown by Kasthurirangan & Glasser (2006) for young subjects (their Figure 8B). The small difference could be due to differences in subjects’ ages between theirs (mean of 22.6 years) and ours (mean of 25 years), to different filtering techniques, or variation of means due to small sample sizes.
Peak vergence acceleration varied little over the range of amplitudes used especially for accommodative vergence. The mean slope for the three types of accommodative vergence trials was approximately 7 deg/sec2 and the slope for the two types of disparity vergence trials was approximately 25 deg/sec2 when fit by linear regression. An additional increase in acceleration between accommodative vergence and disparity vergence was due to an overall increase in acceleration for disparity vergence trials (a change in the intercept of the main sequence for acceleration) rather than a change in slope. The mean intercept for the accommodative vergence trials was 65 deg/sec2 and the mean intercept for the disparity vergence trials was 163 deg/sec2. The direction of vergence was predictable in our trials even if the amplitude was not which, according to a recent study, would tend to increase the magnitude of acceleration somewhat (Alvarez, Semmlow, Yuan & Munoz, 2002). Alvarez et al. only measured vergence acceleration for 4 degree disparity vergence movements. Our data fell within the range of values measured for their subjects (174–430 deg/sec2 with a mean of 309 deg/sec2). The average acceleration for our subjects for a 4 degree vergence movement was 246 deg/sec2. The differences in the main sequence plots for accommodation and accommodative convergence provided a means for distinguishing between two models of the dynamic crosslink interactions between accommodation and convergence. The results are consistent with the crosslink interaction between both the step and pulse components of the accommodative system with the vergence controller.
We would not expect the responses in the Blur + Disparity trials to equal the sum of the responses from accommodative vergence and disparity vergence trials because of negative feedback, that is, vergence accommodation would reduce the accommodative error signal (i.e. blur) that drives vergence and accommodative vergence would reduce the input to the vergence controller. The possibility also exists that in the presence of both cues, one cue would take precedence over the other, for example, the desired vergence angle might be determined solely by horizontal disparity when both the disparity and blur cues are available and there was some support for this idea in the literature (Semmlow & Venkiteswaren, 1976). Those authors thought that the disparity vergence cue might suppress accommodative vergence even during monocular stimulation if the subject first viewed the target binocularly because of the persistence of the disparity vergence signal due to the slow vergence integrator. The two cues would be in conflict since the blur cue would be signaling a change in distance and the disparity vergence controller would be signaling no change in distance. We tested this idea with our Control trials but did not find a difference between trials that were preceded by binocular viewing and trials in which viewing was always monocular. This result does not exclude the possibility of a winner take all strategy for vergence when the two cues conflict. Normally, the two cues are in accord and when both cues are present, it may be as Hung et al. (1983) have suggested, i.e., that disparity vergence is largely responsible for the initiation of the response and accommodative vergence contributes toward the end of the vergence movement. Our experiments were not designed to further test this notion and we only measured vergence dynamics for the initial vergence movement.
Acknowledgments
This work was supported by National Eye Institute Grant EY017678
Footnotes
Publisher's Disclaimer: This is a PDF file of an unedited manuscript that has been accepted for publication. As a service to our customers we are providing this early version of the manuscript. The manuscript will undergo copyediting, typesetting, and review of the resulting proof before it is published in its final citable form. Please note that during the production process errors may be discovered which could affect the content, and all legal disclaimers that apply to the journal pertain.
References
- Alpern M, Ellen P. A quantitative analysis of the horizontal movements of the eyes in the experiment of Johannes Mueller. I. Method and results. Am J Ophthalmol. 1956a;42(4 Part 2):289–296. doi: 10.1016/0002-9394(56)90380-4. [DOI] [PubMed] [Google Scholar]
- Alpern M, Ellen P. A quantitative analysis of the horizontal movements of the eyes in the experiment of Johannes Mueller. II. Effect of variation in target separation. Am J Ophthalmol. 1956b;42(4 Part 2):296–303. doi: 10.1016/0002-9394(56)90381-6. [DOI] [PubMed] [Google Scholar]
- Alvarez TL, Semmlow JL, Yuan W, Munoz P. Dynamic details of disparity convergence eye movements. Ann Biomed Eng. 1999;27(3):380–390. doi: 10.1114/1.162. [DOI] [PubMed] [Google Scholar]
- Alvarez TL, Semmlow JL, Yuan W, Munoz P. Comparison of disparity vergence system responses to predictable and non-predictable stimulations. Current Psychology of Cognition. 2002;21(2–3):243–261. [Google Scholar]
- Busettini C, Mays LE. Saccade-vergence interactions in macaques. I. Test of the omnipause Multiply Model. J Neurophysiol. 2005a;94(4):2295–2311. doi: 10.1152/jn.01336.2004. [DOI] [PubMed] [Google Scholar]
- Busettini C, Mays LE. Saccade-vergence interactions in macaques. II. Vergence enhancement as the product of a local feedback vergence motor error and a weighted saccadic burst. J Neurophysiol. 2005b;94(4):2312–2330. doi: 10.1152/jn.01337.2004. [DOI] [PubMed] [Google Scholar]
- Collewijn C, Erkelens CJ, Steinman RM. Voluntary binocular gaze shifts in the plane of regard: dynamics of version and vergence. Vision Research. 1995;35(23/24):3335–3358. doi: 10.1016/0042-6989(95)00082-p. [DOI] [PubMed] [Google Scholar]
- Cumming BG, Judge SJ. Disparity-induced and blur-induced convergence eye movement and accommodation in the monkey. J Neurophysiol. 1986;55(5):896–914. doi: 10.1152/jn.1986.55.5.896. [DOI] [PubMed] [Google Scholar]
- Erkelens CJ, Steinman RM, Collewijn H. Ocular vergence under natural conditions. II. Gaze shifts between real targets differing in distance and direction. Proc R Soc Lond B Biol Sci. 1989;236(1285):441–465. doi: 10.1098/rspb.1989.0031. [DOI] [PubMed] [Google Scholar]
- Hung GK, Ciuffreda KJ, Semmlow JL, Horng JL. Vergence eye movements under natural viewing conditions. Invest Ophthalmol Vis Sci. 1994;35(9):3486–3492. [PubMed] [Google Scholar]
- Hung GK, Semmlow JL, Ciuffreda KJ. Identification of accommodative vergence contribution to the near response using response variance. Invest Ophthalmol Vis Sci. 1983;24(6):772–777. [PubMed] [Google Scholar]
- Hung GK, Zhu H, Ciuffreda KJ. Convergence and divergence exhibit different response characteristics to symmetric stimuli. Vision Res. 1997;37(9):1197–1205. doi: 10.1016/s0042-6989(97)00271-x. [DOI] [PubMed] [Google Scholar]
- Judge SJ, Cumming BG. Neurons in the monkey midbrain with activity related to vergence eye movement and accommodation. Journal of Neurophysiology. 1986;55:915–930. doi: 10.1152/jn.1986.55.5.915. [DOI] [PubMed] [Google Scholar]
- Kasthurirangan S, Glasser A. Age related changes in accommodative dynamics in humans. Vision Res. 2006;46(8–9):1507–1519. doi: 10.1016/j.visres.2005.11.012. [DOI] [PubMed] [Google Scholar]
- Kasthurirangan S, Vilupuru AS, Glasser A. Amplitude dependent accommodative dynamics in humans. Vision Res. 2003;43(27):2945–2956. doi: 10.1016/j.visres.2003.08.004. [DOI] [PubMed] [Google Scholar]
- Kenyon RV, Ciuffreda KJ, Stark L. Binocular eye movements during accommodative vergence. Vision Res. 1978;18(5):545–555. doi: 10.1016/0042-6989(78)90201-8. [DOI] [PubMed] [Google Scholar]
- Kotulak JC, Schor CM. A computational model of the error detector of human visual accommodation. Biol Cybern. 1986;54(3):189–194. doi: 10.1007/BF00356857. [DOI] [PubMed] [Google Scholar]
- Kotulak JC, Schor CM. The effects of optical vergence, contrast, and luminance on the accommodative response to spatially bandpass filtered targets. Vision Res. 1987;27(10):1797–1806. doi: 10.1016/0042-6989(87)90108-8. [DOI] [PubMed] [Google Scholar]
- Maxwell JS, King WM. Dynamics and efficacy of saccade-facilitated vergence eye movements in monkeys. J Neurophysiol. 1992;68(4):1248–1260. doi: 10.1152/jn.1992.68.4.1248. [DOI] [PubMed] [Google Scholar]
- Mays L. Has Hering been hooked? Nat Med. 1998;8:889–890. doi: 10.1038/nm0898-889. [DOI] [PubMed] [Google Scholar]
- Munoz P, Semmlow JL, Yuan W, Alvarez TL. Short term modification of disparity vergence eye movements. Vision Res. 1999;39(9):1695–1705. doi: 10.1016/s0042-6989(98)00206-5. [DOI] [PubMed] [Google Scholar]
- Nguyen D, Vedamurthy I, Schor C. Cross-coupling between accommodation and convergence is optimized for a broad range of directions and distances of gaze. Vision Res. 2008;48(7):893–903. doi: 10.1016/j.visres.2008.01.002. [DOI] [PMC free article] [PubMed] [Google Scholar]
- Schor CM. A dynamic model of cross-coupling between accommodation and convergence: simulations of step and frequency responses. Optom Vis Sci. 1992;69(4):258–269. doi: 10.1097/00006324-199204000-00002. [DOI] [PubMed] [Google Scholar]
- Schor CM, Bharadwaj SR. A pulse-step model of accommodation dynamics in the aging eye. Vision Res. 2005;45(10):1237–1254. doi: 10.1016/j.visres.2004.11.011. [DOI] [PubMed] [Google Scholar]
- Schor CM, Bharadwaj SR. Pulse-step models of control strategies for dynamic ocular accommodation and disaccommodation. Vision Res. 2006;46(1–2):242–258. doi: 10.1016/j.visres.2005.09.030. [DOI] [PubMed] [Google Scholar]
- Schor CM, Kotulak JC. Dynamic interactions between accommodation and convergence are velocity sensitive. Vision Res. 1986;26(6):927–942. doi: 10.1016/0042-6989(86)90151-3. [DOI] [PubMed] [Google Scholar]
- Schor CM, Lott LA, Pope D, Graham AD. Saccades reduce latency and increase velocity of ocular accommodation. Vision Res. 1999;39(22):3769–3795. doi: 10.1016/s0042-6989(99)00094-2. [DOI] [PubMed] [Google Scholar]
- Semmlow J, Venkiteswaran N. Dynamic accommodative vergence components in binocular vision. Vision Res. 1976;16(4):403–410. doi: 10.1016/0042-6989(76)90204-2. [DOI] [PubMed] [Google Scholar]
- Semmlow J, Wetzel P. Binocular contributions of the dynamics of accommodative vergence. J Opt Soc Am. 1979;69(5):639–645. doi: 10.1364/josa.69.000639. [DOI] [PubMed] [Google Scholar]
- Semmlow JL, Hung G. Accommodative and fusional components of fixation disparity. Invest Ophthalmol Vis Sci. 1979;18(10):1082–1086. [PubMed] [Google Scholar]
- Semmlow JL, Hung GK, Horng JL, Ciuffreda K. Initial control component in disparity vergence eye movements. Ophthalmic Physiol Opt. 1993;13(1):48–55. doi: 10.1111/j.1475-1313.1993.tb00426.x. [DOI] [PubMed] [Google Scholar]
- Suryakumar R, Meyers JP, Irving EL, Bobier WR. Vergence accommodation and monocular closed loop blur accommodation have similar dynamic characteristics. Vision Res. 2007;47(3):327–337. doi: 10.1016/j.visres.2006.10.006. [DOI] [PubMed] [Google Scholar]
- Tsuetaki TK, Schor CM. Clinical method for measuring adaptation of tonic accommodation and vergence accommodation. Am J Optom Physiol Opt. 1987;64(6):437–449. doi: 10.1097/00006324-198706000-00009. [DOI] [PubMed] [Google Scholar]
- Wick B, Bedell HE. Magnitude and velocity of proximal vergence. Invest Ophthalmol Vis Sci. 1989;30(4):755–760. [PubMed] [Google Scholar]
- Wilson D. A centre for accommodative vergence motor control. Vision Res. 1973;13(12):2491–2503. doi: 10.1016/0042-6989(73)90246-0. [DOI] [PubMed] [Google Scholar]
- Zee DS, Fitzgibbon EJ, Optican LM. Saccade-vergence interactions in humans. J Neurophysiol. 1992;68(5):1624–1641. doi: 10.1152/jn.1992.68.5.1624. [DOI] [PubMed] [Google Scholar]


