

Abstract
In comparing purified mouse olfactory sensory neurons (OSNs) with neighboring cells, we identified 54 differentially expressed transcripts. One-third of the transcripts encode proteins with no known function, but the others have functions that correlate with challenges faced by OSNs. The OSNs expressed a diversity of signaling protein genes, including stomatin (Epb7.2), S100A5, Ddit3, Sirt2, CD81, Sdc2, Omp, and Ptpla. The elaboration of dendrites, cilia, and axons that places OSNs in contact with diverse cell types and signals presumably also requires large investments in cytoskeletal-associated proteins, lipid biosynthesis, and energy production. Several of the genes encode proteins that participate in these biological processes, including ATP5g3, Ndufa9, Sqrdl, Mdh1, Got1, β-2 tubulin, Capza1, Bin3, Tom1, Acl6, and similar to O-MACS. Three transcripts had restricted expression patterns. Similar to O-MACS and Gstm2 had zonally restricted expression patterns in OSNs and sustentacular cells but not in Bowman’s glands, suggesting that zonality can be differentially regulated by cell type. The mosaic expression pattern of S100A5 in approximately 70% of OSNs predicts that it is coexpressed with a subset of odorant receptors. We captured four abundant transcripts, Cyp2a4, similar to Cyp2g1, Gstm2, and Cbr2, that encode xenobiotic metabolizing enzymes expressed by sustentacular cells or Bowman’s glands, reinforcing the interpretation that clearance of xenobiotic compounds is a major function of these cells. Within the olfactory epithelium, Cbr2 is a new anatomical marker for sustentacular cells. We also discovered that Reg3g is a marker for respiratory epithelium.
Indexing terms: smell, flow cytometry, expression profiling, sustentacular cells, xenobiotic metabolism
The unique role of the olfactory system in detecting and interpreting odors is supported by a large number of genes whose expression is rarely observed outside of olfactory sensory neurons (OSNs). The rich history of olfactory-specific gene products began with olfactory marker protein (OMP) and includes odorant receptors (ORs) and olfactory transduction components (Margolis and Tarnoff, 1973; Bakalyar et al., 1989; Jones and Reed, 1989; Dhallan et al., 1990; Buck and Axel, 1991). The search for additional olfactory-specific gene products continues (Genter et al., 2003; Oka et al., 2003; Tietjen et al., 2003), driven by recognition of olfactory-specific functions whose controlling proteins have not been fully identified.
Olfactory-specific processes that remain poorly understood include OR gene choice, the zonal pattern of OR expression, OSN axon convergence to glomeruli, and OR trafficking (McClintock and Sammeta, 2003; Mombaerts, 2004). The expression of ORs is controlled by small regions upstream of OR coding sequences (Vassalli et al., 2002; Serizawa et al., 2003; Lewcock and Reed; 2004). DNA elements within them must specify the monogenic, zonal expression patterns of ORs. The O/E element is common to the promoters of many olfactory-specific genes, such as ORs, but the O/E transcription factors are not restricted to the olfactory system (Walters et al., 1996; Wang et al., 1997, 2004; Kudrycki et al., 1998; Vassalli et al., 2002). Therefore, the O/E transcription factors probably contribute only one component of a control mechanism that has yet to be elucidated. Once an OR gene is selected for expression, it determines the identity of the OSN and is responsible for the exclusivity of OSN axon convergence (Serizawa et al., 2003; Feinstein et al., 2004; Lewcock and Reed; 2004; Mombaerts, 2004). In contrast, other aspects of OSN axon targeting are sensitive to certain signpost molecules, extracellular matrix proteins, and signaling mechanisms generally involved in axon outgrowth in the nervous system (Morse et al., 1998; Knoll et al., 2001; St. John et al., 2002; Walz et al., 2002; Ang et al., 2003; Cutforth et al., 2003; Hummel et al., 2003; Lipscomb et al., 2003; Treloar et al., 2003). The ability of the ORs to control OSN axon convergence implies that trafficking of OR proteins to both the cilia and the axons of OSNs must occur (Barnea et al., 2004; Feinstein et al., 2004). The mechanisms of OR trafficking appear to be complex, are specific to OSNs, may be developmentally regulated, and are predicted to involve accessory proteins that interact with ORs (Gimelbrant et al., 1999, 2001). These predictions are supported by analogies to the trafficking of a subset of nematode ORs and of mammalian V2R vomeronasal receptors (Dwyer et al., 1998; Loconto et al., 2003). Both cases involve regulatory accessory proteins that are specific to the sensory neurons expressing the receptors. All of the processes described in this paragraph probably derive their specificity from one or more component proteins that are olfactory specific.
The work described herein was motivated by our interest in olfactory-specific processes and by the expectation that identification of olfactory-enriched gene products would provide insight into the biology of the olfactory epithelium. When performing gene expression studies in a complex tissue such as the olfactory epithelium, increased resolution can be obtained by comparing gene expression in phenotypically identified cell populations. Such comparisons also facilitate the identification of biological processes associated with the cell types investigated. We used fluorescence-activated cell sorting (FACS) to purify OSNs from OMP-LacZ3 mice, which express β-galactosidase (LacZ) only in mature OSNs (Walters et al., 1996). To increase our chances of detecting novel transcripts with unknown functions, we used an expression profiling method that is unbiased toward prior knowledge about sequence. We identified 54 transcripts that were enriched in the LacZ+ pool compared with the LacZ− pool and characterized their expression patterns in the olfactory epithelium.
MATERIALS AND METHODS
β-Gal staining and FACS
Homozygous OMP-LacZ3 trangenic mice, which express LacZ from the OMP promoter, were obtained from Dr. Frank Margolis, University of Maryland. Whole-mount staining was performed by using a β-Gal staining kit (Invitrogen, Carlsbad, CA) according to the manufacturer’s protocol. The staining was performed on dissected heads of mice, ages postnatal days 10 –19 (P10 –P19). All tissue collections such as these were from mice that had been killed by carbon dioxide overdose.
Preparing cells for FACS was carried out by dissecting the turbinates and septal epithelium from 20 P9 –P11 OMP-LacZ3 mice taken from three litters of different mothers. The olfactory turbinates and septal epithelium from a mouse were removed and separated into three drops of fresh oxygenated saline [contains (in mM): 120 NaCl, 25 NaHCO3, 5 KCl, 5 BES, 1 MgSO4, 1 CaCl2, 10 glucose] in a 35-mm petri dish. The tissue in each drop was minced with a scalpel and pooled with tissue from two to four other mice. Cell dissociation involving the use of papain, deoxyribonuclease, low calcium, and mild trituration was then performed as described previously for vomeronasal sensory neurons (Lucas et al., 2003). Cells were incubated with 2 mM fluorescein digalactoside (Molecular Probes, Eugene, OR) for 3 minutes at room temperature, and then the reaction was stopped by 10 volumes of fresh oxygenated saline. The stained cells were filtered (35-μm sieve size) into 5-ml polystyrene filter cap tubes (No. 352235; Falcon, Marlton, NJ). Propidium iodide was added to label dead cells, and FACS was performed on a Cytomation MoFlo cell sorter by the University of Kentucky Flow Cytometer Service Facility. Cells stained with propidium iodide were discarded. LacZ+ cells (green fluorescence) and LacZ− cells (nonfluorescent) were collected into 5-ml polystyrene tubes (Falcon No. 352063) containing 1 ml Tri-Reagent on ice. Upon completion of sorting, another 1 ml of Tri-Reagent was added to each tube, and the solutions were mixed on a vortex mixer. The LacZ+ pool contained 6.96 × 10⁵ cells, and the LacZ− pool contained 2.16 × 10⁶ cells.
RNA isolation and cDNA preparation
Total RNA was extracted from the Tri-Reagent according to the manufacturer’s protocol (Molecular Research Center, Cincinnati, OH). Poly-A(+) RNA was isolated by two passes through Oligotex columns as described by Hubank and Schatz (1999). Complementary DNA was synthesized by using the Smart PCR cDNA synthesis kit (No. K1052-1; BD BioScience, Palo Alto, CA).
Representational difference analysis of cDNA
Representational difference analysis (RDA) of cDNA was performed exactly as described by Hubank and Schatz (1994, 1999), with LacZ+ and LacZ− cDNA as tester and driver, respectively. RDA of cDNA is an iterative procedure that establishes polymerase chain reaction (PCR) conditions favoring the amplification of cDNAs enriched in the tester population. Its stringency can be adjusted in several ways. Our preference is to perform the RDA of cDNA as originally designed but to stop after two rounds of amplification. This allows detection of cDNAs whose differences in abundance are as small as twofold (Hollins et al., 2003). To obtain more differentially expressed transcripts from the LacZ+ cDNA, the original 42 clones from the second difference product were added to the driver cDNA, and the RDA of cDNA was repeated.
RDA clones were sequenced and compared by BLAST against nucleotide and protein databases to identify them. Functional information about encoded proteins was gathered from primary literature, from UniProt (http://www.pir.uniprot.org/), and from Gene Ontology categorizations accessed through the National Center for Biotechnology databases, such as Entrez (http://www.ncbi.nlm.nih.gov/entrez).
Quantitative reverse transcriptase-PCR
Primers were designed by using Primer Express software (Applied Biosystems, Foster City, CA) with a melting temperature of 58 – 60°C and were purchased from Integrated DNA Technologies (Coralville, IA). Reverse transcription was performed on 0.5 μg of total RNA by using SuperScript II and random hexamers (Invitrogen) in a 50-μl reaction. Complementary DNA from olfactory epithelium of OMP-LacZ3 mice was used as the template for standard curves. Samples for quantitation were measured in triplicate. To accommodate the large differences in the amount of most transcripts between the LacZ+ and LacZ− pools, 0.1 ng of LacZ+ and 0.5 ng of LacZ− cDNA per reaction were used. Amplification was performed in an ABI Prism 7700 sequence Detection System using the Sybr Green Core Reagent Kit (Applied Biosystems). Thermal cycler conditions were 95°C for 15 minutes, followed by 45 cycles of 95°C for 15 seconds, 60°C for 1 minutes. Melt curves were performed on all samples. The glyceraldehyde 3-phosphate dehydrogenase content of each cDNA preparation was measured and used to normalize the amount of RNA in each sample.
In situ hybridization
OMP-LacZ3 mice, aged P17–P24, were anesthetized with avertin and perfused intracardially with 10 ml of ice– cold 4% paraformaldehyde in 1× phosphate-buffered saline (PBS), pH 7.4. The head was removed and skinned. The mandibles, posterior half of the cranium, teeth, and soft palate were then removed. The remaining “snout” was soaked overnight in 4% paraformaldehyde in PBS at 4°C on a nutator, decalcified for 24 hours in 500 mM EDTA (pH8.0) in PBS, and cryoprotected by soaking in 10% sucrose in PBS for 1 hour at 4°C, in 20% sucrose in PBS for 1 hour at 4°C, and in 30% sucrose in PBS for at least 3 hours at 4°C. The tissue was then embedded in O.C.T. compound (Sakura Finetek USA, Inc., Torrance, CA), frozen in an EtOH/dry ice bath, and stored at − 80°C. Coronal sections of 10 μm thickness were cut on a cryostat. In situ hybridization (ISH) and dual fluorescence in situ hybridization (FISH) were performed as described by Hirota et al. (1992). Sense and antisense RNA probes were transcribed with a MAXIscript kit (Ambion Inc., Austin, TX) and labeled with a digoxygenin labeling kit (Roche, Palo Alto, CA). The concentration of probes in the hybridization was 1 ng/μl for ISH and 0.1– 0.4 ng/μl for dual FISH. The sizes of probes from RDA clones ranged from 158 to 497 bp. For some low-abundance transcripts, simultaneous hybridization with two or three probes derived from separate regions of the same transcript, sizes ranging from 311 to 565 bp, was performed. Wide-field images of ISH labeling were acquired with a Spot 2e digital camera mounted on a Nikon Diaphot 300 inverted microscope. Laser scanning confocal images of dual FISH experiments were acquired on a Leica TCS confocal system at the University of Kentucky Imaging Facility. Images were processed by adjusting size, brightness, contrast, and the consistency of illumination in Adobe Photoshop or Deneba Canvas. All procedures using mice describe herein were approved by our Institutional Animal Care and Use Committee and conformed to NIH guidelines.
RESULTS
Transcripts enriched in a pool of purified OSNs
OMP-LacZ3 mice specifically express LacZ in the OSNs (Fig. 1), allowing discrimination of OSNs from other cells in the tissue (Walters et al., 1996). We took advantage of this to label viable OSNs with fluorescence and used FACS to separate them away from the other cells in the olfactory epithelium. Approximately 15% of the cells sorted were viable cells with fluorescence intensities surpassing those of cells from littermates. We collected both fluorescent (LacZ+) and nonfluorescent (LacZ−) pools of cells and isolated poly-A(+) RNA from them. Complementary DNA from the LacZ+ pool contained 100-fold more of the OSN-specific transcript OMP than the LacZ− pool, confirming enrichment of OSNs. We performed RDA with these cDNA pools to identify additional transcripts enriched in OSNs.
Fig. 1.
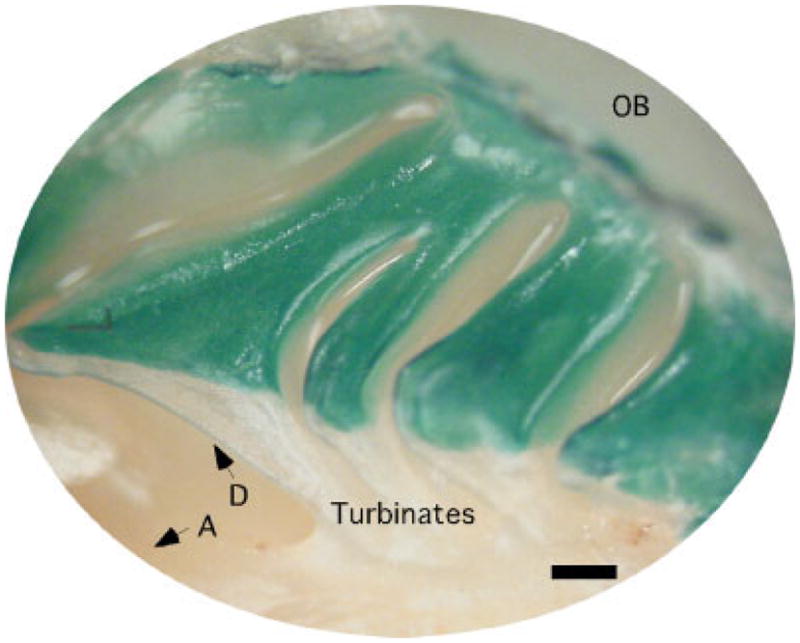
Medial view of the turbinates of a homozygous LacZ3 mouse (age P17) after X-gal staining to reveal the location of the OSNs (Walters et al., 1996). A, anterior; D, dorsal; OB, olfactory bulb. Scale bar = 0.5 mm.
The clones obtained from the second difference products of the RDA procedures contained sequences representing 58 different transcripts, including LacZ. Multiple cDNA fragments from different parts of several of the transcripts were detected. Previous experience suggests that this is indicative of a successful RDA experiment (Hollins et al., 2003). To validate the differential expression of each clone, we performed quantitative RT-PCR. Only 3 of the 57 endogenous transcripts did not differ between the LacZ+ and LacZ− cDNA pools (Table 1). The other 54 (95%) were at least 2.5-fold more abundant in the LacZ+ pool. This welcome result predicted that many of these 54 transcripts would also prove to be enriched in OSNs. To test this, we performed ISH on coronal sections of the nasal cavity (see below).
TABLE 1.
RDA Clones from Transcripts Enriched in LacZ+ Cells From OMP-LacZ3 Mice1
| Clones | Gene ID | Gene name | LacZ+/LacZ− | Cell types |
|---|---|---|---|---|
| n64J | 243634 | Tmem16b; novel | 281 | OSN |
| n96 | 13830 | Epb7.2; stomatin | 186 | OSN |
| n8 | 52020 | Novel | 178 | OSN |
| DP2′-13 | 64383 | Sirt2; sirtuin 2 | 128 | OSN |
| n137 | 18378 | Omp; olfactory marker protein | 103 | OSN |
| n85 | 216739 | Acs16; fatty acid-coenzyme A ligase, long chain 6 | 66 | OSN |
| n42J | Mm.57415 | Novel | 41 | OSN |
| n51J B | 20199 | S100A5; S100 calcium binding protein A5 | 32 | OSN |
| 49 | 231946 | Novel | 30 | OSN |
| n110 | AC109619 | Novel | 27 | OSN |
| 19 | 21968 | Tom1; target of myb1 homolog (chicken) | 23 | OSN |
| Dp2′-39 | 13198 | Ddit3; DNA-damage-inducible transcript 3 | 9 | OSN |
| Dp2′-n18 | 30963 | Ptpla; protein tyrosine phosphatase-like | 78 | OSN, SUS |
| n97 | 15529 | Sdc2; syndecan 2 | 77 | OSN, SUS |
| 29B | 59010 | Sqrdl; sulfide-quinone reductase-like | 54 | OSN, RE |
| n7J | 76287 | Novel | 52 | OSN, BG, SUS, RE, gland |
| n108 | 227613 | β-2 Tubulin | 45 | OSN, RE, gland |
| Dp2-36 | 73635 | Novel | 41 | OSN, RE, SUS |
| n132 | 12520 | Cd81; CD 81 antigen | 40 | OSN, BG, SUS |
| Dp2′-43 | 110213 | Tegt; testis enhance gene transcript | 31 | OSN, BG, SUS |
| n83 | 14718 | Got1; glutamate oxaloacetate transaminase 1 | 31 | OSN, SUS, RE, gland |
| n121 | 57784 | Bin3; bridging integrator 3 | 31 | OSN, BG, RE, SUS |
| n44J | 59083 | Fetub; Fetuin beta | 30 | OSN, RE, SUS glands |
| Dp2′-16 | 233801 | Similar to medium-chain acyl CoA synthetase (O-MACS) | 21 | OSN, BG, SUS |
| n18J | 214505 | Mdcp1; M6PR domain-containing protein | 21 | OSN, SUS, RE, BG |
| n31J | 20014 | Rpn2; ribophorin II (Rpn2) | 14 | OSN, BG |
| Dp2′-33 | 58520 | Novel | 12 | OSN, RE, SUS |
| 11A | 66092 | Ghitm; growth hormone-inducible transmembrane protein | 10 | OSN, RE, gland, SUS |
| n56 | 26446 | Psmb3; proteasome beta 3 | 9 | OSN, BG, RE, SUS, gland |
| n163A | 93765 | Ube2n; ubiquitin-conjugate enzyme E2N | 9 | OSN, SUS, RE |
| 23 | —2 | Novel | 8 | OSN, BG |
| n50J | 381280 | Novel | 6 | OSN, RE, BG |
| n118 | 12340 | Capza; capping protein alpha 1 | 5 | OSN, BG, RE, SUS |
| n72 | 12409 | Crb2; carbonyl reductase 2 | 80 | RE, SUS, gland |
| n8J | 385303 | Similar to steroid hydroxylase Cyp2g1 | 56 | SUS, BG |
| n34 | 13086 | Cyp2a4; cytochrome P450 2a4 | 46 | BG, SUS, RE |
| Dp2′-10 | 216350 | Tm4sf3; transmembrane 4 superfamily 3 | 44 | BG, RE, gland |
| n107A | 56212 | Arhg; Ras homolog family member G | 31 | gland, RE, SUS |
| 6 | 14863 | Gstm2; glutathione-S-transferase, mu2 | 24 | SUS, BG, RE |
| 30 | 19695 | Reg3g; regenerating islet-derived 3 gamma | 14 | RE, gland |
| Dp2′-5 | 73024 | Novel | 50 | NA |
| n78 | 13057 | Cyba; cytochrome b-245, alpha polypeptide | 31 | NA |
| n156A | 17449 | Mdh1; malate dehydrogenase 1 | 29 | NA |
| DP2′-8 | 11758 | Prdx6; peroxiredoxin 6 | 28 | NA |
| Dp2′-4 | 228033 | ATP5g3; ATP synthase, H+ transporting, mitochondrial F0 complex, subunit C (subunit 9), isoform 3 | 17 | NA |
| n128 | 28199 | Wdr23; WD repeat domain 23 | 14 | NA |
| n34 | 28088 | Novel | 12 | NA |
| n49B | 67025 | Similar to ribosomal protein L11 | 12 | NA |
| n49A | 66108 | Ndufa9; NADH dehydrogenase (ubiquinone) 1 alpha subcomplex 9 | 11 | NA |
| DP2′-23 | 235574 | Atp2c1; ATPase, Ca2+ sequestering | 8 | NA |
| Dp2′-37 | 15516 | Hspcb; heat shock protein 1, beta | 6 | NA |
| 17 | 110611 | Hdlbp; high-density lipoprotein binding protein | 5 | NA |
| 20B | 73826 | Poldip3; polymerase (DNA-directed), delta interacting protein 3 | 4.9 | NA |
| n103A | 17083 | Il1rI11; interleukin 1 receptor-like 1 ligand | 2.6 | NA |
In cases in which a GeneID is unavailable, Unigene or GenBank accessions numbers are included. The LacZ+/LacZ− ratio was determined by quantitative RT-PCR. BG, Bowman’s gland; OSN, olfactory sensory neuron; RE, respiratory epithelium; SUS, sustentacular cell; NA, ISH not attempted.
No match in sequence databases.
Several broad functional categories were represented by the proteins encoded in the transcripts enriched in the LacZ+ pool. One-third of the transcripts encode proteins whose functions are not yet known (Fig. 2A). We were able to make predictions about some of these proteins from sequence similarity and domain predictions, however. Five of the unknowns, n42J, n7J, n8, Ghitm, and n64J, were predicted to contain one or more transmembrane domains and are probably integral membrane proteins. In addition, n8 contains a single epidermal growth factor-like domain near its N-terminus and a large zona pellucida domain that occupies the middle of the protein, predicting that this protein binds with extracellular proteins or peptides. Proteins involved in signaling pathways were the next largest group represented. The relative enrichment of proteins associated with the cytoskeleton, energy production, and lipid metabolism correlates with the need for neurons to produce and maintain long cellular processes that transmit energy-demanding electrical signals.
Fig. 2.

A: Distributions by general biological function categories for proteins encoded by 54 transcripts enriched in the LacZ+ pool. B: Distributions by cell type categories for the expression patterns of 40 transcripts tested by ISH. BG, Bowman’s gland; RE, respiratory epithelium; SUS, sustentacular cells.
Transcripts expressed in OSNs
We tested the cellular distribution of 40 transcripts by ISH. Thirty-three of the transcripts were expressed in the OSNs (Fig. 2B), evidenced by labeling in cell bodies residing in the central two-thirds of the epithelium. Twelve were detected only in the OSNs. Not surprisingly, the transcripts whose abundance differed the most between the LacZ+ and LacZ− pools fell into this group (Table 1). For the other 21 transcripts, OSN labeling was usually as strong as labeling in other cells and in many cases was noticeably stronger. Examples of OSN-specific labeling are shown in Figure 3. Labeling for all 12 transcripts was consistent throughout the olfactory epithelium. The broad functional groups represented by the 12 transcripts include five proteins with no known function, five involved in signaling pathways, and one each involved in lipid metabolism and protein transport. Transcripts n64J, n8, and S100A5 tended to have labeling distributed more distally in the OSN layer than the other transcripts. Mature OSNs tend to be distributed more distally than immature OSNs, suggesting that these clones were expressed only by the mature OSNs. We tested this hypothesis by dual FISH with GAP-43 to identify immature OSNs and OMP to identify mature OSNs. As predicted, n64J, n8, and S100A5 had little overlap with GAP-43 but overlapped completely with OMP (Figs. 4, 5C,D). These transcripts are expressed only by mature OSNs. These experiments also confirmed an impression from earlier ISH data (Fig. 3C) that n8 labeling is strongest in the most distally located OSNs. A gradation in color from green proximally to yellow centrally to orangered distally was apparent (Fig. 4D). Whether this gradient in the abundance of n8 is due to position or OSN age has not been determined.
Fig. 3.

Examples of ISH for nine of the transcripts detected only in OSNs. Each panel includes a high-magnification image at left and a low-magnification image at right displaying at least half the bilaterally symmetric nasal cavity. A,A′: OMP, olfactory marker protein. B,B′: Clone 49, no known function. C,C′: Clone n8, no known function. D,D′: Clone n64J, no known function. E,E′: S100A5, a calcium binding protein. F,F′: Tom1, target of Myb-1. G,G′: Acls6, fatty acid-coenzyme A ligase, long chain 6. H,H′: Clone n110, no known function. I,I′: Sirtuin 2, a protein deacetylase. J,J′: Sense probe for sirtuin 2. Sense controls for all transcripts were tested and were as devoid of labeling as this example. Dashed lines mark the location of the basement membrane. Apical is to the left in all high-magnification panels. Scale bars = 20 μm in A–J; 250 μm in A′–J′.
Fig. 4.

Dual FISH confocal images demonstrate that n64J and n8 are expressed only by mature OSNs. A: Expression of n64J (red) does not overlap with expression of GAP-43 (green) a marker of immature OSNs. B: Expression of n64J (red) is contained within the same cells that express OMP (green). C: Expression of n8 (red) does not overlap with expression of GAP-43 (green). D: Expression of n8 (red) overlaps with expression of OMP (green) in a graded fashion, visible in the proximal to distal shift from green to yellow to orange-red within the OSN domain of the epithelium. Apical is to the left. Scale bars = 25 μm.
Fig. 5.
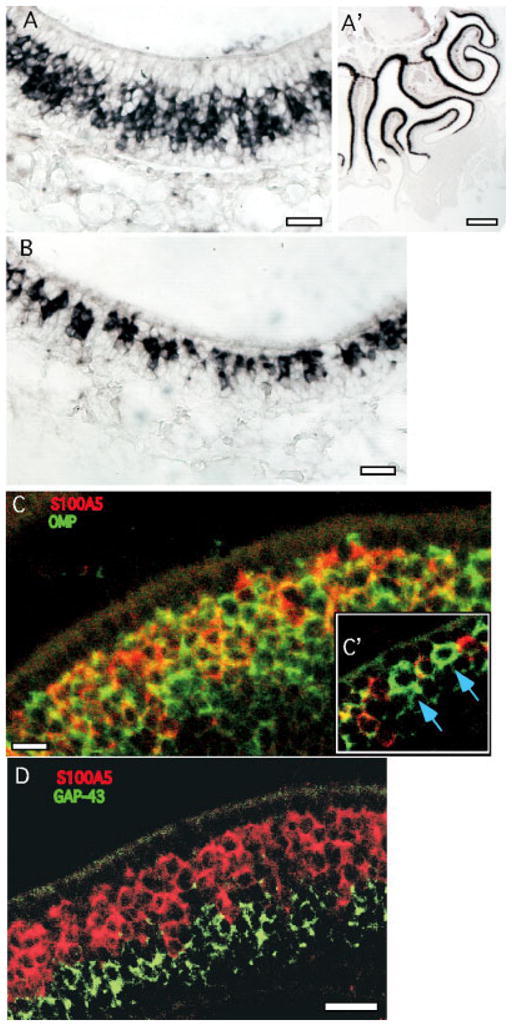
S100A5 expression was detected in a subset of OSNs in a mosaic pattern. A,A′: Although expression of S100A5 occurs throughout the olfactory epithelium, OSNs that appear to lack expression of S100A5 can be seen as gaps in the labeling in the OSN layer. B: These gaps are easier to see near the lateral margins of the epithelium, where OSNs are less dense. C: Dual FISH confocal image for S100A5 (red) and OMP (green) detects OSNs expressing OMP that appear to lack S100A5. C′: Letting a similar image oversaturate to detect overlapping expression more rigorously continues to indicate OSNs lacking detectable S100A5 expression (arrows). D: Cells expressing S100A5 (red) do not also express GAP-43 (green). Apical is upward. Scale bars = 25 μm in A–D; 250 μm in A′.
One of the functionally important features of the olfactory epithelium is the restricted expression of ORs. OR expression defines two types of restricted expression. First, each OR gene is expressed only within a region of the olfactory epithelium, called a zone or patch (Ressler et al., 1994; Vassar et al., 1994; Strotmann et al., 1994; Kubick et al., 1997). Second, each OSN expresses only one OR. Other genes with restricted patterns of expression in the OE are therefore of significant interest. Two of the transcripts expressed in OSNs showed evidence of restricted expression. OSNs expressing S100A5 were detected throughout all zones of the OE, but small clusters of unlabeled cells in the OSN layer were distributed among them (Fig. 5). This mosaic pattern was most easily observed near the lateral edges of the OE, where the OSNs were less dense (Fig. 5B). Cell counts estimate that S100A5 was expressed by 60 –75% of OSNs. To confirm that the unlabeled cells adjoining OSNs expressing S100A5 were mature OSNs, we used dual FISH. Indeed, some mature OSNs lacked detectable expression of S100A5 (Fig. 5C,C′). The other type of restricted expression was observed with a novel transcript, similar to O-MACS (Oka et al., 2003). It was expressed in a graded fashion. Its expression in OSNs and sustentacular cells was limited to the more dorsal regions of the OE, corresponding to the most dorsal OR expression zones (Fig. 6). Its expression in Bowman’s glands extended much farther ventrally but diminished gradually along the dorsoventral axis (Fig. 6B).
Fig. 6.
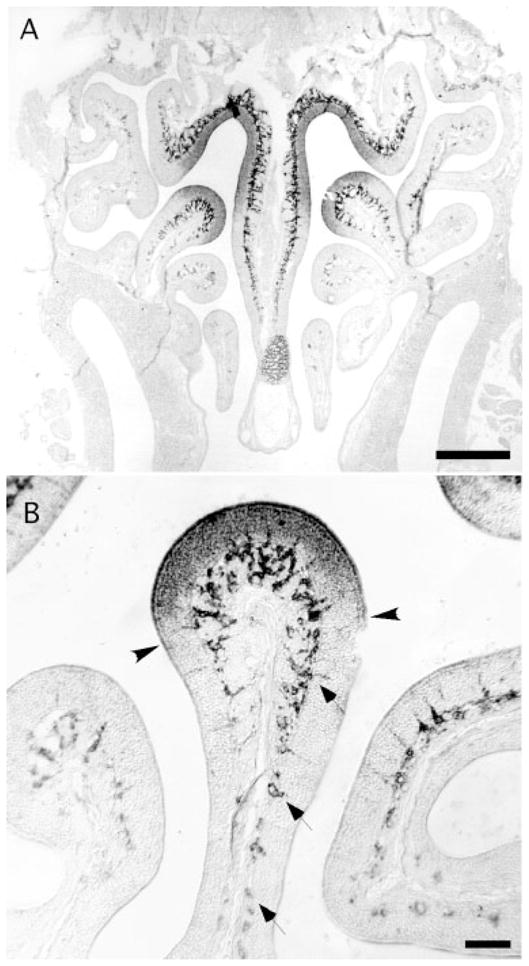
A: Expression of a transcript similar to medium-chain fatty acyl-coenzyme A synthetase (O-MACS) in OSNs and sustentacular cells was restricted to the dorsal regions of the olfactory epithelium, approximating OR expression zone 4. Its expression in Bowman’s glands extended more ventrally. B: Detail showing the sharp border in expression in OSNs and sustentacular cells (arrowheads) and the more gradual dimunition in Bowman’s glands (arrows). Scale bars = 250 μm in A; 50 μm in B.
We detected 21 transcripts, including similar to O-MACS, that were expressed in OSNs and in other cells in the nasal cavity. They represented many possible combinations of cell types. The additional cell types included sustentacular cells, basal cells, and Bowman’s gland and other subepithelial cells in the olfactory epithelium (Table 1). Some transcripts were also detected in respiratory epithelium and nasal glands in other areas of the nasal region. ISH results for four representative transcripts in this category are shown in Figure 7. The transcripts in this group of 21 included nine encoding proteins with no known function; three associated with the cytoskeleton; two each in cell signaling, protein degradation, and energy or metabolism; and one each in lipid metabolism, cell defense, and extracellular matrix.
Fig. 7.

Examples of transcripts expressed by OSNs and by other cells in the olfactory epithelium. A,A′: Fetuin β was expressed by OSNs, sustentacular cells, Bowman’s gland, and respiratory epithelial cells. B,B′: n50J, Which encodes a protein with no known function, was expressed by OSNs, Bowman’s gland, and respiratory epithelial cells. C,C′: β-2 Tubulin was expressed by OSNs, respiratory epithelial cells, and cells in nasal gland epithelium (asterisk). D,D′:CD81, a tetraspanin, was expressed by OSNs, sustentacular cells, Bowman’s gland cells, and probably other subepithelial cells. Arrows, Bowman’s glands and ducts; arrowheads, respiratory epithelium. Dashed lines mark the location of the basement membrane. Apical is to the left in all high-magnification panels. Scale bars = 20 μm in A–D; 250 μm in A′–D′.
Xenobiotic metabolism genes expressed in sustentacular cells and Bowman’s glands
The remaining seven transcripts we tested gave strong ISH labeling but were not detected in the OSNs. Five of these transcripts labeled sustentacular cells or Bowman’s gland cells, some also being expressed in respiratory epithelium or in glands near the nasal cavity (Fig. 8). Four of these gene products share known or potential roles in the metabolism and clearance of odorants: the cytochrome P450 isoforms, glutathione S-transferase mu 2, and carbonyl reductase 2 (Ben-Arie et al., 1994; Longo et al., 1997; Zhuo et al., 1999; Whitby-Logan et al., 2004). Mouse glutathione S-transferase mu 2 mRNA expression in sustentacular cells was limited to the more ventral zones of the olfactory epithelium, confirming previous immunocytochemistry results (Whitby-Logan et al., 2004). In contrast, its expression in Bowman’s glands and perhaps other submucosal cells was not restricted. The expression of the other xenobiotic metabolism enzymes was not zonally restricted. The observation that carbonyl reductase 2 was expressed only in sustentacular cells within the olfactory epithelium is novel. This gene product, which was so abundantly expressed that it was detected even in the thin processes and end feet of the sustentacular cells (Fig. 8B), may prove to be useful marker of sustentacular cells.
Fig. 8.
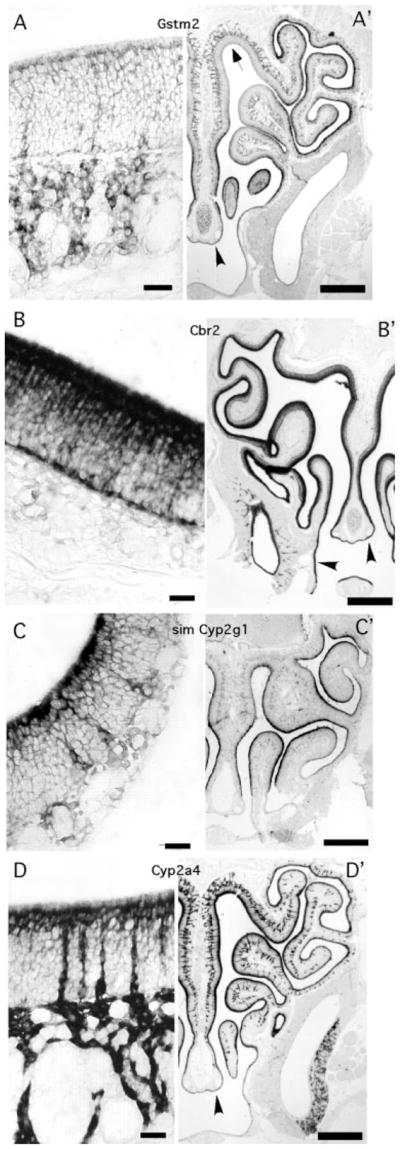
Transcripts encoding enzymes that metabolize xenobiotic compounds were expressed in sustentacular cells or Bowman’s gland cells. Each panel includes a high-magnification image at left and a low-magnification image at right displaying half the bilaterally symmetric nasal cavity. A,A′: Glutathione S-transferase mu 2 expression in sustentacular cells, Bowman’s glands, and respiratory epithelium (arrowhead). Expression was not detected in sustentacular cells in the dorsal zone (arrow). B,B′: Carbonyl reductase 2 expression in sustentacular cells and respiratory epithelial cells (arrowheads). C: Similar to cytochrome P450 2g1 expression in sustentacular cells and Bowman’s glands. D,D′: Cytochrome P450 2a4 expression in sustentacular cells, Bowman’s glands, and respiratory epithelial cells (arrowhead). Apical is upward in all high-magnification panels. Scale bars = 20 μm in A–D; 250 μm in A′–D′.
Reg3g, an anatomical marker for respiratory epithelium
The highly expressed transcript for Reg3g was detected only in cells of the respiratory epithelium and to a lesser extent in the nasal gland (Fig. 9). The distribution of this transcript nicely defined the junction between olfactory and respiratory areas of the epithelium. In regions of the nasal cavity where the olfactory epithelium is expanding in P21 mice, the junction is more gradual (Fig. 9B). In areas where the epithelium has reached the extent of its growth, the junction is quite sharp (Fig. 9C).
Fig. 9.
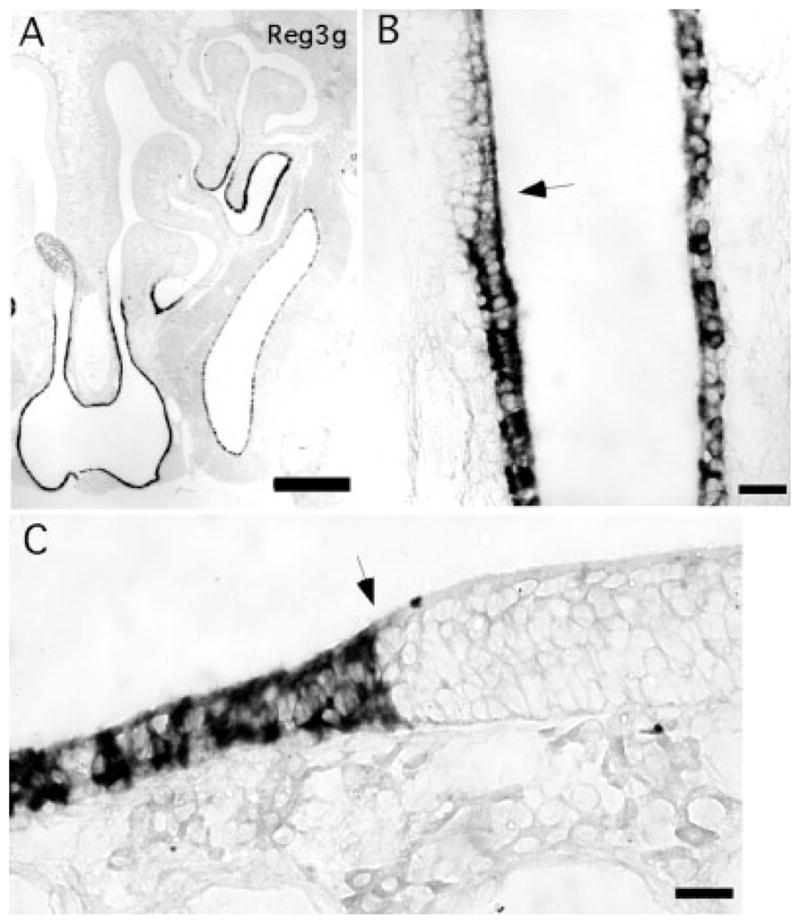
Reg3g is a marker of respiratory epithelial cells. A: Image of one-half of the nasal region shows expression restricted to the respiratory epithelium within the nasal cavity, as well as the nasal gland nearby. B: Transition between respiratory epithelium and olfactory epithelium (arrow) in a region of the septum where the olfactory epithelium was still expanding in this P21 mouse. C: In a region of the septum where growth of the olfactory epithelium has stabilized, the boundary is sharp (arrow). Scale bars = 250 μm in A; 25 μm in B,C.
DISCUSSION
We identified 54 transcripts expressed in the olfactory epithelium, mostly in OSNs. OSNs expressed a diversity of signaling proteins. Also enriched were proteins that correlate with maintaining neurites: cytoskeleton, lipid biosynthesis, and energy production. However, the largest group of transcripts encodes proteins with no known function, indicating that we have much to learn about OSN cell biology. The expression patterns of the transcripts begin to shed light on cellular functions that are shared vs. segregated. The restricted expression of S100A5 to a subset of OSNs potentially correlates with expression of a subset of ORs. The spatially restricted expression patterns of similar to O-MACS and Gstm2 indicate that zonal expression of a gene can be different in OSNs and sustentacular cells compared with Bowman’s glands. Our data also reinforce the interpretation that xenobiotic metabolism in the olfactory epithelium occurs primarily in sustentacular cells and Bowman’s glands and identify new anatomical markers for sustentacular cells and respiratory epithelium.
OSNs differ in calcium-binding proteins and express diverse signaling proteins
We observed that S100A5 was expressed mosaically in about 70% of OSNs. A previous study found that 60 –70% of rat olfactory bulb glomeruli were filled with S100A5-immunoreactive axons (Schafer et al., 2000). The remaining glomeruli were negative for S100A5 but positive for S100A6, and glomeruli with intermingling of the two were rare. Convergence of axons from OSNs expressing the same OR gene (Mombaerts et al., 1996), therefore, argues that S100A5 and S100A6 are selectively coexpressed with subsets of ORs. The functional consequences of this difference are obscure, except that S100A5 binds calcium with a 20-fold higher affinity than other S100A proteins (Schafer et al., 2000).
Several other interesting signaling proteins were expressed by OSNs. Sirtuin 2 is a protein deacetylase of histones, p53, tubulin, and MyoD (Fulco et al., 2003; North et al., 2003; Buck et al., 2004). These diverse targets correlate with the diverse functions of this protein, including gene silencing, muscle differentiation, and redox state sensing. Special membrane signaling domains appear to be important to OSNs. CD81 is a tetraspanin; these contain four transmembrane domains and help to organize membrane microdomains involved in signaling (Hemler, 2003; Tarrant et al., 2003). Stomatin strongly associates with lipid raft signaling domains. Previous evidence suggests that OSN lipid raft domains are predominantly in cilia and probably contain two olfactory-specific stomatin-like proteins (Schreiber et al., 2000; Kobayakawa et al., 2002; Goldstein et al., 2002). OSNs probably receive a wealth of signals from surrounding cells in the epithelium, from olfactory ensheathing glia, from contacts in the olfactory bulb, and from hormones produced more distantly (Schwob et al., 1992; Roskams et al., 1996; Hegg et al., 2003a,b). The divergent nature of these signals is in agreement with the relative enrichment of signaling proteins in OSNs.
OSNs differ in lipid metabolism enzymes
Another transcript we found to be expressed differentially by OSNs was a novel transcript, similar to O-MACS, a putative medium-chain fatty acid coenzyme-A synthetase. Similar to O-MACS is 93% identical to rat O-MACS, and, like the rat gene, it was expressed predominantly in the dorsal epithelium (Oka et al., 2003). Some differences exist, however. In mouse, the strongest expression was in Bowman’s glands, in which expression extended ventrally, with gradually decreasing intensity through zones 3 and 2, and probably into zone 1. Expression in OSNs or sustentacular cells had a sharp boundary, approximating OR expression zone 4, just as in rat. This difference in boundaries implies that zonality in the olfactory epithelium can be differentially regulated by cell type. Oka et al. (2003) also report zonal gradients in the expression of carbonyl reductase 2 and fatty acid-coenzyme A ligase, long chain 6. Our data for mouse relatives of these genes do not show zonal variation. The long-chain enzyme, Acsl6, which was expressed by OSNs throughout the olfactory epithelium, is widely expressed in neural tissues (Kee et al., 2003).
Neurites, cytoskeletal elements, and energy production
Much of the lipid produced in neurons is used in axons and dendrites. An increased need for energy production and cytoskeletal elements probably results and correlates with gene products enriched in the LacZ+ pool of cells. β-2 Tubulin was enriched in OSNs, as was the α tubulin deacetylase sirtuin 2 (North et al., 2003). Tubulin is hyperacetylated in stable structures, such as cilia (Poole et al., 2001), suggesting that sirtuin 2 might be most active in dynamic regions of OSNs. OSNs also express two proteins that regulate F-actin. Bin3 regulates F-actin localization and belongs to a family of proteins that integrate signaling pathways with membrane dynamics and F-actin localization (Wigge and McMahon, 1998; Routhier et al., 2001). Capza1 caps barbed ends of actin filaments; this is thought to stop filament growth at sites proximal to the leading edge of a cell membrane extension, ultimately contributing to actin filament depolymerization (Chen et al., 2000). Another OSN-enriched protein that has links to membrane dynamics is Tom1. Tom1 binds polyubiquitinated proteins, Tollip, and clathrin (Yamakami et al., 2003). It might therefore be involved in clathrin-mediated vesicular trafficking. It could also be functionally associated with the ubiquitin-conjugating enzyme Ube2n and the proteasome subunit Psmb3 that were enriched in the LacZ+ pool.
The expectation that energy production might be enhanced in OSNs compared with neighboring cells is supported by five gene products enriched in the LacZ+ pool. These included the mitochondrial ATP synthase subunit Atp5g3; a mitochondrial NADH-dehydrogenase (ubiquinone) subunit, Ndufa9, that transfers electrons to the respiratory chain; and Sqrdl, which is predicted by sequence similarity to be a sulfide quinone reductase resident in mitochondria. Also enriched in the LacZ+ pool were the cytoplasmic isoforms of the Krebs cycle enzyme malate dehydrogenase Mdh1 and another enzyme that produces oxaloacetate, the aspartate aminotransferase Got1.
OSN specificity within the olfactory epithelium
Data compiled in Unigene indicate that, although we detected 12 transcripts specific to OSNs within the olfactory epithelium, only OMP and n64J are expressed in a relatively small number of tissues. This is consistent with the strategy used, in which the comparison of OSNs with their neighbors detects transcripts and processes that are enriched in OSNs but not necessarily specific to the tissue. This allows us to ascribe to OSNs various proteins and pathways without the constraint that their existence in other tissues would eliminate them during the screening procedure. Recent studies using microarray approaches have also identified transcripts enriched in the olfactory epithelium or in isolated OSNs (Genter et al., 2003; Tietjen et al., 2003). Many of the same functional categories were identified, but overlap in gene identity with our findings is surprisingly small. Only Reg3g, Fetub, S100A5, stomatin, and Tom1 were also found to be enriched in either study, and the cellular expression patterns for most had not been determined. These differences can be ascribed to limitations of the different techniques used and highlight the value of addressing expression profiling problems with multiple techniques.
Cbr2 and Reg3g are markers for sustentacular cells and respiratory epithelium
A fortuitous result of these experiments was the identification of new markers for sustentacular cells and respiratory epithelium. Within the olfactory epithelium, only the sustentacular cells expressed Cbr2. This is a useful marker for sustentacular cells as long as its expression in respiratory epithelium and nasal glands is taken into consideration. Similarly, Reg3g is highly expressed in respiratory epithelium. It can be used to discriminate respiratory epithelial cells from sustentacular cells and to demarcate the border between olfactory and respiratory epithelia.
Xenobiotic metabolism is enhanced in sustentacular cells and Bowman’s gland
We detected transcripts for a group of enzymes metabolizing xenobiotic compounds. These transcripts were expressed in sustentacular cells or Bowman’s glands, in agreement with previous data (Bogdanffy, 1990; Ben-Arie et al., 1994; Krishna et al., 1994; Piras et al., 2003; Weech et al., 2003; Whitby-Logan et al., 2004). Why, then, were they enriched in the LacZ+ pool? RDA is susceptible to cases in which highly abundant transcripts escape suppression and amplify. This explanation seems incomplete, however, because of their enrichment in LacZ+ cell mRNA. Is it instead possible that sustentacular cells or Bowman’s glands have some LacZ activity? X-gal staining in mouse olfactory turbinates suggests a low level of background LacZ activity that is restricted to the olfactory epithelium (see, e.g., Fig. 1 in Vassalli et al., 2002). Alternatively, a fraction of nonneural cells might have adhered to OSNs during FACS, though we discount this possibility because cell size was used as a gating criterion. We suspect that, in some fashion, enough sustentacular cells or Bowman’s gland cells were sorted into the LacZ+ pool to allow these abundant transcripts to survive self-suppression during the RDA procedure.
The presence of xenobiotic metabolizing enzymes in the olfactory epithelium of enzymes is linked to odorant clearance in the case of cytochrome P450 enzymes and glutathione S-tranferase (Ben-Arie et al., 1994; Zhou et al., 1999). We propose that carbonyl reductase 2 performs similarly. It metabolizes xenobiotics in the lungs, is activated by fatty acids, and is expressed in sustentacular cells, where odorant clearance is an important function (Nakanishi et al., 1996; Soldan et al., 1999).
A broader view of the metabolism of xenobiotic compounds is that it is one aspect of the cellular defense mechanisms of the olfactory epithelium. We detected evidence of other aspects of cellular defense enriched in the LacZ+ pool. Tegt is an inhibitor of the proapoptotic Bax proteins (Xu and Reed, 1998). Peroxiredoxin 6 is an anti-oxidant enzyme (Salmon et al., 2004). The heat shock protein Hspcb is a well-known stress-response protein (Takayama et al., 2003). These data add to the evidence that cellular defense mechanisms are highly active in the olfactory epithelium.
Acknowledgments
National Institutes of Health; Grant number: R01 DC002736; Grant number: R01 AG18229; Grant number: R21 DC4507.
We thank Frank Margolis for the gift of the LacZ3 mice, Michael Hubank and David Schatz for discussions on the RDA technique, and Trese Leinders-Zufall for advice on dissociating cells.
LITERATURE CITED
- Ang LH, Kim J, Stepensky V, Hing H. Dock and Pak regulate olfactory axon pathfinding in Drosophila. Development. 2003;130:1307–1316. doi: 10.1242/dev.00356. [DOI] [PubMed] [Google Scholar]
- Bakalyar DM, Hauser AM, Timmis GC. A theoretical description of blood flow through the mitral orifice. J Biomech Eng. 1989;111:141–146. doi: 10.1115/1.3168355. [DOI] [PubMed] [Google Scholar]
- Barnea G, O’Donnell S, Mancia F, Sun X, Nemes A, Mendelson M, Axel R. Odorant receptors on axon termini in the brain. Science. 2004;304:1468. doi: 10.1126/science.1096146. [DOI] [PubMed] [Google Scholar]
- Ben-Arie N, Lancet D, Taylor C, Khen M, Walker N, Ledbetter DH, Carrozzo R, Patel K, Sheer D, Lehrach H, North MA. Olfactory receptor gene cluster on human chromosome 17: possible duplication of an ancestral receptor repertoire. Hum Mol Genet. 1994;3:229–235. doi: 10.1093/hmg/3.2.229. [DOI] [PubMed] [Google Scholar]
- Bogdanffy MS. Biotransformation enzymes in the rodent nasal mucosa: the value of a histochemical approach. Environ Health Perspect. 1990;85:177–186. doi: 10.1289/ehp.85-1568341. [DOI] [PMC free article] [PubMed] [Google Scholar]
- Buck L, Axel R. A novel multigene family may encode odorant receptors: a molecular basis for odor recognition. Cell. 1991;65:175–187. doi: 10.1016/0092-8674(91)90418-x. [DOI] [PubMed] [Google Scholar]
- Buck SW, Gallo CM, Smith JS. Diversity in the Sir2 family of protein deacetylases. J Leuk Biol. 2004;75:939–950. doi: 10.1189/jlb.0903424. [DOI] [PubMed] [Google Scholar]
- Chen H, Bernstein BW, Bamburg JR. Regulating actin-filament dynamics in vivo. Trends Biochem Sci. 2000;25:19–23. doi: 10.1016/s0968-0004(99)01511-x. [DOI] [PubMed] [Google Scholar]
- Cutforth T, Moring L, Mendelsohn M, Nemes A, Shah NM, Kim MM, Frisen J, Axel R. Axonal ephrin-As and odorant receptors: coordinate determination of the olfactory sensory map. Cell. 2003;114:311–322. doi: 10.1016/s0092-8674(03)00568-3. [DOI] [PubMed] [Google Scholar]
- Dhallan RS, Yau KW, Schrader KA, Reed RR. Primary structure and functional expression of a cyclic nucleotide-activated channel from olfactory neurons. Nature. 1990;347:184–187. doi: 10.1038/347184a0. [DOI] [PubMed] [Google Scholar]
- Dwyer ND, Troemel ER, Sengupta P, Bargmann CI. Odorant receptor localization to olfactory cilia is mediated by ODR-4, a novel membrane-associated protein. Cell. 1998;93:455–466. doi: 10.1016/s0092-8674(00)81173-3. [DOI] [PubMed] [Google Scholar]
- Feinstein P, Bozza T, Rodriguez I, Vassali A, Mombaerts P. Axon guidance of mouse olfactory sensory neurons by odorant receptors and the β2 adrenergic receptor. Cell. 2004;117:833–846. doi: 10.1016/j.cell.2004.05.013. [DOI] [PubMed] [Google Scholar]
- Fulco M, Schiltz RL, Iezzi S, King MT, Zhao P, Kashiwaya Y, Hoffman E, Veech RL, Sartorelli V. Sir2 regulates skeletal muscle differentiation as a potential sensor of the redox state. Mol Cell. 2003;12:51–62. doi: 10.1016/s1097-2765(03)00226-0. [DOI] [PubMed] [Google Scholar]
- Genter MB, Van Veldhoven PP, Jegga AG, Sakthivel B, Kong S, Stanley K, Witte DP, Ebert CL, Aronow BJ. Microarray-based discovery of highly expressed olfactory mucosal genes: potential roles in the various functions of the olfactory system. Physiol Genomics. 2003;16:67–81. doi: 10.1152/physiolgenomics.00117.2003. [DOI] [PubMed] [Google Scholar]
- Gimelbrant AA, Stoss TD, Landers TM, McClintock TS. Truncation releases olfactory receptors from the endoplasmic reticulum of heterologous cells. J Neurochem. 1999;72:2301–2311. doi: 10.1046/j.1471-4159.1999.0722301.x. [DOI] [PubMed] [Google Scholar]
- Gimelbrant AA, Haley SL, McClintock TS. Olfactory receptor trafficking involves conserved regulatory steps. J Biol Chem. 2001;276:7285–7290. doi: 10.1074/jbc.M005433200. [DOI] [PubMed] [Google Scholar]
- Goldstein BJ, Kulaga HM, Reed RR. Cloning and characterization of SLP3: a novel member of the stomatin family expressed by olfactory receptor neurons. J Assoc Res Otolaryngol. 2003;4:74–82. doi: 10.1007/s10162-002-2039-5. [DOI] [PMC free article] [PubMed] [Google Scholar]
- Hegg CC, Au E, Roskams AJ, Lucero MT. PACAP is present in the olfactory system and evokes calcium transients in olfactory receptor neurons. J Neurophysiol. 2003a;90:2711–2719. doi: 10.1152/jn.00288.2003. [DOI] [PMC free article] [PubMed] [Google Scholar]
- Hegg CC, Greenwood D, Huang W, Han P, Lucero MT. Activation of purinergic receptor subtypes modulates odor sensitivity. J Neurosci. 2003b;23:8291–8301. doi: 10.1523/JNEUROSCI.23-23-08291.2003. [DOI] [PMC free article] [PubMed] [Google Scholar]
- Hemler ME. Tetraspanin proteins mediate cellular penetration, invasion, and fusion events and define a novel type of membrane microdomain. Annu Rev Cell Dev Biol. 2003;19:397–422. doi: 10.1146/annurev.cellbio.19.111301.153609. [DOI] [PubMed] [Google Scholar]
- Hirota S, Ito A, Morii E, Wanaka A, Tohyama M, Kitamura Y, Nomura S. Localization of mRNA for c-kit receptor and its ligand in the brain of adult rats: an analysis using in situ hybridization histochemistry. Brain Res Mol Brain Res. 1992;15:47–54. doi: 10.1016/0169-328x(92)90150-a. [DOI] [PubMed] [Google Scholar]
- Hollins B, Hardin D, Gimelbrant AA, McClintock TS. Olfactory-enriched transcripts are cell-specific markers in the lobster olfactory organ. J Comp Neurol. 2003;455:125–138. doi: 10.1002/cne.10489. [DOI] [PubMed] [Google Scholar]
- Hubank M, Schatz DG. Identifying differences in mRNA expression by representational difference analysis of cDNA. Nucleic Acids Res. 1994;22:5640–5648. doi: 10.1093/nar/22.25.5640. [DOI] [PMC free article] [PubMed] [Google Scholar]
- Hubank M, Schatz DG. cDNA representational difference analysis: a sensitive and flexible method for identification of differentially expressed genes. Methods Enzymol. 1999;303:325–349. doi: 10.1016/s0076-6879(99)03021-9. [DOI] [PubMed] [Google Scholar]
- Hummel T, Vasconcelos ML, Clemens JC, Fishilevich Y, Vosshall LB, Zipursky SL. Axonal targeting of olfactory receptor neurons in Drosophila is controlled by Dscam. Neuron. 2003;37:221–231. doi: 10.1016/s0896-6273(02)01183-2. [DOI] [PubMed] [Google Scholar]
- Jones DT, Reed RR. Golf: an olfactory neuron specific-G protein involved in odorant signal transduction. Science. 1989;244:790–795. doi: 10.1126/science.2499043. [DOI] [PubMed] [Google Scholar]
- Kee HJ, Koh JT, Yang SY, Lee ZH, Baik YH, Kim KK. A novel murine long-chain acyl-CoA synthetase expressed in brain participates in neuronal cell proliferation. Biochem Biophys Res Commun. 2003;305:925–933. doi: 10.1016/s0006-291x(03)00859-3. [DOI] [PubMed] [Google Scholar]
- Knoll B, Zarbalis K, Wurst W, Drescher U. A role for the EphA family in the topographic targeting of vomeronasal axons. Development. 2001;128:895–906. doi: 10.1242/dev.128.6.895. [DOI] [PubMed] [Google Scholar]
- Kobayakawa K, Hayashi R, Morita K, Miyamichi K, Oka Y, Tsuboi A, Sakano H. Stomatin-related olfactory protein, SRO, specifically expressed in the murine olfactory sensory neurons. J Neurosci. 2002;22:5931–5937. doi: 10.1523/JNEUROSCI.22-14-05931.2002. [DOI] [PMC free article] [PubMed] [Google Scholar]
- Krishna NS, Getchell TV, Getchell ML. Differential expression of alpha, mu, and pi classes of glutathione S-transferases in chemosensory mucosae of rats during development. Cell Tissue Res. 1994;275:435–450. doi: 10.1007/BF00318813. [DOI] [PubMed] [Google Scholar]
- Kubick S, Strotmann J, Andreini I, Breer H. Subfamily of olfactory receptors characterized by unique structural features and expression patterns. J Neurochem. 1997;69:465–475. doi: 10.1046/j.1471-4159.1997.69020465.x. [DOI] [PubMed] [Google Scholar]
- Kudrycki KE, Buiakova O, Tarozzo G, Grillo M, Walters E, Margolis FL. Effects of mutation of the Olf-1 motif on transgene expression in olfactory receptor neurons. J Neurosci Res. 1998;52:159–172. doi: 10.1002/(SICI)1097-4547(19980415)52:2<159::AID-JNR4>3.0.CO;2-9. [DOI] [PubMed] [Google Scholar]
- Lewcock JW, Reed RR. A feedback mechanism regulates monoallelic odorant receptor expression. Proc Natl Acad Sci U S A. 2004;101:1069–1074. doi: 10.1073/pnas.0307986100. [DOI] [PMC free article] [PubMed] [Google Scholar]
- Lipscomb BW, Treloar HB, Klenoff J, Greer CA. Cell surface carbohydrates and glomerular targeting of olfactory sensory neuron axons in the mouse. J Comp Neurol. 2003;467:22–31. doi: 10.1002/cne.10910. [DOI] [PubMed] [Google Scholar]
- Loconto J, Papes F, Chang E, Stowers L, Jones EP, Takada T, Kumanovics A, Fischer Lindahl K, Dulac C. Functional expression of murine V2R pheromone receptors involves selective association with the M10 and M1 families of MHC class Ib molecules. Cell. 2003;112:607–618. doi: 10.1016/s0092-8674(03)00153-3. [DOI] [PubMed] [Google Scholar]
- Longo V, Amato G, Santucci A, Gervasi PG. Purification and characterization of three constitutive cytochrome P-450 isoforms from bovine olfactory epithelium. Biochem J. 1997;323:65–70. doi: 10.1042/bj3230065. [DOI] [PMC free article] [PubMed] [Google Scholar]
- Lucas P, Ukhanov K, Leinders-Zufall T, Zufall F. A diacylglycerol-gated cation channel in mammalian vomeronasal neuron dendrites is impaired in TRPC2 mutant mice. Neuron. 2003;40:551–561. doi: 10.1016/s0896-6273(03)00675-5. [DOI] [PubMed] [Google Scholar]
- Margolis FL, Tarnoff JF. Site of biosynthesis of the mouse brain olfactory bulb protein. J Biol Chem. 1973;248:451–455. [PubMed] [Google Scholar]
- McClintock TS, Sammeta N. Trafficking prerogatives of olfactory receptors. Neuroreport. 2003;14:1547–1552. doi: 10.1097/00001756-200308260-00001. [DOI] [PubMed] [Google Scholar]
- Mombaerts P. Genes and ligands for odorant, vomeronasal and taste receptors. Nat Rev Neurosci. 2004;5:263–279. doi: 10.1038/nrn1365. [DOI] [PubMed] [Google Scholar]
- Mombaerts P, Wang F, Dulac C, Chao SK, Nemes A, Mendelsohn M, Edmondson J, Axel R. Visualizing an olfactory sensory map. Cell. 1996;87:675–686. doi: 10.1016/s0092-8674(00)81387-2. [DOI] [PubMed] [Google Scholar]
- Morse WR, Whitesides JG, 3rd, LaMantia AS, Maness PF. p59fyn And pp60c-src modulate axonal guidance in the developing mouse olfactory pathway. J Neurobiol. 1998;36:53–63. doi: 10.1002/(sici)1097-4695(199807)36:1<53::aid-neu5>3.0.co;2-9. [DOI] [PubMed] [Google Scholar]
- Nakanishi M, Deyashiki Y, Nakayama T, Sato K, Hara A. Cloning and sequence analysis of a cDNA encoding tetrameric carbonyl reductase of pig lung. Biochem Biophys Res Commun. 1993;194:1311–1316. doi: 10.1006/bbrc.1993.1967. [DOI] [PubMed] [Google Scholar]
- North BJ, Marshall BL, Borra MT, Denu JM, Verdin E. The human Sir2 ortholog, SIRT2, is an NAD+-dependent tubulin deacetylase. Mol Cell. 2003;11:437–444. doi: 10.1016/s1097-2765(03)00038-8. [DOI] [PubMed] [Google Scholar]
- Oka Y, Kobayakawa K, Nishizumi H, Miyamichi K, Hirose S, Tsuboi A, Sakano H. O-MACS, a novel member of the medium-chain acyl-CoA synthetase family, specifically expressed in the olfactory epithelium in a zone-specific manner. Eur J Biochem. 2003;270:1995–2004. doi: 10.1046/j.1432-1033.2003.03571.x. [DOI] [PubMed] [Google Scholar]
- Piras E, Franzen A, Fernandez EL, Bergstrom U, Raffalli-Mathieu F, Lang M, Brittebo EB. Cell-specific expression of CYP2A5 in the mouse respiratory tract: effects of olfactory toxicants. J Histochem Cytochem. 2003;51:1545–1555. doi: 10.1177/002215540305101114. [DOI] [PMC free article] [PubMed] [Google Scholar]
- Poole CA, Zhang ZJ, Ross JM. The differential distribution of acetylated and detyrosinated alpha-tubulin in the microtubular cytoskeleton and primary cilia of hyaline cartilage chondrocytes. J Anat. 2001;199:393–405. doi: 10.1046/j.1469-7580.2001.19940393.x. [DOI] [PMC free article] [PubMed] [Google Scholar]
- Ressler KJ, Sullivan SL, Buck LB. Information coding in the olfactory system: evidence for a stereotyped and highly organized epitope map in the olfactory bulb. Cell. 1994;79:1245–1255. doi: 10.1016/0092-8674(94)90015-9. [DOI] [PubMed] [Google Scholar]
- Roskams AJ, Bethel MA, Hurt KJ, Ronnett GV. Sequential expression of Trks A, B, and C in the regenerating olfactory neuroepithelium. J Neurosci. 1996;16:1294–1307. doi: 10.1523/JNEUROSCI.16-04-01294.1996. [DOI] [PMC free article] [PubMed] [Google Scholar]
- Routhier EL, Burn TC, Abbaszade I, Summers M, Albright CF, Prender-gast GC. Human BIN3 complements the F-actin localization defects caused by loss of Hob3p, the fission yeast homolog of Rvs161p. J Biol Chem. 2001;276:21670–21677. doi: 10.1074/jbc.M101096200. [DOI] [PubMed] [Google Scholar]
- Salmon M, Dedessus Le Moutier J, Wenders F, Chiarizia S, Eliaers F, Remacle J, Royer V, Pascal T, Toussaint O. Role of the PLA(2)-independent peroxiredoxin VI activity in the survival of immortalized fibroblasts exposed to cytotoxic oxidative stress. FEBS Lett. 2004;557:26–32. doi: 10.1016/s0014-5793(03)01437-6. [DOI] [PubMed] [Google Scholar]
- Schafer BW, Fritschy JM, Murmann P, Troxler H, Durussel I, Heizmann CW, Cox JA. Brain S100A5 is a novel calcium-, zinc-, and copper ion-binding protein of the EF-hand superfamily. J Biol Chem. 2000;275:30623–30630. doi: 10.1074/jbc.M002260200. [DOI] [PubMed] [Google Scholar]
- Schreiber S, Fleischer J, Breer H, Boekhoff I. A possible role for caveolin as a signaling organizer in olfactory sensory membranes. J Biol Chem. 2000;275:24115–24123. doi: 10.1074/jbc.M001876200. [DOI] [PubMed] [Google Scholar]
- Schwob JE, Szumowski KE, Stasky AA. Olfactory sensory neurons are trophically dependent on the olfactory bulb for their prolonged survival. J Neurosci. 1992;12:3896–3919. doi: 10.1523/JNEUROSCI.12-10-03896.1992. [DOI] [PMC free article] [PubMed] [Google Scholar]
- Serizawa S, Miyamichi K, Nakatani H, Suzuki M, Saito M, Yoshihara Y, Sakano H. Negative feedback regulation ensures the one receptor-one olfactory neuron rule in mouse. Science. 2003;302:2088–2094. doi: 10.1126/science.1089122. [DOI] [PubMed] [Google Scholar]
- Soldan M, Nagel G, Losekam M, Ernst M, Maser E. Interindividual variability in the expression and NNK carbonyl reductase activity of 11beta-hydroxysteroid dehydrogenase 1 in human lung. Cancer Lett. 1999;145:49–56. doi: 10.1016/s0304-3835(99)00216-5. [DOI] [PubMed] [Google Scholar]
- St John JA, Pasquale EB, Key B. EphA receptors and ephrin-A ligands exhibit highly regulated spatial and temporal expression patterns in the developing olfactory system. Brain Res Dev Brain Res. 2002;138:1–14. doi: 10.1016/s0165-3806(02)00454-6. [DOI] [PubMed] [Google Scholar]
- Strotmann J, Wanner I, Helfrich T, Beck A, Breer H. Rostro-caudal patterning of receptor-expressing olfactory neurones in the rat nasal cavity. Cell Tissue Res. 1994;278:11–20. doi: 10.1007/BF00305773. [DOI] [PubMed] [Google Scholar]
- Takayama S, Reed JC, Homma S. Heat-shock proteins as regulators of apoptosis. Oncogene. 2003;22:9041–9047. doi: 10.1038/sj.onc.1207114. [DOI] [PubMed] [Google Scholar]
- Tarrant JM, Robb L, van Spriel AB, Wright MD. Tetraspanins: molecular organisers of the leukocyte surface. Trends Immunol. 2003;24:610–617. doi: 10.1016/j.it.2003.09.011. [DOI] [PubMed] [Google Scholar]
- Tietjen I, Rihel JM, Cao Y, Koentges G, Zakhary L, Dulac C. Single-cell transcriptional analysis of neuronal progenitors. Neuron. 2003;38:161–175. doi: 10.1016/s0896-6273(03)00229-0. [DOI] [PubMed] [Google Scholar]
- Treloar HB, Gabeau D, Yoshihara Y, Mori K, Greer CA. Inverse expression of olfactory cell adhesion molecule in a subset of olfactory axons and a subset of mitral/tufted cells in the developing rat main olfactory bulb. J Comp Neurol. 2003;458:389–403. doi: 10.1002/cne.10590. [DOI] [PubMed] [Google Scholar]
- Vassalli A, Rothman A, Feinstein P, Zapotocky M, Mombaerts P. Minigenes impart odorant receptor-specific axon guidance in the olfactory bulb. Neuron. 2002;35:681–696. doi: 10.1016/s0896-6273(02)00793-6. [DOI] [PubMed] [Google Scholar]
- Vassar R, Chao SK, Sitcheran R, Nunez JM, Vosshall LB, Axel R. Topographic organization of sensory projections to the olfactory bulb. Cell. 1994;79:981–991. doi: 10.1016/0092-8674(94)90029-9. [DOI] [PubMed] [Google Scholar]
- Walters E, Grillo M, Tarozzo G, Stein-Izsak C, Corbin J, Bocchiaro C, Margolis FL. Proximal regions of the olfactory marker protein gene promoter direct olfactory neuron-specific expression in transgenic mice. J Neurosci Res. 1996;43:146–160. doi: 10.1002/(SICI)1097-4547(19960115)43:2<146::AID-JNR3>3.0.CO;2-G. [DOI] [PubMed] [Google Scholar]
- Walz A, Rodriguez I, Mombaerts P. Aberrant sensory innervation of the olfactory bulb in neuropilin-2 mutant mice. J Neurosci. 2002;22:4025–4035. doi: 10.1523/JNEUROSCI.22-10-04025.2002. [DOI] [PMC free article] [PubMed] [Google Scholar]
- Wang SS, Tsai RYL, Reed RR. The characterization of the Olf-1/EBF-like HLH transcription factor family: implications in olfactory gene regulation and neuronal development. J Neurosci. 1997;17:4149–4158. doi: 10.1523/JNEUROSCI.17-11-04149.1997. [DOI] [PMC free article] [PubMed] [Google Scholar]
- Wang SS, Lewcock JW, Feinstein P, Mombaerts P, Reed RR. Genetic disruptions of O/E2 and O/E3 genes reveal involvement in olfactory receptor neuron projection. Development. 2004;131:1377–1388. doi: 10.1242/dev.01009. [DOI] [PubMed] [Google Scholar]
- Weech M, Quash M, Walters E. Characterization of the mouse olfactory glutathione S-transferases during the acute phase response. J Neurosci Res. 2003;73:679–685. doi: 10.1002/jnr.10687. [DOI] [PubMed] [Google Scholar]
- Whitby-Logan GK, Weech M, Walters E. Zonal expression and activity of glutathione S-transferase enzymes in the mouse olfactory mucosa. Brain Res. 2004;995:151–157. doi: 10.1016/j.brainres.2003.09.012. [DOI] [PubMed] [Google Scholar]
- Wigge P, McMahon HT. The amphiphysin family of proteins and their role in endocytosis at the synapse. Trends Neurosci. 1998;21:339–344. doi: 10.1016/s0166-2236(98)01264-8. [DOI] [PubMed] [Google Scholar]
- Xu Q, Reed JC. Bax inhibitor-1, a mammalian apoptosis suppressor identified by functional screening in yeast. Mol Cell. 1998;1:337–346. doi: 10.1016/s1097-2765(00)80034-9. [DOI] [PubMed] [Google Scholar]
- Yamakami M, Yoshimori T, Yokosawa H. Tom1, a VHS domain-containing protein, interacts with tollip, ubiquitin, and clathrin. J Biol Chem. 2003;278:52865–52872. doi: 10.1074/jbc.M306740200. [DOI] [PubMed] [Google Scholar]
- Zhuo X, Gu J, Zhang QY, Spink DC, Kaminsky LS, Ding X. Biotransformation of coumarin by rodent and human cytochromes P-450: metabolic basis of tissue-selective toxicity in olfactory mucosa of rats and mice. J Pharmacol Exp Ther. 1999;288:463–471. [PubMed] [Google Scholar]