

Abstract
Intrinsically photosensitive retinal ganglion cells (ipRGCs) are a subtype of ganglion cell in the mammalian retina that expresses the photopigment, melanopsin, and drives non-image-forming visual functions. Three morphological subtypes of ipRGCs (M1, M2 and M3) have been described based on their dendritic stratifications in the inner plexiform layer (IPL), but the question of their potential interactions via electrical coupling remains unsettled. In this study, we have addressed this question in the mouse retina, by injecting the tracer Neurobiotin into ipRGCs that were genetically labelled with the fluorescent protein, tdTomato. We confirmed the presence of the M1-M3 subtypes of ipRGCs based on their distinct dendritic stratifications. All three subtypes were tracer-coupled to putative amacrine cells situated within the ganglion cell layer (GCL) but not the inner nuclear layer (INL). The cells tracer-coupled to the M1 and M2 cells were shown to be wide-field GABA-immunoreactive amacrine cells. We found no evidence of homologous tracer-coupling of ipRGCs or heterologous coupling to other types of ganglion cells.
Keywords: ipRGCs, melanopsin, amacrine cells, ganglion cells, coupling
Introduction
A subset of mammalian retinal ganglion cells (RGCs) have been found to be intrinsically photosensitive (ipRGCs) (Berson et al., 2002) and to express the photopigment, melanopsin (Hattar et al., 2002; Gooley et al., 2001; Provencio et al., 2002). These ipRGCs constitute only 1-2% of the total ganglion-cell population in rodent (Hattar et al., 2002). They project their axons to many brain targets, prominent among which are the hypothalamic suprachiasmatic nucleus and thalamic intergeniculate leaflet, for the regulation of circadian rhythms, and the olivary pretectal nucleus, for the pupillary light reflex (Hattar et al., 2002; Gooley et al., 2003; Morin et al., 2003; Hannibal and Fahrenkrug, 2004; Hattar et al., 2006). Three different morphological subtypes of ipRGCs have been described, with certain functional differences between them; M1 cells have dendrites that ramify in sublamina a (OFF-sublamina) of the inner plexiform layer (IPL), M2 cells have dendrites in sublamina b (ON-sublamina), and the bistratified M3 cells have dendrites in both sublamina a and b (Dacey et al., 2005; Hattar et al., 2006; Jusuf et al., 2007; Viney et al., 2007; Baver et al., 2008; Schmidt et al., 2008; Schmidt and Kofuji, 2009).
Using calcium-imaging and mice lacking rod and cone photoreceptors (rd/rd cl), Sekaran et al. (2003, 2005) reported that the number of light-responsive cells in the ganglion cell layer (GCL) was reduced in the presence of carbenoxolone, a gap-junction blocker, suggesting that the light-triggered response in ipRGCs propagates through gap junctions to non-ipRGCs in the GCL, i.e., other RGCs and/or displaced amacrine cells. Schmidt and Kofuji (2008) have also shown that the application of the gap-junction blocker, meclofenamic acid, lowered the recorded membrane capacitance of these cells, again consistent with ipRGCs being coupled to other neurons via gap junctions. On the other hand, in a multi-electrode-array (MEA) study of pharmacologically isolated ipRGCs in rat retina, carbenoxolone did not reduce the number of light-responsive neurons, counter to what would be expected if ipRGCs were electrically coupled to other neurons in the GCL (Weng et al., 2009). Consequently, it remains unclear whether ipRGCs are coupled to other neurons and, if so, the identity of these neurons.
In this study, we have examined directly the tracer-coupling of ipRGCs in the mouse retina by intracellular injection of the tracer Neurobiotin. To target ipRGCs, we used a BAC-transgenic mouse line that expressed the fluorescent dye, tdTomato, under the control of the melanopsin promoter (Do et al., 2009).
Materials and Methods
Animals and tissue preparation
For this study, we used a BAC-transgenic mouse line expressing the fluorescent protein, tdTomato, under the control of the melanopsin promoter (“melanopsin:tdTomato mouse”; Do et al., 2009). The animals (>2 months old and sometimes dark-adapted for several hours prior to experimentation) were anesthetized and killed with sodium pentobarbital or Avertin in accord with the Dalhousie University Committee on Laboratory Animals and the Institutional Animal Care and Use Committee of the Johns Hopkins University, respectively. The eyes were then removed and the retinas dissected free. Pieces of retina were mounted on cellulose filter paper (Millipore Corporation, Billerica, MA, USA) with the RGCs up. Alternatively, the entire retina was used, following flattening with four cuts. The retina was superfused at ∼5 ml/minute with bicarbonate-buffered Ames medium that was bubbled continuously with carbogen (95% O2/5% CO2). Experiments were done at room temperature (∼23° C) or near physiological temperature (35° C), with apparently identical results. Procedures were performed near the middle of the daily 12-hr light phase, in darkness or dim-red light (long-pass filter with half-maximal transmission at ∼640 nm, giving roughly 10-5 μW/μm2 at the preparation) that does not activate ipRGCs substantially (Do et al., 2009; Tu et al., 2005).
Intracellular injections
TdTomato-expressing cells were visualized with a 40× water-immersion objective and conventional epifluorescence for Cy3/Rhodamine. In some cases, images of tdTomato-fluorescing cells were captured using a Sensicam cooled CCD camera (PCO Computer Optics, Kelheim, Germany). Borosilicate glass electrodes were pulled and filled at their tips with 1% Alexa 555 sodium hydrazide (Invitrogen, Burlington, ON) and 4% N-(2-aminoethyl-)-biotinamide hydrochloride (Neurobiotin, Vector, Burlingame, CA), backfilled with Tris buffer, pH 7.4, and typically had resistances between 120 and 145 MΩ. Under visual guidance provided by the tdTomato fluorescence, cells were targeted for injection. First Alexa 555 was iontophoresed (-2 to -3 nA). When the morphology of the cell could be visualized, the polarity of the current was reversed (+2 to +3 nA) and Neurobiotin injected for 3 min.
Some cells were filled with the loose-patch technique (Kanjhan and Vaney, 2008). Glass patch pipettes (3-5 MΩ) were filled with (in mM) 115 K-Methanesulfonate, 13 NaCl, 2 MgCl2, 0.1 CaCl2, 1 EGTA, 10 HEPES, 2% Neurobiotin, pH 7.2 with KOH. A tdTomato cell was identified with several seconds of fluorescence light, following which it was viewed with infrared illumination and Nomarski optics. The inner-limiting membrane overlying the cell was mechanically removed, and a small portion of the cell membrane drawn into the tip of the patch pipette. Voltage steps (1 Hz, 500-ms duration, +20-100 mV amplitude from a holding voltage of 0 mV) were applied for 20 min and the pipette withdrawn after a 10-min recovery period.
Antibody characterization
Table 1 lists the antibodies used in this study. To detect melanopsin, a polyclonal rabbit antibody raised against a C-terminal peptide from rat melanopsin and shown to be specific for mouse melanopsin was used (PA1-781; Affinity Bioreagents, Golden, CO; Hattar et al., 2002; Ingham et al., 2009; Baver et al., 2008). PA1-781 stained almost all tdTomato-positive cells in the melanopsin:tdTomato mouse and vice versa (Do et al., 2009). Nonetheless, this antibody has since been reported to label only the M1 ipRGC subtype (Baver et al., 2008), suggesting that only M1 ipRGCs are labeled in the melanopsin:tdTomato mouse. Both melanopsin immunoreactivity (Baver et al., 2008; Pires et al., 2009) and reporter-gene expression (Hattar et al., 2006; Schmidt and Kofuji, 2009) are extremely low in M2 cells, and M3 cells are rarely encountered (see Results), suggesting that these subtypes were not detected in the initial characterization of the melanopsin:tdTomato mouse (Do et al., 2009). Our results in this paper suggest that M1, M2, and M3 cells do express sufficient tdTomato fluorescence for detection, particularly in the live retina and with imaging set for high sensitivity.
Table 1.
Details of antibodies used for immunohistochemistry.
| Antibody | Immunogen | Source & Species | Dilution |
|---|---|---|---|
| Anti-γ-aminobutyric acid (GABA) | GABA conjugated with bovine serum albumin (GABA-BSA) | Sigma, A2052 Rabbit IgG, polyclonal | 1:500 |
| Anti-melanopsin | Synthetic peptide corresponding to carboxy terminal of rat melanopsin, residues E(455)-QKSKTPKTKRHLPSLDRRM-M(474) | ABR Affinity Bioreagents, PA1-781 Rabbit IgG, polyclonal | 1:200 |
The GABA antibody (Sigma; #A2052), produced in rabbit against synthetic GABA conjugated to bovine serum albumin (BSA), was shown by dot blot assay to bind to GABA. Hodgson et al. (1985) showed that this antibody had little or no cross-reactivity with an extensive list of amino acids. The antibody has been used extensively for identifying GABAergic neurons in rodent CNS (Ito et al., 2007; Panzanelli et al., 2007; Wolansky et al., 2007), including the retina (Dedek et al., 2009; Haverkamp et al., 2009).
Immunostaining in whole-mount retina
After intracellular dye injection, retinas were fixed in 4% paraformaldehyde for 10 min and washed for at least 30 min in 0.1 M phosphate buffer (PB), pH 7.4. To visualize Neurobiotin, fixed retinae were incubated overnight with streptavidin-FITC or streptavidin-Cy3 (1:500, Sigma Chemical Co., Oakville, ON), in 0.1 M PB containing 0.3% TritonX-100. Some injected retinas were incubated with antibodies against melanopsin or GABA (see Table 1). Briefly, retinas were blocked with normal goat serum at 4°C overnight. Then, the retinas were incubated with the primary antibody 5-7 days, washed several times in PB 0.1 M and incubated overnight at 4°C in the appropriate secondary antibody (1:500, coupled to Alexa Fluor 488 or Cy3, Invitrogen). After final washes with PB, retinas were mounted in Vectashield Mounting Medium (Vector Laboratories). Coverslips were sealed with nail polish for prolonged storage. Slides were stored at 4 °C and protected from light. After fixation, the tdTomato fluorescence tended to diminish. To control for nonspecific binding of the secondary antibodies, experiments were performed omitting the primary antibody, in which case only labeling of some blood vessels was observed. For the GABA antibody, a pre-adsorption control with BSA was performed by incubating the diluted primary antibody (5 μg/ml) with 250 μg/ml BSA. Immunostaining with this antibody was unaffected by BSA pre-absorption.
Image analysis and statistics
Images were acquired using a Nikon Eclipse C1 confocal microscope with 20× (0.50 N.A.), 40× (1.30 N.A.), and 60× (1.40 N.A.) Plan Fluor objectives. The intensity and contrast of the final images were adjusted using Adobe Photoshop 7.0 (Adobe, San Jose, CA, USA).
The analysis of branching pattern of ipRGC dendrites was conducted by Sholl's analysis (Sholl, 1953) using ImageJ software (http://rsb.info.nih.gov/ij/). Briefly, 15 concentric circles spaced every 17 μm were laid over the dendritic field of each ipRGC with the soma positioned centrally. The numbers of dendrites intersecting each circle was counted and plotted against the distance from the center of the soma. The dendritic-field and soma-size measurements reported here are for the long axis and were measured with EZ-C1 software (Nikon). All values are given as mean ± standard deviation and were compared for statistical difference by using the unpaired t-test (SigmaPlot, Systat Software Inc., San Jose, CA, USA).
Results
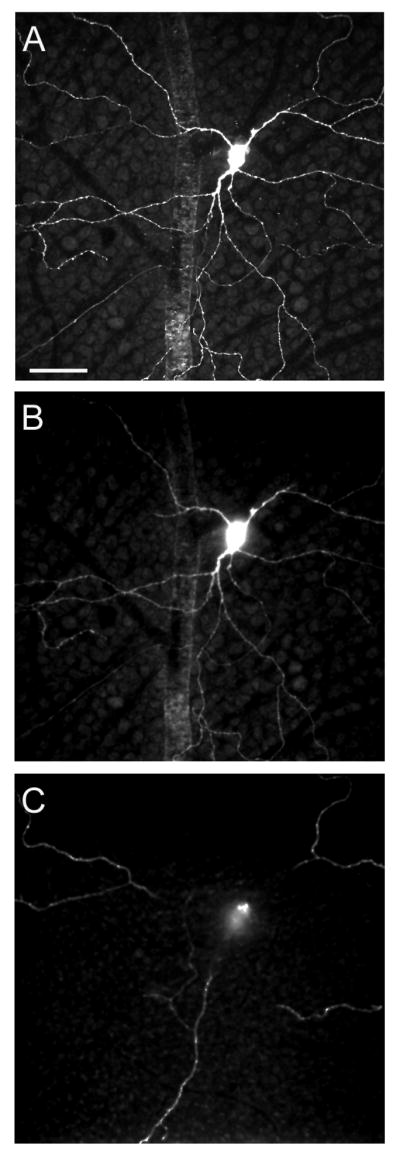
To analyze the morphology and tracer-coupling patterns of ipRGCs, we injected tdTomato-positive cells in the GCL with Neurobiotin (which crosses gap junctions in the mammalian retina) and Alexa 555 hydrazide (which typically does not cross gap junctions but allowed confirmation of successful impalement prior to injection with Neurobiotin), or in some cases, Neurobiotin alone (see Methods). The tdTomato signal was normally located in the soma of a labeled cell (Fig 1A), but could occasionally be detected in dendrites and axons (Fig 1B). After histochemical processing, the tdTomato signal was quite dim (Fig. 1C) but it was always co-localized with the melanopsin immunostaining (Fig. 1D).
Figure 1.

IpRGCs labeled by tdTomato in mouse retina. (A) Fluorescence of tdTomato-expressing ipRGCs within the GCL in living whole-mount retina. The tdTomato signal was strongest in the somata but, on occasion, (B) was detectable in the dendrites (arrows) and axons (arrowhead) of ipRGCs. (C) Fluorescence of a tdTomato-expressing ipRGC after fixation. (D) Melanopsin immunofluorescence (Alexa 488 secondary) demonstrating colocalization with tdTomato. Scale bar A, B: 40 μm; scale bar C, D: 10 μm.
To verify the injection of melanopsin-containing ipRGCs, we processed four retinas to test for colocalization of injected Neurobiotin with melanopsin-immunoreactivity. Figure 2 shows three examples of Neurobiotin-injected cells (Fig. 2B, 2D, 2F; all M1 cells, see below) that were confirmed to be melanopsin-immunoreactive (Fig. 2A, 2C, 2E). In fact, we found the same for all injected ipRGCs (n=11) in these four retinas. These were all M1 cells because of their dendritic stratification in sublamina a (see below), and because the antibody used is selective for M1 cells (see Methods).
Figure 2.

Confocal micrographs illustrating localization of melanopsin immunofluorescence in Neurobiotin-filled ipRGCs in the GCL. (A, C, E) show the melanopsin immunofluorescence (Alexa 488). (B, D, F) overlay of injected Neurobiotin revealed by fluorescent (Cy3) streptavidin. Scale bar = 50 μm
IpRGC subtypes
A total of 40 ipRGCs from 10 adult mice were well filled with Neurobiotin or Neurobiotin/Alexa 555, and analyzed further. We identified the three subtypes of ipRGCs consistent with the M1-3 classification as reported previously in other mouse lines based on their dendritic stratification in the IPL (Hattar et al., 2006; Viney et al., 2007; Baver et al., 2008; Schmidt et al., 2008; Schmidt and Kofuji, 2009).
M1 ipRGCs (Fig. 3A) had cell bodies that were 10-23 μm in size (16.7 ± 3.6 μm long axis diameter, mean ± SD, n=27), from which 3-4 primary dendrites (3.3 ± 0.6) arose to stratify in sublamina a of the IPL (Fig. 3B) with a dendritic-field diameter that was 269-613 μm (377 ± 81 μm). M2 ipRGCs (Fig. 3C) had cell bodies that were 12-21 μm in size (18.6 ± 3.8 μm, n=10), from which three to five primary dendrites (4.8 ± 0.8) emanated to stratify in sublamina b of the IPL (Fig. 3D) with a dendritic-tree diameter that was 303-567 μm (403 ± 109 μm). Terminal dendrites of a M2 cells frequently overlapped within a given cell and had hooked endings. Although the soma sizes and dendritic fields of M2 cells were, on average, larger than M1 cells, these differences were not significant (p>0.05). M3 ipRGCs were rarely (n = 3 of 40 cells) encountered. The soma had an average diameter of 16.7 ± 3.2 μm. The dendritic arbors stratified in both sublamina a and sublamina b, with an average dendritic-field diameter in both layers of 449 ± 60 μm (Fig. 3E, F). The average dendritic field diameter in sublamina a was 423 ± 23.5 μm and in sublamina b 394 ± 30.9 μm. Figure 4 shows stacked confocal images of the dendrites of an M3 cell in each of the two sublaminae. The two stratified arborizations of the M3 cells (i.e., in sublamina a (Fig. 4B) and b (Fig. 4C), respectively) were distinctly different from the morphology of the corresponding monostratified arborisation of the M1 or M2 cell.
Figure 3.

Confocal micrographs illustrating the morphology of the three types of ipRGCs in the mouse retina. (A) Flat-mount view of an M1 ipRGC. (B) Orthogonal view illustrating stratification of the M1 cell in sublamina a of the IPL. (C) Flatmount view of the M2 ipRGC. (D) Stratification of M2 cells in the sublamina b of the IPL. Note that the dendrites are near both to the M2 cell soma and to coupled cells in the GCL indicating that they stratify in sublamina b. (E) Confocal image of an M3 ipRGC in tangential view. (F) Orthogonal view of the M3 cell, illustrating bistratification. (G) An M1 cell (and coupled cells) with concentric circles superimposed for Sholl's analysis. (H) Sholl's analysis suggests a greater degree of dendritic branching by M2 cells (squares) than by M1 cells (circles), mean ± SD. Scale bar: 40 μm.
Figure 4.
Confocal optical section of an M3 ipRGC at the level of the (A) GCL, (B) sublamina b of the IPL and (C) sublamina a of the IPL. Note that the dendritic arbors within each sublamina are different from those of the M1 and M2 cells. See Fig. 3F for orthogonal image. Scale bar = 50 μm.
We evaluated the branching pattern of the ipRGCs dendrites in a subset (n=5 each) of M1 and M2 cells by Sholl's analysis (see Fig. 3G). Although the mean number of dendritic crossings (a measure of the extent of dendritic branching) at 100-200 μm from the soma was typically greater for M2 cells, the difference was not significant (p>0.05).
Cells coupled to ipRGCs
We found tracer-coupling for all ipRGC subtypes (Fig. 5). All cells coupled to the ipRGCs had their cell bodies in the GCL. Of the 27 injected M1 cells, 23 showed tracer-coupling, each to an average 5.3 ± 1.9 cells with small somata (6.9 ± 1.8 μm). All 10 injected M2 cells showed tracer-coupling, each to an average 10.3 ± 4.2 cells with soma sizes of 7-12 μm in diameter. From our limited sample of three M3 cells, we found only one cell that showed tracer-coupling: to 10 cells in the GCL, with a mean soma diameter of 8.9 ± 1.3 μm. Fig. 5D shows a histogram comparing the number of cells coupled to each ipRGC type. There was no significant difference between the number of cells coupled to M1 and M2 cells (P ≥ 0.078). Unlike Neurobiotin, Alexa 555 hydrazide was never seen in coupled cells, indicating that it was restricted to the injected cells.
Figure 5.

Tracer-coupling of ipRGCs. (A) Confocal image of a Neurobiotin-injected M1 cell. The cell shows tracer-coupling to small cells in the GCL (arrows). (B) An injected M2 cell shows coupling to small cells located in the GCL (arrows). (C) The injected M3 cell shows tracer-coupling to small cells in the GCL (arrows). Asterisks show the injected cells. (D) Histogram indicating the mean (± SD) number of cells coupled to each ipRGC. The number of cells coupled to M1 cells was not significantly different from M2 cells (P ≥ 0.078). Scale bar = 50 μm.
The soma size of the cells tracer-coupled to the ipRGCs suggested that they were either displaced amacrine cells or ganglion cells with small somata. Since no study has reported tracer-coupling between two different types of ganglion cells, we assumed that the coupled cells here were displaced amacrine cells. In the mouse retina, displaced amacrine cells comprise at least 17 different types (Gustincich et al., 1997; Badea and Nathans, 2004; Lin and Masland, 2006; Pérez de Sevilla Müller et al., 2007), and probably all are GABAergic (Pérez de Sevilla Müller et al., 2007). To be certain, we processed two Neurobiotin-injected retinas for immunohistochemistry with an antibody against GABA (see Table 1). All cells tracer-coupled to the ipRGCs in these two retinas (n=28) were GABA-immunoreactive (Fig. 6). Because these two retinas did not contain injected M3 ipRGCs (which were rarely encountered), we could not be certain that the cells tracer-coupled to the M3 cell type were also GABAergic, but they were presumably so.
Figure 6.

Cells coupled to ipRGCs are GABAergic. The neurons to which the M1 (A) and M2 (C) ipRGCs are tracer coupled were GABA-immunoreactive (B, D, arrows). (A, C) show the Neurobiotin-injected ipRGCs visualized by Streptavidin-FITC. (B, D) show GABA immunostaining revealed using a Cy3-conjugated secondary antibody. Note that the somata (asterisk) and some portions of the dendrites of the injected cells can be seen in the fluorescence channel used to visualize GABA because Alexa 555 hydrazide was co-injected with Neurobiotin to visualize the electrode during the injection process and to verify cell impalement. Scale bar = 50 μm.
In order to study the nature of the coupled cells, we used the loose-patch technique, which occasionally yielded better staining of the coupled amacrine cells. In one very well injected (20-min duration) M2 cell, we were able to visualize the proximal arbor of some of the coupled cells. They had many short dendrites and several long axon-like processes (Fig.7). The appearance of these cells was consistent with descriptions of “polyaxonal” amacrine cells (Famiglietti, 1992a, b; Wright and Vaney, 2004; Völgyi et al., 2001; 2009), possibly the PA-S5 polyaxonal amacrine cell described in the mouse retina (Pérez de Sevilla Müller et al., 2007).
Figure 7.

Morphology and tracer coupling pattern of an M2 ipRGC. (A) Confocal (negative) images showing a M2 cell (asterisk) filled with the loose-patch technique. This very well-filled M2 cell exhibited intense tracer-coupling to displaced amacrine cells. Two types of coupled amacrine cells can be seen (large cells arrows, smaller cells arrowheads). (B) High-power photomicrograph (inset from A) showing the detailed morphology of one of the coupled cells of panel A. Arrows show axon-like processes. (C) Drawings of two displaced amacrine cells coupled to the M2 cell in A. These amacrine cells have short dendrites and axon-like processes (arrows). Note that the staining of the amacrine cells drawn is incomplete due to limited tracer diffusion into coupled cells. Scale bars (A) = 50 μm, (B) = 12.5 μm, (C) = 100 μm.
Taken together, M1 and M2 ipRGCs (and presumably M3 cells as well) appear to be heterologously coupled to displaced wide-field GABAergic amacrine cells.
Discussion
In this study, we have analyzed the morphology and tracer-coupling of mouse ipRGCs identified in a transgenic mouse line by their specific expression of fluorescent tdTomato protein (Do et al., 2009). The three morphological subtypes of ipRGCs that we found conform to those previously described based on similar or different methods (Hattar et al., 2006; Baver et al., 2008; Berson et al., 2010), including an Opn4-EGFP transgenic mouse line (Schmidt et al., 2008; Schmidt and Kofuji, 2009) and trans-synaptic viral tracing (Viney et al., 2007). However, we have found a much greater proportion of injected ipRGCs cells being M1 cells (67.5%) than M2 (25%) and M3 (7.5%) cells, compared to the corresponding 22%, 52%, and 26% reported in the Opn4-EGFP line by Schmidt et al. (2008). Possibly, this discrepancy arose from our using >2-month-old animals, versus P17-P24 animals used by Schmidt et al. (2008). However, Viney et al. (2007) used animals 6-8 weeks of age and reported a distribution of 39%, 41% and 20% for M1-M3, respectively, likewise distinct from the other two studies. Perhaps these differences simply reflect random sampling. Cells with strong BAC-driven EGFP fluorescence tend to be M1 cells (Schmidt and Kofuji, 2009). The same likely applies to our BAC-driven tdTomato reporter, so we may have been biased toward this subtype.
Schmidt and Kofuji (2009) and Berson et al. (2010) reported that the soma and dendritic field size of M2 cells were larger than M1 cells. Although we found the mean soma and dendritic field size of M2 cells to be larger than M1 cells, this difference was not statistically significant in our sample. Schmidt and Kofuji (2009) and Berson et al. (2010) also reported that the dendritic field of M2 cells was more complex than M1 cells. This conclusion was derived from Sholl's analysis that demonstrated significantly greater numbers of dendritic branches at 100-200 μm from the soma in M2 cells compared to M1 cells. We also used Sholl's analysis to compare M1 and M2 cells but did not find a significant difference between these two cell types in our sample. The major difference between our evaluation and that of Schmidt and Kofuji (2009) concerns the M1 cells: whereas Schmidt and Kofuji (2009) found that the number of dendritic branches of M1 cells did not, on average, exceed 8, we found M1 cells to have up to 12 branches (100-200 μm from the soma). Consistent with our results, Berson et al. (2010) found up to 11 branches (about 100 μm from the soma) and Li et al. (2006) reported a similar result for M1 cells in rat retina. With respect to M2 cells, our analysis and that of Schmidt and Kofuji (2009) are similar with up to 15 and 17 dendritic branches (at 100-200 μm from the soma), respectively; Berson et al. (2010) reported even greater dendritic branching (>20 at around 100 μm from the soma).
Existing RGC classification schemes (Sun et al., 2002; Badea and Nathans, 2004; Kong et al., 2005; Völgyi et al., 2009) do not account for the three morphological types of ipRGCs, although both M1 and M2 ipRGCs are included as part of a single cluster (M6) of the classification scheme of Coombs et al. (2006). On the basis of somata and dendritic field size, Berson et al. (2010) compared M2 cells with existing ganglion cell subtypes to classify them as RGC3 cells of Sun et al. (2002), the cluster 8 cells of Kong et al. (2005) and cluster 9 cells of Badea and Nathans (2004). Compared to Berson et al. (2010), our measurements, and those of Schmidt and Kofuji (2009), suggest a larger average somata and dendritic field size for M2 cells (Table 2). However, the measurements of somata size by us and by Schmidt and Kofuji (2009) are likely over-estimates because of fluorescence imaging and it is not clear to what extent dendritic field size is a useful means to classify RGCs.
Table 2.
Comparison of M2 cells with corresponding RGC types described in other studies. Measurements are mean ± SD.
| Study | Ganglion cell type | Dendritic field diameter (μm) | Soma diameter (μm) | Tracer coupled to displaced amacrine cells |
|---|---|---|---|---|
| This study | M2 cells | 403 ± 109 | 18.6 ± 3.8 | Yes |
| Schmidt and Kofuji, 2009 | M2 cells | 423 ± 85 | 21.8 ± 2.9 | - |
| Berson et al., 2010 | M2 cells | 314 ± 76 | 14.8 ± 1.5 | - |
| Sun et al., 2002 | RGA1 cells | 318 ± 74 | 22 ± 4 | - |
| Kong et al., 2005 | Cluster 11 | 380 | - | |
| Völgyi et al., 2009 | G1 cells | 245 ± 30 | 20.3 ± 3.4 | Yes |
The presence of tracer-coupling adds another useful criterion for classifying RGC types (Völgyi et al. 2009). Our study shows that all of the cells tracer-coupled to the ipRGCs have relatively small cell bodies situated in the GCL. The small soma sizes suggest that they are displaced amacrine cells, which make up 60% of the neurons in the GCL (Jeon et al., 1998). We confirmed, for M1 and M2 cells, that the coupled cells were amacrine cells by demonstrating that they were GABA- immunoreactive. One type of displaced amacrine cell coupled to the M2 cells appears to be a polyaxonal amacrine cell, possibly the PA-S5 amacrine cell described in the mouse retina (Pérez de Sevilla Müller et al., 2007). Since RGC3 cells are not tracer-coupled (G12 in Völgyi et al., 2009), it is unlikely that M2 cells belong to this ganglion cell group. RGC types with dendrites that ramify in sublamina b and coupling to polyaxonal amacrine cells in the GCL include the G1, G6 and G10 types of Völgyi et al. (2009). Considering the coupling pattern, as well as general morphology and dendritic field size, we suggest that M2 cells correspond to the G1 RGC type of Völgyi et al. (2009), the RGA1 RGC type described by Sun et al. (2002), and the Cluster 11 (Kong et al. 2005) (see Table 2). However, each of these types likely also contains other kinds of RGCs (e.g. α-ganglion cells, Schubert et al., 2005a; Völgyi et al., 2005), potentially explaining why the average dendritic field size of the G1 cell type is much smaller than the measurements of M2 cell dendritic field size (Table 2) and that RGA1 cells are likely to be more abundant than M2 cells (Sun et al., 2002; Hattar et al., 2002; 2006; Berson et al., 2010).
Interestingly, the G1 type cells, which resemble M2 ipRGCs (Table 2), are known to be tracer-coupled to at least two different types of polyaxonal amacrine cells (Völgyi et al., 2009), with one considered equivalent to the PA-S5 amacrine cell. Tracer coupling to two populations of displaced amacrine cells would explain the observed variation in the somata size of cells tracer-coupled to M2 cells (7-12 μm in diameter) and would suggest one population with larger cell bodies and another population with smaller cell bodies.
The majority of mouse RGCs that ramify within sublamina a are coupled to displaced amacrine cells, whereas RGCS that ramify within sublamina b are coupled to amacrine cells in the INL (Völgyi et al., 2009). Our results indicate that these generalizations apply in the case of the M2 but not for the M1 ipRGCs, because we found both to be tracer coupled to displaced amacrine cells. In the few types of RGCs with dendrites in sublamina a, but coupling to displaced amacrine cells (the G13 and G18 types of Völgyi et al., 2009), there is also homologous coupling to RGCs. This is not the case for M1 cells, which showed only tracer-coupling to displaced amacrine cells. This makes the M1 ipRGCs, as far as we know, the only RGCs ramifying within sublamina a that are coupled exclusively to displaced amacrine cells.
Connexins that mediate coupling between ipRGCs and displaced amacrine cells
Connexins (Cxs) are expressed in all major types of retinal neurons (Bloomfield and Völgyi, 2009). Thus far, only two connexins have been reported in mouse RGCs, Cx36 and Cx45 (Schubert et al., 2005a; Völgyi et al., 2005; Schubert et al., 2005b). Cx36 is expressed in α-ganglion cells (Schubert et al., 2005a; Völgyi et al., 2005) but not RGA1 cells (Schubert et al., 2005a; Pan et al., 2010), making it unlikely that Cx36 is involved in the coupling between M2 ipRGCs and displaced amacrine cells. Cx45 has been described only in bistratified ganglion cells (Schubert et al., 2005b). It is possible, therefore, that M3 cells express Cx45. Recently, two other connexins have been described in the retina, Cx40 (Kihara et al., 2006) and Cx30.2 (Kreuzberg et al., 2008; Pérez de Sevilla Müller et al., 2010), with the latter likely expressed by RGCs. Thus, Cx30.2 may be expressed by ipRGCs.
Functional consequences of ipRGC-amacrine cell coupling
Calcium-imaging experiments showed, in mice lacking rod and cone photoreceptors (rd/rd cl), that the number of light-responsive cells in the GCL was reduced by treatment with the gap junction blocker carbenoxolone (Sekaran et al., 2003; 2005). These results suggested that ipRGCs are coupled to other (not intrinsically photosensitive) neurons in the GCL. In contrast, neither carbenoxolone, nor another gap junction blocker, meclofenamic acid, reduced the number of intrinsically photoresponsive cells in the GCL recorded using multi-electrode array (MEA) in rat retina (Weng et al., 2010). Our finding that ipRGCs are tracer-coupled to displaced amacrine cells may explain the discrepancy between the calcium-imaging and MEA results. If the displaced amacrine cells coupled to ipRGCs are non-spiking cells, they would not be detected by MEA but could still show elevations of intracellular calcium. It remains to be determined if the amacrine cells coupled to ipRGCs are spiking neurons. Both spiking and non-spiking displaced amacrine cells have been described in ferret retina (Aboelela and Robinson, 2004) and, in rabbit, all types of polyaxonal amacrine cells, one of which we have identified as being tracer-coupled to M2 ipRGCs, are spiking (Völgyi et al., 2001). An alternative explanation for the effect of carbenoxolone on the number of light-responsive cells in the GCL as assessed by calcium imaging (Sekaran et al., 2003; 2005) is that it involved an action of carbenoxolone on voltage-gated calcium channels (Vessey et al., 2004), which have been shown to be important for light-evoked elevations in intracellular calcium in ipRGCs (Hartwick et al., 2007).
Electrical coupling between RGCs has been proposed to increase correlated activity, which enhances information transmission (Meister and Berry, 1999; Gollisch and Meister, 2010). Direct electrical coupling between RGCs would subserve correlations with short latency, but correlations of broader timing may be achieved by indirect RGC-coupling via amacrine cells (Brivanlou et al., 1988; DeVries, 1999; Hu and Bloomfield, 2003). As nearly two thirds of mouse RGCs show heterologous coupling to amacrine cells (Völgyi et al., 2009), indirect RGC coupling could be common. Correlated activity of ipRGCs has been detected in postnatal (P8-P10) mouse retina but not in the adult (Tu et al., 2005), although in the latter case the number of cells sampled may have been insufficient. Therefore, it remains to be demonstrated definitively whether ipRGCs in adult retina show correlated activity and whether this is a consequence of ipRGC coupling to displaced amacrine cells.
Acknowledgments
The authors acknowledge the technical assistance of Ms. Janette Nason. We also thank Refik Kanjhan for invaluable advice on the use of loose-patch dye-filling, and Liusong Ding for maintenance of the tdTomato mouse line.
Support or grant information: Supported by a CIHR/NNSF Canada/China Joint Health Research Initiative Grant to W.H.B. and S.H., an NRSA Fellowship to M.T.H.D., and an NIH grant to K.-W.Y.
References
- Aboelela SW, Robinson DW. Physiological response properties of displaced amacrine cells of the adult ferret retina. Vis Neurosci. 2004;21:135–144. doi: 10.1017/s0952523804042051. [DOI] [PubMed] [Google Scholar]
- Badea TD, Nathans J. Quantitative analysis of neuronal morphologies in the mouse retina visualized by using a genetically directed reporter. J Comp Neurol. 2004;480:331–351. doi: 10.1002/cne.20304. [DOI] [PubMed] [Google Scholar]
- Baver SB, Pickard GE, Sollars PJ, Pickard GE. Two types of melanopsin retinal ganglion cell differentially innervate the hypothalamic suprachiasmatic nucleus and the olivary pretectal nucleus. Eur J Neurosci. 2008;27:1763–1770. doi: 10.1111/j.1460-9568.2008.06149.x. [DOI] [PubMed] [Google Scholar]
- Berson DM, Dunn FA, Takao M. Phototransduction by retinal ganglion cells that set the circadian clock. Science. 2002;295:1070–1073. doi: 10.1126/science.1067262. [DOI] [PubMed] [Google Scholar]
- Berson DM, Castrucci AM, Provencio I. Morphology and mosaics of melanopsin-expressing retinal ganglion cell types in mice. J Comp Neurol. 2010;518:2405–22. doi: 10.1002/cne.22381. [DOI] [PMC free article] [PubMed] [Google Scholar]
- Bloomfield SA, Völgyi B. The diverse functional roles and regulation of neuronal gap junctions in the retina. Nat Rev Neurosci. 2009;10:495–506. doi: 10.1038/nrn2636. [DOI] [PMC free article] [PubMed] [Google Scholar]
- Brivanlou IH, Warland DK, Meister M. Mechanisms of concerted firing among retinal ganglion cells. Neuron. 1998;20:527–539. doi: 10.1016/s0896-6273(00)80992-7. [DOI] [PubMed] [Google Scholar]
- Coombs J, van der List D, Wang GY, Chalupa LM. Morphological properties of mouse retinal ganglion cells. Neurosci. 2006;140:123–136. doi: 10.1016/j.neuroscience.2006.02.079. [DOI] [PubMed] [Google Scholar]
- Dacey DM, Liao HW, Peterson BB, Robinson FR, Smith VC, Pokorny J, Yau KW, Gamlin PD. Melanopsin-expressing ganglion cells in primate retina signal colour and irradiance and project to the LGN. Nature. 2005;433:749–754. doi: 10.1038/nature03387. [DOI] [PubMed] [Google Scholar]
- Dedek K, Breuninger T, Müller Pérez de Sevilla L, Maxeiner S, Schultz K, Janssen-Bienhold U, Willecke K, Euler T, Weiler R. A novel type of interplexiform amacrine cell in the mouse retina. Eur J Neurosci. 2009;30:217–228. doi: 10.1111/j.1460-9568.2009.06808.x. [DOI] [PubMed] [Google Scholar]
- DeVries SH. Correlated firing in rabbit retinal ganglion cells. J Neurophyiol. 1999;81:908–920. doi: 10.1152/jn.1999.81.2.908. [DOI] [PubMed] [Google Scholar]
- Do MT, Kang SH, Xue T, Zhong H, Liao HW, Bergles DE, Yau KW. Photon capture and signalling by melanopsin retinal ganglion cells. Nature. 2009;457:281–287. doi: 10.1038/nature07682. [DOI] [PMC free article] [PubMed] [Google Scholar]
- Famiglietti EV. Polyaxonal amacrine cells of rabbit retina: morphology and stratification of PA1 cells. J Comp Neurol. 1992a;316:391–405. doi: 10.1002/cne.903160402. [DOI] [PubMed] [Google Scholar]
- Famiglietti EV. Polyaxonal amacrine cells of rabbit retina: PA2, PA3, PA4 cells. Light and electron microscopic studies with a functional interpretation. J Comp Neurol. 1992b;316:422–446. doi: 10.1002/cne.903160404. [DOI] [PubMed] [Google Scholar]
- Gollisch T, Meister M. Eye smarter than scientists believed: Neural computations in circuits of the retina. Neuron. 2010;65:150–164. doi: 10.1016/j.neuron.2009.12.009. [DOI] [PMC free article] [PubMed] [Google Scholar]
- Gooley JJ, Lu J, Chou TC, Scammell TE, Saper CB. Melanopsin in cells of origin of the retinohypothalamic tract. Nat Neurosci. 2001;4:1165. doi: 10.1038/nn768. [DOI] [PubMed] [Google Scholar]
- Gooley JJ, Lu J, Fischer D, Saper CB. A broad role for melanopsin in nonvisual photoreception. J Neurosci. 2003;23:7093–7106. doi: 10.1523/JNEUROSCI.23-18-07093.2003. [DOI] [PMC free article] [PubMed] [Google Scholar]
- Gustincich S, Feigenspan A, Wu DK, Koopman LJ, Raviola E. Control of dopamine release in the retina: a transgenic approach to neural networks. Neuron. 1997;18:723–736. doi: 10.1016/s0896-6273(00)80313-x. [DOI] [PubMed] [Google Scholar]
- Hannibal J, Fahrenkrug J. Target areas innervated by PACAP-immunoreactive retinal ganglion cells. Cell Tissue Res. 2004;316:99–113. doi: 10.1007/s00441-004-0858-x. [DOI] [PubMed] [Google Scholar]
- Hartwick AT, Bramley JR, Yu J, Stevens KT, Allen CN, Baldridge WH, Sollars PJ, Pickard GE. Light evoked calcium responses of isolated melanopsin expressing retinal ganglion cells. J Neurosci. 2007;27:13468–13480. doi: 10.1523/JNEUROSCI.3626-07.2007. [DOI] [PMC free article] [PubMed] [Google Scholar]
- Hattar S, Liao HW, Takao M, Berson DM, Yau KW. Melanopsin-containing retinal ganglion cells: Architecture, projections, and intrinsic photosensitivity. Science. 2002;295:1065–1070. doi: 10.1126/science.1069609. [DOI] [PMC free article] [PubMed] [Google Scholar]
- Hattar S, Kumar M, Park A, Tong P, Tung J, Yau KW, Berson DM. Central projections of melanopsin-expressing retinal ganglion cells in the mouse. J Comp Neurol. 2006;497:326–349. doi: 10.1002/cne.20970. [DOI] [PMC free article] [PubMed] [Google Scholar]
- Haverkamp S, Inta D, Monyer H, Wässle H. Expression analysis of green fluorescent protein in retinal neurons of four transgenic mouse lines. Neurosci. 2009;160:126–139. doi: 10.1016/j.neuroscience.2009.01.081. [DOI] [PubMed] [Google Scholar]
- Hodgson AJ, Penke B, Erdei A, Chubb IW, Somogyi P. Antisera to gamma-aminobutyric acid. I. Production and characterization using a new model system. J Histochem Cytochem. 1985;33:229–239. doi: 10.1177/33.3.3973378. [DOI] [PubMed] [Google Scholar]
- Hu EH, Bloomfield SA. Gap junctional coupling underlies the short-latency spike synchrony of retinal α ganglion cells. J Neurosci. 2003;23:6768–6777. doi: 10.1523/JNEUROSCI.23-17-06768.2003. [DOI] [PMC free article] [PubMed] [Google Scholar]
- Ingham ES, Günhan E, Fuller PM, Fuller CA. Immunotoxin-induced ablation of melanopsin retinal ganglion cells in a non-murine mammalian model. J Comp Neurol. 2009;516:125–140. doi: 10.1002/cne.22103. [DOI] [PubMed] [Google Scholar]
- Ito T, Hioki H, Nakamura K, Tanaka Y, Nakade H, Kaneko T, Iino S, Nojyo Y. Gamma-aminobutyric acid-containing sympathetic preganglionic neurons in rat thoracic spinal cord send their axons to the superior cervical ganglion. J Comp Neurol. 2007;502:113–25. doi: 10.1002/cne.21309. [DOI] [PubMed] [Google Scholar]
- Jeon CJ, Strettoi E, Masland RH. The major cell populations of the mouse retina. J Neurosci. 1998;18:8936–8946. doi: 10.1523/JNEUROSCI.18-21-08936.1998. [DOI] [PMC free article] [PubMed] [Google Scholar]
- Jusuf PR, Lee SC, Hannibal J, Grunert U. Characterization and synaptic connectivity of melanopsin-containing ganglion cells in the primate retina. Eur J Neurosci. 2007;26:2906–2921. doi: 10.1111/j.1460-9568.2007.05924.x. [DOI] [PubMed] [Google Scholar]
- Kanjhan R, Vaney DI. Semi-loose seal Neurobiotin electroporation for combined structural and functional analysis of neurons. Pflugers Arch. 2008;457:561–8. doi: 10.1007/s00424-008-0539-9. [DOI] [PubMed] [Google Scholar]
- Kihara AH, de Castro LM, Moriscot AS, Hamassaki DE. Prolonged dark adaptation changes connexin expression in the mouse retina. J Neurosci Research. 2006;83:1331–1341. doi: 10.1002/jnr.20815. [DOI] [PubMed] [Google Scholar]
- Kong JH, Fish DR, Rockhill RL, Masland RH. Diversity of ganglion cells in the mouse retina: unsupervised morphological classification and its limits. J Comp Neurol. 2005;489:293–310. doi: 10.1002/cne.20631. [DOI] [PubMed] [Google Scholar]
- Kreuzberg MM, Deuchars J, Weiss E, Schober A, Sonntag S, Wellershaus K, Draguhn A, Willecke K. Expression of connexin30.2 in interneurons of the central nervous system in the mouse. Mol Cell Neurosci. 2008;37:119–134. doi: 10.1016/j.mcn.2007.09.003. [DOI] [PubMed] [Google Scholar]
- Li RS, Chen BY, Tay DK, Chan HH, Pu ML, So KF. Melanopsin-expressing retinal ganglion cells are more injury-resistant in a chronic ocular hypertension model. Invest Ophthalmol Vis Sci. 2006;47:2951–2958. doi: 10.1167/iovs.05-1295. [DOI] [PubMed] [Google Scholar]
- Lin B, Masland RH. Populations of wide-field amacrine cells in the mouse retina. J Comp Neurol. 2006;499:797–809. doi: 10.1002/cne.21126. [DOI] [PubMed] [Google Scholar]
- Meister M, Berry MJ. The neural code of the retina. Neuron. 1999;22:435–450. doi: 10.1016/s0896-6273(00)80700-x. [DOI] [PubMed] [Google Scholar]
- Morin LP, Blanchard JH, Provencio I. Retinal ganglion cell projections to the hamster suprachiasmatic nucleus, intergeniculate leaflet, and visual midbrain: bifurcation and melanopsin immunoreactivity. J Comp Neurol. 2003;465:401–416. doi: 10.1002/cne.10881. [DOI] [PubMed] [Google Scholar]
- Pan F, Paul DL, Bloomfield SA, Völgyi B. Connexin36 is required for gap junctional coupling of most ganglion cell subtypes in the mouse retina. J Comp Neurol. 2010;517:911–927. doi: 10.1002/cne.22254. [DOI] [PMC free article] [PubMed] [Google Scholar]
- Panzanelli P, Fritschy JM, Yanagawa Y, Obata K, Sassoè-Pognetto M. GABAergic phenotype of periglomerular cells in the rodent olfactory bulb. J Comp Neurol. 2007;502:990–1002. doi: 10.1002/cne.21356. [DOI] [PubMed] [Google Scholar]
- Müller Pérez de Sevilla L, Shelley J, Weiler R. Displaced amacrine cells of the mouse retina. J Comp Neurol. 2007;505:177–189. doi: 10.1002/cne.21487. [DOI] [PubMed] [Google Scholar]
- Müller Pérez de Sevilla L, Dedek K, Janssen-Bienhold U, Meyer A, Kreuzberg MM, Lorenz S, Willecke K, Weiler R. Expression and modulation of connexin30.2, a novel gap junction protein in the mouse retina. Vis Neurosci. 2010;11:1–11. doi: 10.1017/S0952523810000131. [DOI] [PubMed] [Google Scholar]
- Pires SS, Hughes S, Turton M, Melyan Z, Peirson SN, Zheng L, Kosmaoglou M, Bellingham J, Cheetham ME, Lucas RJ, Foster RG, Hankins MW, Halford S. Differential expression of two distinct functional isoforms of melanopsin (Opn4) in the mammalian retina. J Neurosci. 2009;29:12332–12342. doi: 10.1523/JNEUROSCI.2036-09.2009. [DOI] [PMC free article] [PubMed] [Google Scholar]
- Provencio I, Rollag MD, Castrucci AM. Photoreceptive net in the mammalian retina. Nature. 2002;415:493. doi: 10.1038/415493a. [DOI] [PubMed] [Google Scholar]
- Schmidt TM, Taniguchi K, Kofuji P. Intrinsic and extrinsic light responses in melanopsin-expressing ganglion cells during mouse development. J Neurophysiol. 2008;100:371–384. doi: 10.1152/jn.00062.2008. [DOI] [PMC free article] [PubMed] [Google Scholar]
- Schmidt TM, Kofuji P. Functional and morphological differences among intrinsically photosensitive retinal ganglion cells. J Neurosci. 2009;29:476–482. doi: 10.1523/JNEUROSCI.4117-08.2009. [DOI] [PMC free article] [PubMed] [Google Scholar]
- Schubert T, Degen J, Willecke K, Hormuzdi SG, Monyer H, Weiler R. Connexin36 mediates gap junctional coupling of alpha-ganglion cells in mouse retina. J Comp Neurol. 2005a;485:191–201. doi: 10.1002/cne.20510. [DOI] [PubMed] [Google Scholar]
- Schubert T, Maxeiner S, Krüger O, Willecke K, Weiler R. Connexin45 mediates gap junctional coupling of bistratified ganglion cells in the mouse retina. J Comp Neurol. 2005b;490:29–39. doi: 10.1002/cne.20621. [DOI] [PubMed] [Google Scholar]
- Sekaran S, Lupi D, Jones SL, Sheely CJ, Hattar S, Yau KW, Lucas RJ, Foster RG, Hankins MW. Melanopsin-dependent photoreception provides earliest light detection in the mammalian retina. Curr Biol. 2005;15:1099–1107. doi: 10.1016/j.cub.2005.05.053. [DOI] [PMC free article] [PubMed] [Google Scholar]
- Sekaran S, Foster RG, Lucas RJ, Hankins MW. Calcium imaging reveals a network of intrinsically light-sensitive inner-retinal neurons. Curr Biol. 2003;13:1290–1298. doi: 10.1016/s0960-9822(03)00510-4. [DOI] [PubMed] [Google Scholar]
- Sholl DA. Dendritic organization in the neurons of the visual and motor cortices of the cat. J Anat. 1953;87:387–406. [PMC free article] [PubMed] [Google Scholar]
- Sun W, Li N, He S. Large-scale morphological survey of mouse retinal ganglion cells. J Comp Neurol. 2002;451:115–126. doi: 10.1002/cne.10323. [DOI] [PubMed] [Google Scholar]
- Tu DC, Zhang D, Demas J, Slutsky EB, Provencio I, Holy TE, Van Gelder RN. Physiologic diversity and development of intrinsically photosensitive retinal ganglion cells. Neuron. 2005;48:987–999. doi: 10.1016/j.neuron.2005.09.031. [DOI] [PubMed] [Google Scholar]
- Vessey JP, Lalonde MR, Mizan HA, Welch NC, Kelly ME, Barnes S. Carbenoxolone inhibition of voltage-gated Ca channels and synaptic transmission in the retina. J Neurophysiol. 2004;92:1252–1256. doi: 10.1152/jn.00148.2004. [DOI] [PubMed] [Google Scholar]
- Viney TJ, Balint K, Hillier D, Siegert S, Boldogkoi Z, Enquist LW, Meister M, Cepko CL, Roska B. Local retinal circuits of melanopsin-containing ganglion cells identified by transsynaptic viral tracing. Curr Biol. 2007;17:981–988. doi: 10.1016/j.cub.2007.04.058. [DOI] [PubMed] [Google Scholar]
- Völgyi B, Xin D, Amarillo Y, Bloomfield SA. Morphology and physiology of the polyaxonal amacrine cells in the rabbit retina. J Comp Neurol. 2001;440:109–125. doi: 10.1002/cne.1373. [DOI] [PubMed] [Google Scholar]
- Völgyi B, Abrams J, Paul DL, Bloomfield SA. Morphology and tracer coupling pattern of alpha ganglion cells in the mouse retina. J Comp Neurol. 2005;492:66–77. doi: 10.1002/cne.20700. [DOI] [PMC free article] [PubMed] [Google Scholar]
- Völgyi B, Cheda S, Bloomfield SA. Tracer coupling patterns of the ganglion cell subtypes in the mouse retina. J Comp Neurol. 2009;512:664–87. doi: 10.1002/cne.21912. [DOI] [PMC free article] [PubMed] [Google Scholar]
- Weng S, Wong KY, Berson DM. Circadian modulation of melanopsin-driven light response in rat ganglion-cell photoreceptors. J Biol Rhythms. 2009;24:391–402. doi: 10.1177/0748730409343767. [DOI] [PMC free article] [PubMed] [Google Scholar]
- Wolansky T, Pagliardini S, Greer JJ, Dickson CT. Immunohistochemical characterization of substance P receptor (NK(1)R)-expressing interneurons in the entorhinal cortex. J Comp Neurol. 2007;502:427–441. doi: 10.1002/cne.21338. [DOI] [PubMed] [Google Scholar]
- Wright LL, Vaney DI. The type 1 polyaxonal amacrine cells of the rabbit retina: a tracer-coupling study. Vis Neurosci. 2004;21:145–155. doi: 10.1017/s0952523804042063. [DOI] [PubMed] [Google Scholar]