

Abstract
Infants born to mothers taking selective serotonin reuptake inhibitors (SSRIs) late in pregnancy have been reported to exhibit signs of antidepressant withdrawal. Such evidence suggests that these drugs access the fetal brain in utero at biologically significant levels. Recent studies in rodents have revealed that early exposure to antidepressants can lead to long lasting abnormalities in adult behaviors, and result in robust decreases in the expression of a major serotonin synthetic enzyme (tryptophan hydroxylase) along the raphe midline. In the present investigation, we injected rat pups with citalopram (CTM: 5mg/kg, 10mg/kg, and 20mg/kg) from postnatal days 8–21, and examined serotonin transporter (SERT) labeling in the hippocampus, ventrobasal thalamic complex, and caudate-putamen when the subjects reached adulthood. Our data support the idea, that forebrain targets in receipt of innervation from the raphe midline are particularly vulnerable to the effects of CTM. SERT-immunoreactive fiber density was preferentially decreased throughout all sectors of the hippocampal formation, while the subcortical structures, each supplied by more lateral and rostral aspects of the raphe complex, respectively, were not significantly affected. Reductions in SERT staining were also found to be dose-dependent. These findings suggest that SSRIs may not only interfere with the establishment of chemically balanced circuits in the neonate, but also impose selective impairment on higher cortical function and cognitive processes via more circumscribed (i.e. regionally specific) deficits in 5-HT action.
Keywords: serotonin, antidepressant, development, dorsal raphe, reuptake inhibitor
Introduction
Serotonin (5-HT) has long been documented to play a critical trophic role in early brain development (Lauder, 1990; Azmitia, 2001; Gaspar et al., 2003). One unique developmental feature concerning 5-HT is its transient presence in thalamocortical afferents, particularly those involved in primary sensory circuits (D’Amato et al., 1987; Bennett-Clarke et al., 1996; Lebrand et al., 1998). Hence, manipulations of brain 5-HT levels either through genetic means or perinatal drug treatments have been shown to affect not only cortical organization related to barrel formation, but also behaviors associated with aggression and/or anxiety-related behaviors (Cases et al., 1996; Holmes et al., 2003; Ansorge et al., 2004; Mirmiran et al., 1981; Hansen et al., 1997; Persico et al., 2001; Xu et al., 2004). These findings suggest that abnormal development of the 5-HT system could lead to altered wiring of neural circuits and inappropriate behavior.
Clinically, one group of antidepressants, namely selective serotonin reuptake inhibitors (SSRIs), has been recommended for treatment of affective disorders during pregnancy and lactation, due in part to the perceived low toxicity of the drug to both mother, fetus, and infant (Cohen et al., 2004; Wisner et al., 2000). However, several recent studies also show that significant SSRI levels and metabolite concentrations can be detected in umbilical cord blood and amniotic fluid in mothers taking such medications during pregnancy (Hendrick et al., 2003; Hostetter et al., 2000). Interestingly, children exposed to SSRIs in utero exhibit signs of antidepressant withdrawal, i.e. insomnia, diarrhea, sweating, vomiting, and tremors, in the first few weeks of life, and some display behavioral abnormalities during their first few years (Casper et al., 2003; Sanz et al., 2005; Zeskind and Stephens, 2004). It should be noted, that no study has followed these children into adulthood. Hence, the precise consequences of perinatal exposure to SSRIs remain poorly understood.
Recently, our laboratory has reported that chronic (PN8-21) neonatal exposure to citalopram (CTM; the most selective SSRI) not only leads to profound reductions in the expression of tryptophan hydroxylase (TPH, the rate limiting enzyme in the synthesis of 5-HT) in the midline subgroup of the dorsal raphe nuclear complex (DR) and median raphe (MR), but also decreases the density of SERT-immunoreactive (ir) fibers in the medial prefrontal and primary somatosensory cortices (Maciag et al., 2006). Male subjects that received drug treatment, furthermore, demonstrated evidence of increased locomotor activity and decreased sexual drive as adults. Since previous neuroanatomical studies have implicated projections from the midline DR and MR in the afferent innervation of the hippocampus (HIP)(Vertes, 1999), we decided to test the hypothesis that targets of the midline raphe are preferentially effected by CTM administration. To do this, we examined whether there was selective loss of SERT-ir fibers in the HIP, as opposed to structures that are predominantly innervated by more lateralized or rostral aspects of the DR, such as the ventrobasal nucleus of the dorsal thalamus (VB) and caudate-putamen of the basal ganglia (C-P), respectively (Waterhouse et al., 1986; Imai et al., 1986; Vertes, 1991; Kirifides et al., 2001). We further characterized the dose-dependence of this response with varying concentrations of CTM (5, 10, 20mg/kg/day), and report here that the terminal fields of the midline raphe are pre-disposed to the effects of neonatal CTM; higher levels producing more robust reductions in SERT-ir.
Materials and Methods
All procedures were approved by the UMMC Animal Care and Use Committee and complied with AAALAC and NIH guidelines. Rats were weaned at PN28 and housed in groups of 2–3/cage under standard laboratory conditions with ad lib access to food and water. After their course of drug treatment, rats were left undisturbed until the time of sacrifice.
Treatment, dosing, and experimental subsets
Shortly after the delivery of time-pregnant Long Evans rats, the male offspring were selected and cross fostered to produce litters of 4–5 pups. The pups were tattooed for identification based on which treatment they would receive. Beginning on postnatal (PN) day 8, the pups were handled briefly and injected subcutaneously with citalopram (CTM; 2.5, 5, or 10mg/kg) (Tocris, Ellisville, MO) or saline in a volume of 0.1ml twice daily for 14 days (PN8-21).
The doses indicated above were selected for several reasons. In particular, the rationale for 10mg/kg treatments is discussed in our previous report (Maciag et al., 2006). Basically, it is assumed that SSRIs do not interfere with events during early development. Pregnant women and young children that are exposed to such drugs, are unaware of any potential health-related risk to the CNS. However, a previous study has shown that antidepressant agents, such as chlorimipramine (which acts in part on the serotonin system) can alter adult behavior in rats, if subjects are treated with the drug as a neonate (Mirmiran et al., 1981). A dose of 10mg/kg was used in this previous study, so we opted to use a similar dose in our initial studies with citalopram. Further review of the literature suggests that the therapeutic range (and the dose range most commonly prescribed for humans) is between 20–60mg/kg (Mendels et al.,1990). Keeping this in mind, additional doses were selected (5 and 20 mg/kg) to permit study of the dose-response, and the determination of potential minimum and maximum effects of CTM treatment. The 10mg/kg dose also permitted comparisons to be made between our current and previous findings. We were able to compare CTM-induced effects in the HIP with medial prefrontal cortex and somatosensory cortex.
Subjects from each treatment group were then assigned to an experimental subset. One of the reasons for such case pairings/groupings, was to permit simultaneous side by side evaluations of SERT-staining patterns. This increased our capability of establishing neurochemical differences between treatment groups. Initial subsets were composed of one saline and one CTM10 subject. Here, our first comparisons were just between saline and 10mg/kg CTM treated rats. However, later dose-response experiments utilized experimental subsets that consisted of four subjects, each from a different treatment group. Represented within one of these latter experimental subsets was one subject from the “saline”, “CTM5”, “CTM10”, and “CTM20” treatment groups. Tissue from one experimental subset was processed together in the same reaction chamber and exposed to the same antiserum solutions to minimize staining variability. In the current study, CTM10 to saline comparisons were based on a total of 8–11 experimental subsets, while dose-response experiments were based on 3–6 experimental subsets. Subset number varied according to target. For example, in dose-response experiments (see Fig. 7) SERT-ir labeling was examined in n=3 subsets within C-P, but n=6 subsets within dHIP. This variability stemmed from the fact that not all subsets contained certain tissue sections. The C-P, for instance, was the last structure to be included in our analysis, and hence was not represented by as many cases as dHIP.
Figure 7.
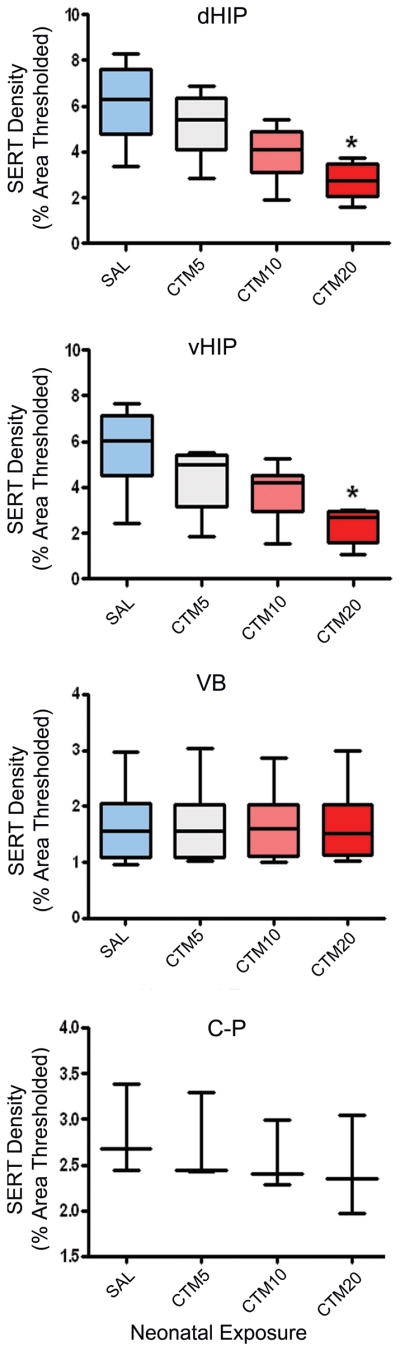
Graphs comparing SERT-ir fiber density within dHIP, vHIP, VB and C-P of saline-, CTM5-, CTM10-, and CTM20-treated rats. Data represent the median, 25% and 75% percentile (box) and the minimum and maximum (whiskers) values of 3–6 subsets per group. Kruskal-Wallis statistic = 11.24, p = 0.05, and 9.60, p = 0.05 for dHIP and vHIP, respectively. No effect of treatment was detected for VB and C-P. *p = 0.05, Dunn’s Multiple Comparison.
Animal sacrifice protocol
At PN>100, adult rats were randomly chosen for perfusion and immunostaining. After deeply anesthetizing with Nembutal (50mg/kg; ip), rats were perfused through the ascending aorta with saline followed by 3.5% paraformaldehyde in 0.1M phosphate buffered saline (PBS). The brains were removed and placed in the same fixative containing 25% sucrose overnight at 4°C. Brains were marked using thin copper wires. Strategic placement of the wire along the rostrocaudal axis of the brainstem and basal forebrain (avoiding areas of interest) permitted each brain to be identified according to treatment. This procedure leaves a small hole as a means to decipher one animal from another.
Protocol for immunohistochemistry
To quantify the effects of neonatal SSRI treatment on SERT expression within target regions of the raphe, fluorescent immunohistochemical techniques were employed. Brains were cut with an AO freezing microtome at 40um. The tissue was sectioned in the coronal plane, and permitted to freely float in small, individual wells of phosphate buffered saline (PBS). Sections through the HIP, VB, and C-P were selected from tissue samples that were collected for each experimental subset. Areas of interest were identified in each case and a series of sections was removed (1 in every 6 sections). Keeping all tissue from an experimental subset together, sections were processed using a rabbit anti-SERT antibody (1:1000; L# 24330, antigen: rat 5-HT transporter (602–622) coupled to KLH and raised in rabbit; polyclonal, Immunostar, Hudson, WI) followed by incubation with a biotinylated secondary antibody (ABC kit, Vector Laboratories, Burlingame, CA). Neuronal profiles were visualized using streptavidin conjugated-Cy3 (red, 1:200, Jackson Immunoresearch Laboratories, Inc., West Grove, PA). Tissue from the different cases/treatment groups was then reassembled and mounted on gelatin-coated slides and covered with DPX.
To control for non-specific labeling, we conducted a set of experiments where sections were processed according to protocol, except the primary antisera for SERT was omitted. Following this procedure, no immunoreactivity was detected. Further control studies, where an inappropriate secondary antibody was used for linkage, yielded the same (negative) result.
Data Analysis for SERT Immunohistochemistry Fiber Density
In order to semi-quantitatively analyze alterations in SERT density that were attributable to SSRI treatment, digital photomicrographs of desired sections (HIP, VB, and C-P) were taken at a magnification of 40× using a Nikon E800 epifluorescent microscope. This magnification yielded terminal field dimensions that measured 200 ×200um2. For a given case, 2–3 tissue sections were photographed through each target area. For HIP, data was collected from each of the three major HIP subdivisions: CA1, CA3, and the hilus region of dorsal and ventral hippocampus (dHIP and vHIP, respectively). One to two images were acquired from each subdivision per tissue section for the purpose of determining whether certain regions of the HIP are selectively affected by drug treatment. The images were first “flattened/skeletonized” to more readily distinguish objects of interest from background distortions. A “thresholding” overlay was then applied to each image in order to delineate objects of interest (i.e. SERT-ir fibers). This utility specifies which information is to be extracted for measurement consideration. In the analysis of innervation density, the “percentage of thresholded area” was determined for each image. This measurement refers to the proportion of the entire digital image that was thresholded. Values from each subregion were tabulated across sections and recorded as an average value for that region in that case. Data from similar treatment groups (either saline- or CTM10-treated) was then pooled, and median, 25%, and 75% values were derived separately for each target area. Statistical significance of CTM10-induced decreases in SERT-ir fiber density within each terminal field region was determined using the Wilcoxon signed rank test. When W (the sum of signed ranks) is far from zero, the p value is small. Data that was acquired from dose-response experimental subsets was similarly analyzed. Values relating to each dose were pooled and statistical analysis was performed using Kruskal-Wallis statistics followed by Dunn’s multiple comparison test.
Results
Neonatal Exposure to CTM selectively affects SERT immunoreactivity in cortical, but not subcortical structures
Given the possibility that changes in the expression profiles of serotonergic cell bodies (Maciag et al., 2006) translate into changes within terminal processes of raphe target sites, the SERT-ir fiber density within the HIP (target of midline DR, caudal DR and MR), VB (target of DR lateral wing), and C-P (target of rostral DR) was assessed. Representative photomicrographs in Figure 1 demonstrate that a decrease in SERT-ir fiber density is observed within the dHIP (dCA1: A1, B1) and vHIP (vCA1: A2, B2), but not within the VB (A3, B3), nor C-P (A4, B4) of CTM10 treated rats compared to saline controls. Quantitative analysis revealed that the decrements in CTM10-induced SERT density were significant within each hippocampal subdivision (Table 1). The median SERT-ir fiber density within the dCA1 of CTM10 treated rats was 4.37% of the sampled area, while saline treated subjects revealed a median thresholded area of 5.78%. When SERT-ir fiber density was expressed as a function of baseline scores in controls, a decrease of ~24.4% was noted. Similarly, the median SERT-ir fiber density in dCA3 of CTM10 treated animals was 5.41% of the sampled area, while saline controls were found to exhibit a thresholded area of 7.43%. The corresponding decrement between the two treatment groups was calculated to be ~27%. Comparisons in the hilus revealed a median SERT-ir fiber density of 2.48% in the CTM10 treatment group and 3.67% in the saline treatment group. The reduction corresponded to an apparent loss of ~32% of SERT-ir innervation. Within the subdivisions of the vHIP (vCA1 and vCA3), the median SERT-ir density of CTM10 treated rats was 3.47% and 4.87% of the sampled area, respectively. Saline controls from the corresponding experimental subsets exhibited thresholded areas of 5.07% and 6.51%. Normalization of this data indicated a loss of SERT-ir fibers on the order of ~32% and ~25% from baseline values in saline treated rats. Overall, CTM treatment was found to promote a loss of ~28.5% of SERT-ir fibers in the HIP.
Figure 1.

Representative photomicrographs of SERT expression, visualized with Cy3, within dCA1, vCA1, VB, and C-P in adult rats treated with saline (A1-A4) and CTM10 (B1-B4) from PN8-21. Note that a decrease in SERT-ir fiber density can be seen within the dHIP and vHIP in CTM10-treated rats compared to saline. In contrast, CTM treatment does not appear to affect fiber density within VB or C-P. Scale bar = 50um.
Table 1.
Change in SERT-ir fiber density within HIP subdivisions of CTM10 treated rats (compared to saline)
| Region | Median (25%,75% percentile) | Wilcoxon W | p value | n | |
|---|---|---|---|---|---|
| Saline | Citalopram | ||||
| dCA1 | 5.78 (3.7,7.1) | 4.37 (2.0,4.9) | 66.0 | = 0.001 | 22 (11 subsets) |
| dCA3 | 7.43 (4.9,9.7) | 5.41 (2.4,6.9) | 66.0 | = 0.001 | 22 (11 subsets) |
| Hilus | 3.67 (2.0,4.5) | 2.48 (2.0,3.3) | 60.0 | = 0.005 | 22 (11 subsets) |
| vCA1 | 5.07 (3.9,5.3) | 3.47 (2.7,4.3) | 36.0 | = 0.008 | 16 (8 subsets) |
| vCA3 | 6.51 (5.7,8.0) | 4.87 (4.1,5.1) | 36.0 | = 0.008 | 16 (8 subsets) |
Data were analyzed using Wilcoxon signed rank tests
In addition, the relative differences in SERT-ir fiber density that were observed between subdivisions of the dorsal and ventral hippocampus were unaltered by neonatal CTM10 treatment (Figure 2). In saline-treated rats, the density within the CA3 was the highest, followed by the CA1 subdivision, then the hilus. This trend in relative SERT density is reasonably consistent in CTM10 treated rats even though the SERT density was decreased. This observation suggests that all hippocampal subdivisions are, for the most part, equally affected by neonatal SSRI treatment.
Figure 2.

Chart showing relative SERT density within subdivisions of dorsal and ventral hippocampus of one experimental subset (dCA3 = vCA3 > dCA1 = vCA1 > hilus). Note that the relative SERT density does not change with CTM10 treatment.
Since neonatal CTM treatment appears to affect all hippocampal subdivisions similarly, data across different HIP subdivisions was combined. Figure 3 graphically displays the results of a semi-quantitative analysis performed on various forebrain terminal regions. The median SERT-ir fiber density within the dHIP of CTM10 treated rats was 4.08%, while saline treated animals demonstrated a thresholded area of 5.62%; a ~27% difference between the two groups when CTM values were expressed as a function of saline controls. In the vHIP, CTM10-treated rats showed a thresholded area of 4.17%, while saline treated subjects exhibited a SERT-ir fiber density of 5.79%; an apparent drop in SERT-positive profiles that practically mirrored dHIP (~28%). The reductions in SERT density within these regions reached statistical significance (both dHIP and vHIP; p ≤ 0.008). On the other hand, the change in SERT density within the VB of CTM10 treated rats was negligible. Compared to saline controls, which demonstrated a SERT-ir fiber density of 1.61%, the median thresholded area for CTM10-treated rats was 1.62%. Lastly, there was a small decrease in SERT-ir fiber density that was observed in the C-P of CTM10 treated rats. The median thresholded area for CTM10-treated subjects was 2.55%, while saline controls exhibited a sampled area of 2.83%. This reduction, approximately 10% from baseline values, did not reach statistical significance.
Figure 3.

Graph comparing SERT-ir fiber density within dHIP, vHIP, VB, and C-P of saline- and CTM10-treated rats. Data represent the median, 25% and 75% percentile (box) and the minimum and maximum (whiskers) values of 8–11 subsets per group. *p = 0.001, W = 66.0 (dHIP) and *p = 0.008, W = 36.0 (vHIP) using the Wilcoxon signed rank test. Saline and CTM did not differ in VB and C-P.
We also examined hippocampal tissue sections for qualitative changes in SERT fiber morphology, because neonatal CTM10 treatment has been shown to influence the morphology of SERT labeled axons within the cortex of rats that were sacrificed as adults (Maciag et al., 2006). Axons have been reported to take on a discontinuous or “beaded” appearance due to the lack of immunolabeling within intervaricose segments. In addition, the current study has revealed a second population of axons. Thick fibers, exhibiting intense fluorescence, were found in conjunction with CTM treatment. Representative photomicrographs in Figure 4 demonstrate a few examples of these thick axons within dCA1 (A), dCA3 (B), and C-P (C) of CTM10 treated rats. These thick axons are readily observed within all subdivisions of the dHIP and vHIP, but are rarely seen in saline treated rats. Furthermore, alterations in axonal morphology are infrequently observed within the VB.
Figure 4.
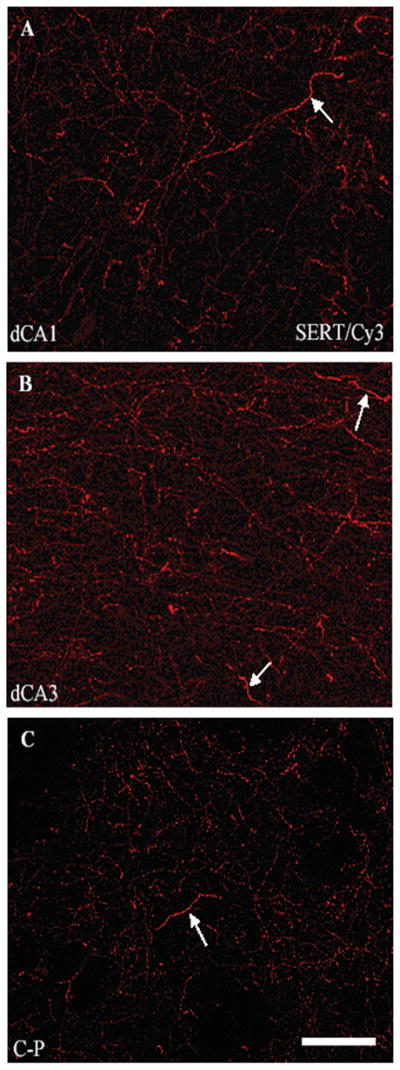
Representative photomicrographs of SERT-ir fibers visualized with Cy3 within subdivisions of dCA1 (A), dCA3 (B), and C-P (C) of CTM10 treated rats. These images show changes in axonal morphology (presence of “thick axons” depicted by arrows: note also evidence of “beaded fibers’) after CTM treatment. Scale bar = 50um.
SERT-ir fiber density following exposure of neonates to different doses of CTM
Adult rats (n=3–6 subsets) were examined after they had been treated neonatally with different doses of CTM. In specific, SERT-ir fiber density was evaluated in dHIP, vHIP, VB, and C-P after rats had been exposed to CTM5, CTM10, and CTM20. Representative photomicrographs through the dCA1 (and VB) in Figure 5(A1-A4) demonstrate the dramatic step-wise decrease in SERT-ir fiber density that was observed within all subdivisions of dHIP and vHIP with increasing concentrations of CTM. This pattern of declining SERT-ir is similar from HIP subregion to subregion, and is illustrated in Table 2 and the Figure 6 bar graph. More specifically, the median thresholded area for CTM5 treated subjects in dCA1, dCA3, the hilus, vCA1, and vCA3 was 5.145, 7.460, 3.355, 4.450, and 5.520, compared to baseline values in saline treated rats of 6.170, 8.940, 3.670, 5.185, and 6.860, respectively. The percentage of lost immunoreactivity corresponded to 16.6%, 16.6%, 8.6%, 14.2%, and 19.5%. Likewise, for CTM10 treated subjects, the sampled SERT-ir fiber density was revealed to be 3.930, 5.720, 2.620, 3.470, and 4.855. Normalized values indicated a decrease of 36.3%, 36.0%, 28.6%, 33.1%, and 29.2%, respectively. Calculations performed on data collected in CTM20-treated rats showed thresholded areas of 2.730, 3.985, 1.480, 2.470, and 2.920. Staining decrements for these subdivisions were determined to be on the order of 55.8%, 55.4%, 59.7%, 52.4%, and 57.4%, respectively. Taken together, CTM5 treatment promotes a loss of 8.6–19.5% of SERT-ir fibers, CTM10 treatment results in a loss of 28.6–36.3% of SERT-ir fibers, and CTM 20 treatment is associated with a reduction in SERT-ir innervation density on the order of 52.4–9.7%.
Figure 5.

Representative photomicrographs of SERT/Cy3 labeled fibers within dCA1 and VB of saline-, CTM5-. CTM10-, and CTM20-treated rats. Within the dCA1, the trend is for decreased labeling with increasing doses of CTM. Note: this trend is not evident within VB. Scale bar = 50um.
Table 2.
Change in SERT-ir fiber density within HIP subdivisions of CTM 5, 10, and 20 treated rats (compared to saline)
| Region | Median (25%, 75% percentile) | Kruskal-Wallis H | p value | n | |||
|---|---|---|---|---|---|---|---|
| Saline | Citalopram (mg/kg) | ||||||
| 5 | 10 | 20 | |||||
| dCA1 | 6.17 (4.6,7.6) | 5.15 (4.3,6.0) | 3.93 (3.0,4.8) | 2.73 (2.1,3.5) | 11.52 | = 0.009 | 24 (6 subsets) |
| dCA3 | 8.94 (6.5,10.9) | 7.46 (5.2,9.1) | 5.72 (4.0,6.9) | 3.99 (2.8,4.9) | 11.70 | = 0.009 | 24 (6 subsets) |
| Hilus | 3.67 (2.9,4.9) | 3.36 (2.5,4.3) | 2.62 (1.8,3.2) | 1.48 (1.2,2.3) | 11.98 | = 0.007 | 24 (6 subsets) |
| vCA1 | 5.19 (3.6,5.7) | 4.45 (2.5,4.5) | 3.47 (2.2,3.9) | 2.47 (1.1,2.6) | 8.92 | = 0.030 | 24 (6 subsets) |
| vCA3 | 6.86 (5.4,8.4) | 5.52 (3.8,6.3) | 4.86 (3.6,5.3) | 2.92 (2.0,3.3) | 10.73 | = 0.010 | 24 (6 subsets) |
Data were analyzed using Kruskal-Wallis analysis of variance
Figure 6.
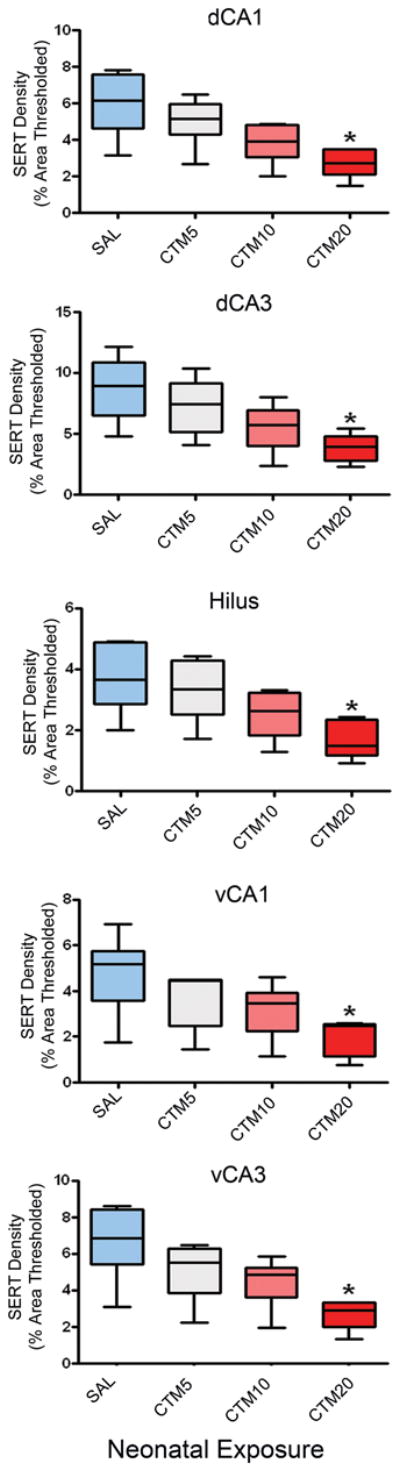
Change in SERT density within HIP subdivisions of CTM5-, CTM10-, and CTM20-treated rats. Data represent the median, 25% and 75% percentile (box) and the minimum and maximum (whiskers) values of 5–6 subsets per group. Kruskal-Wallis statistic = 11.52, p = 0.009; 11.70, p = 0.009; 11.98, p = 0.007; 8.92, p = 0.03 and; 10.73, p = 0.01 for dCA1, dCA3, hilus, vCA1 and vCA3, respectively. *p = 0.05, Dunn’s Multiple Comparison.
The striking loss of SERT-ir fibers in HIP is even more evident when data across HIP subdivisions is combined into just two sectors, dHIP and vHIP, and analyzed with respect to VB and C-P. These results are graphically depicted in Figure 7, where the incremental decrease in the HIP SERT-ir fiber population stands in sharp contrast to the unchanging number of labeled axon profiles in VB and C-P across the CTM dosing range. It is worthwhile to mention, that although there was an obvious decrease in the density of SERT-ir fibers in each zone of HIP at lower doses of CTM, statistical significance relative to the saline treatment group was only achieved following exposure to CTM20 (p < 0.05). These findings differ slightly from data demonstrated in Fig. 3, where values for CTM10 were indeed also found to be statistically significant. However, as will be remarked upon in the discussion, this discrepancy can be attributed to a smaller number of cases per treatment group in the dose-response analysis, and also to inherent staining variability, that we, in fact, attempted to compensate for through the use of “subset” tissue processing.
Specific values for each of the treatment groups (that appear in Figure 7) are listed according to brain region. Following CTM5 treatment, median thresholded areas of SERT-ir in the dHIP, vHIP, VB, and C-P, were found to be 5.403, 5.015, 1.560, and 2.440, respectively. Corresponding calculations in saline treated groups were determined to be 6.308, 6.030, 1.560, and 2.680. Expression of these data as percentages revealed a 14.3% loss of SERT-ir fibers in dHIP, and a 16.8% reduction in vHIP after CTM5 exposure. Reductions in SERT innervation density within sampled areas after CTM10 treatment were recorded as follows: 4.088, 4.215, 1.605, and 2.400. These numbers translated into a 35.2% loss of SERT-ir fibers in dHIP, and a 30.1% decline in vHIP. The median area of labeling detected after CTM20 exposure was found to be 2.763, 2.695, 1.510, and 2.350, respectively. By normalizing these values, it was determined that dHIP sustained a 56.2% drop in SERT-ir fiber density, while a loss of 55.3% was incurred by the vHIP. In VB, the percentage of lost SERT-ir fibers ranged from 0–3.2% over the CTM5-CTM20 dose spectrum, while the proportion of decreased labeling in C-P spanned a measure of 9.0–12.3%.
Increased frequency of “thick” SERT-ir fibers with elevated levels of neonatal CTM
Careful examination of morphological changes in raphe terminal fields revealed two distinguishing features regarding SERT-ir axons. First, there is a clear association between increasing doses of neonatal CTM and a predisposition for increased numbers of thick SERT-ir fibers. Secondly, these fibers, when studied at high magnification, often exhibit a smooth, non-varicose profile (Fig. 8). As mentioned before, these alterations were most readily observed in dHIP, and vHIP. Such intensely fluorescent, thick axonal profiles were rarely evident in VB and C-P. The dose-dependence of this response was particularly evident after the distribution of SERT-ir fibers in HIP was mapped. Thick, SERT-ir fibers were found to be more prevalent after the administration of higher doses of CTM (CTM10 and CTM20), than with lower doses (CTM5)(Fig. 9).
Figure 8.
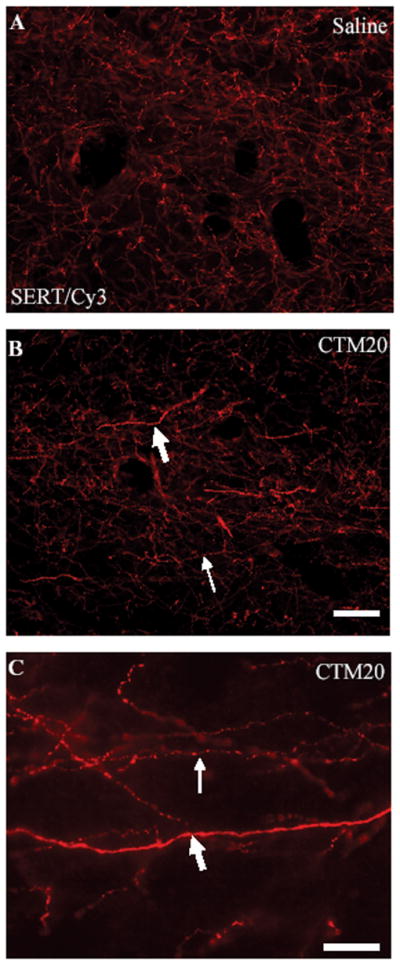
Representative photomicrographs of SERT-ir fibers visualized with Cy3 within dCA1 of a saline (A) and a CTM20 (B) treated rat. The image in (B) illustrates characteristic changes in axonal morphology that occur after CTM treatment. Notice the presence of “beading” (thin arrows), and “thick axons” (large arrows). The high powered view in (C) demonstrates differences in the texture of “thick” and “beaded” axons within dHIP of a CTM20 treated subject using 100× oil immersion. Note the lack of varicosities and swellings along the “thick” fiber. Scale bars = 25um.
Figure 9.

Schematic illustration of the distribution of “thick” SERT-ir axons after increasing doses of CTM. Each pane represents one section through the dorsal HIP of one rat in each treatment group. Note the clear predominance of “thick” SERT-ir fibers at the highest dose of CTM.
Discussion
The results of the present investigation show that neonatal exposure to the most selective SSRI, CTM, significantly reduces the expression of SERT in fibers of the hippocampus. In particular, we show that SERT-ir fiber density is significantly reduced throughout the entire hippocampal formation, and that subcortical structures, such as the caudate-putamen of the basal ganglia and the ventrobasal nucleus of the dorsal thalamus, are not as severely affected. Our findings also indicate that neonatal CTM treatment dose-dependently produces changes in the expression of SERT, such that higher doses cause a more pronounced decrease in SERT-ir, and lower doses result in less obvious losses in SERT fluorescent emissions. Taken together, our present work suggests that neonatal exposure to CTM can selectively alter the dynamics of serotonin transport within the cortex, and that marked imbalances in 5-HT neurotransmission may occur as a result of exposure to higher levels of the CTM dosing range.
Technical Considerations
In the current experiments, fluorescent immunohistochemical techniques were employed in order to assess neonatal CTM induced alterations in SERT-ir fiber density. In particular, changes in SERT density due to treatment were analyzed using semi-quantitative immunofluorescence. MetaMorph imaging software was utilized to acquire images of an experimental subset under identical exposure criteria. This was done to ensure that any quantifiable changes in SERT could be attributed to the treatment. With the MetaMorph program, user-defined threshold parameters (defined to include all SERT-labeled fibers) allowed for optimal detection of labeled fibers within a 200 × 200um2 sampling area. To avoid a sampling bias, 6–8 sampling areas were quantified (per case) in each subregion studied. This allowed for a thorough analysis across regions of interest.
This new quantitative approach has been gaining recognition in recent years as a means to assess changes in neurochemical expression profiles, not only in individual cell populations, but also in fiber density (Dreyer et al., 2004; Jaffar et al., 2001; Maciag et al., 2006; Zerbinatti et al., 2006). This approach offers the advantage of in situ analysis of functionally defined subzones of the nervous system, such as the discrete territories of the hippocampus (CA1, CA2, hilus) and thalamus (VB). These regions cannot be as easily studied with Western blot analysis.
A point worth discussing relates to the fact that, dose-response analysis did not reveal the same statistically significant changes between saline and CTM10-treated animals (Fig. 7) as were observed with earlier, direct comparisons between the two groups (Fig. 3). We attribute these findings to two main reasons. First, the larger sample size (n = 8–11 subsets) that was used in the saline: CTM10 comparisons, was better able to define labeling trends, than the smaller subset size used in the dose-response experiments; even though patterns of reduced SERT-staining were evident in the dose-response studies. Second, immunohistochemical staining is known to vary depending upon the conditions under which it is performed. Factors which can influence staining include the age of the antibody, the quality of the tissue perfusion, the age of the tissue post-sectioning, and the access of the tissue to the antibody solution (i.e. number of sections in reaction chamber). To help limit the extent of these variables, treatment groups in the current study were processed in “subsets” so that one saline treated animal (control) could be directly compared to one (or more) CTM-treated animals (experimental CTM5, CTM10, and/or CTM20 groups). When such processing occurred, all of the animals in the “subset” were perfused on the same day, tissue was sectioned and reacted (in the same chamber) on the same day, and sections were sequentially mounted on slides. Comparisons between cases in the same subset consistently revealed a striking decrement in SERT-labeling with increasing dose of CTM. However, the statistical significance of these staining differences may have been diluted when data was collectively examined (pooled together). This would be expected to a certain extent, given the discrepancy in fluorescent emissions that could occur between subsets as a result of any of the aforementioned factors. Yet despite, this potential numerical caveat, we are confident that we are witnessing a strong pattern of decreased SERT expression with neonatal CTM exposure.
Comparison with other studies
Recently, our laboratory has reported remarkable decreases (~40%) in SERT-ir fiber density within the medial prefrontal and primary somatosensory cortices of both neonates and adult rats treated with CTM10 from PN8-21 (Maciag et al., 2006). The present data indicates that citalopram (at a dose of 10mg/kg/day) decreases the SERT-ir fiber density within the dorsal and ventral hippocampus by 27% and 28% compared to saline, respectively. These changes resemble those previously reported in the medial prefrontal and primary somatosensory cortices (Maciag et al., 2006).
One of the most intriguing findings from the present study is that neonatal exposure to CTM appears to selectively alter SERT expression in fibers that originate from serotonergic neurons along the midline of the raphe complex. Support for this notion is based upon previous tracer studies that show, that neuronal subgroups along the midline of the DR and the median raphe preferentially target cortical structures such as the medial prefrontal cortex, primary somatosensory cortex, and the hippocampus (Waterhouse et al., 1986; Wang et al., 1995; Simpson et al., 2003; Lu et al., 2007; Vertes 1991, 1999). Some of these same studies have also evaluated the neurochemical complement of putative co-transmitters in midline cell groups and found, that they are, indeed, quite distinct from cell clusters that reside in more lateral aspects of the DR. More specifically, it has been demonstrated that most of the serotonin-containing neurons of the midline co-express nitric oxide (NO), and project to cortical levels of the neuraxis. In contrast, neurons belonging to the lateral wing subgroup of DR express either nNOS (neuronal nitric oxide synthase) or TPH, but not both, and following neonatal CTM treatment, do not exhibit a drop in TPH expression as dramatic as those residing along the midline (Maciag et al., 2006). Furthermore, the lateral wing provides afferent input to subcortical structures like the VB of the dorsal thalamus. It is, therefore, not surprising that SERT-positive profiles in VB and C-P (target of rostral DR)(Vertes, 1991; Imai et al., 1986) were minimally effected by our CTM treatment regimen. It is reasonable to assert that CTM exerts a differential effect upon the raphe projection system; promoting major shifts in the chemical composition of raphe neurons/fibers that access areas of higher order cognitive processing and executive function. This study is also the first to implicate an effect of SSRIs on the raphe projection to the hippocampus, and thereby leads us to believe that such drug exposure may result in deficits related to learning and memory.
Increasing doses of CTM and SERT-ir fiber density
The current data reveals a very strong dose-dependent effect on SERT density within the dorsal and ventral hippocampus. In general, the trend is for a ~15%, ~33%, and ~55% decrease in SERT-ir fiber density in animals treated with CTM5, CTM10, and CTM20, respectively. The dose-dependent alterations in SERT-ir fibers suggest that there is an initial overload of 5-HT within serotonin synapses, and that the SERT is down-regulated possibly in conjunction with TPH to compensate for the initial physiological “excess” of the indoleamine transmitter. This can pose serious potential problems with respect to 5-HT availability, development, and behavior. Esaki et al. (2005), for example, reported that mice lacking the SERT gene (5-HTT) show a decrease in somatosensory responses to sensory stimulation. Xu et al. (2004) have further shown that pharmacological treatment with paroxetine (another SSRI) from postnatal day 0 (P0) to P8 can directly effect thalamocortical axon organization in primary sensory cortex. Their evidence, when taken together, suggests an important role of the 5-HTT in the refinement of barrel-like clusters, and an affect of SSRI exposure on synapse formation. Behavioral effects related to decreases in the SERT have been documented by Ansorge et al. (2004). These authors have found that pharmacologic and genetic manipulation of SERT levels are associated with adult emotional dysfunction, in particular with increased anxiety and a maladaptive stress response. The investigators suggested, that there is an enhanced sensitivity to pharmacological inhibition in mice with a genetically reduced complement of 5-HTT. Thus, our current findings lead us to believe that 1) higher doses of CTM would exacerbate abnormalities associated with blockade of the SERT as compared to lower doses; while 2) lower doses of CTM (or a less specific/mixed antidepressant) could potentially minimize abnormalities to the point that they become insignificant.
In addition to the reduced density of SERT-ir fibers that was observed following neonatal CTM treatment, there was a prevalence of thick SERT-positive fibers that was detected. These large caliber, more intensely fluorescent profiles somewhat resemble serotonergic fibers that reportedly originate from median raphe neurons. The similarity resides in the fact that type “M” fibers possess intensely fluorescent varicosities and innervate the hippocampus; the dentate gyrus in particular (Kosofsky and Molliver, 1987; Molliver, 1987). Studies have indicated that this population of axons is resistant to the neurotoxic effects of amphetamine derivatives, unlike fibers projecting from the DR, “D” type (Mamounas and Molliver, 1988). We believe that the thick fiber population described in the current report represents a distinct group of axons; different from the “D” or “M” type fiber morphologies described previously in control situations. The main basis for our conclusion rests on the fact that thick fibers in the current study, were noticeably increased with higher doses of CTM and were rarely noted in control animals. In the amphetamine-related studies, the density of “M type” fibers was similar between control and treated rats (over a wide range of doses). However, dramatic losses in “D type” fibers were observed. A second difference between the thick fibers reported in this study and those characterized earlier relates to morphology. “M” type axons exhibit large, spherical varicosities with extremely fine intervaricose segments, while “D” type profiles demonstrate small, pleomorphic varicosities. The intervaricose segments of this latter category have been found to subtly transition into varicose swellings, as opposed to showing an abrupt change in fiber diameter. The thick caliber, intensely fluorescent fiber described in the current report is for the most part smooth, lacking evidence of synaptic enlargements. It is not known at the present time, if these hippocampal (and neocortical) fibers are undergoing a degenerating process, or whether they constitute a population of fibers that has not matured properly. Since they are reminiscent of preterminal axons of passage, this fiber type could represent serotonergic fibers that are spared from treatment (i.e. treatment selectively effecting axon terminals), or fibers that have become stunted by treatment (i.e. treatment interfering with axon arborization and synapse formation). Nonetheless, it is worthwhile to point out the major differences between the current and former studies. First, the thick, fluorescent fibers of the current report were characterized using SERT immunofluorescence. “D” and “M” type fibers were described following experiments that utilized 5-HT immunohistochemistry and PHA-L anterograde tracer methodology. Since, SERT is expressed exclusively on serotonergic fibers of the raphe after postnatal day 22, it is unlikely that the fluorescent projections of the current investigation are derived from any source other than the ascending raphe system. Indeed, the lack of barrel-patterning in SERT stained sections of somatosensory cortex (data not shown) confirms the lack of residual SERT expression in additional adult fiber systems (i.e. thalamocortical fibers) after treatment with postnatal CTM. Second, our thick, fluorescent fibers are only detectable after rats are treated after birth with CTM. They, unlike purported “M” type fibers, have not been observed after adult amphetamine treatment, nor have they been observed in adult control subjects.
Functional significance and clinical implications
As with any animal study caution is warranted when extrapolating findings to the human condition. Reports have related the rodent administration of CTM at PN8-21 to the exposure of a human child within the third trimester through early childhood (Ansorge et al., 2004; Clancy et al., 2001; Bayer et al., 1993). Considering the findings of the present study, it would appear that exposure to SSRIs during pregnancy could have detrimental effects on the development and future regulation of at least one major monoamine system in the brain of the fetus, the serotonin system.
Unfortunately, most clinical studies that have examined the effects of SSRIs on the fetus have evaluated the safety of the drug in terms of increased occurrences of major congenital anomalies. This practice offers a false sense of reassurance in the safety of antidepressant use during pregnancy, given that no major gross anomalies have been directly linked to SSRI use during pregnancy (Pastuszak et al., 1993). However, very recent studies have begun to call into question the use of antidepressants during pregnancy. One investigation has suggested that there is an association between the use of antidepressants during pregnancy and persistent pulmonary hypertension (Chambers et al., 2006). There is also evidence linking such treatment to cardiac abnormalities (i.e. septal wall defects) in the newborn (Federal Drug Administration, 2005). Nevertheless, SSRIs are still preferred over tricyclic antidepressants and benzodiazepines due to their efficacy, their lack of known adverse effects, and their safety with respect to overdose (American Academy of Pediatrics Committee on Drugs, 2000).
In agreement with the current study, available clinical literature does indicate that fetal SSRI exposure is neurobiologically relevant. Chambers et al. (1996) reported an increased risk of complications when the fetus is exposed to fluoxetine during the third trimester. Specifically, it was documented that nearly one third of the infants exposed to the drug in utero had poor neonatal adaptation, including respiratory difficulties, cyanosis on feeding and jitteriness. Moreover, Zeskind and Stephens (2004) reported that prenatal SSRI exposure was associated with disruptions in a wide range of neurobehavioral outcomes in the first 48 hours after birth, as assessed by systemic measures of behavioral state, sleep organization, motor activity, heart rate variability, tremulousness, and startles. Newborns exposed to SSRIs in utero were also found to have lower APGAR scores both at 1 and 5 minutes (Casper et al., 2003). Lastly, these authors also reported that prenatal SSRI exposure was associated with subtle deficits in motor development and control in children ages 6 to 40 months as assessed by Bayley Scores of Infant Development (2nd ed.).
Interestingly, CTM has been shown to be effective in the treatment of depression over a wide range of doses (20–60mg/day), and doses higher than this show little added benefit (as assessed by the Hamilton Depression Scale, Clinical Global Impression Scale and Zung Self-rating scale)(Mendels et al., 1990). Moreover, CTM at a dose of 20mg/day already translates into an occupancy of 77% of serotonin transporters as evidenced by [11C]{N, N-dimethyl-2-(2-amino-4-cyanophenylthio)benzylamine (DASB) and positron emission tomography studies in humans (Meyer et al., 2001). Meyer et al. (2001) also demonstrated via the use of paroxetine that an 85% occupancy of the SERT is reached when serum blood concentrations are as low as 28ug/liter, and that considerable increases in serum levels are needed to obtain a greater occupancy (i.e. a hyperbolic relationship). Given these findings, the authors speculate that doses of SSRI in excess of 20mg/kg are unlikely to have much of an added effect on the SERT.
Furthermore, it is important to point out the following - the higher doses used in the current investigation (CTM10-CTM20) resulted in serum concentrations that were comparable (within an order of magnitude) to typical serum concentrations observed after chronic administration of clinically active doses (Maciag et al., 2006). For example, our measures approximated those obtained by Bjerkenstedt et al., 1985, who treated patients with 17–34mg/day CTM. Therefore, the current study indicates that significant neuroanatomical/neurochemical abnormalities can afflict the offspring of pregnant women who are taking SSRI antidepressants at doses that are considered to be on the low end of the therapeutic range in humans.
In summary, our demonstration that neonatal exposure to the SSRI, CTM, selectively impacts the cortical, but not the subcortical raphe projection, provides further evidence in support of heterogeneity within the raphe complex, and helps to better define differences in raphe neuronal responsiveness during early brain development. Our present findings raise a red flag concerning the risks associated with SSRI use during pregnancy. On a positive note, it would appear that lower doses of CTM (CTM5) interfere minimally with regulatory processes in raphe-cortex connections. Providing that this dose is clinically effective, one option may be to prescribe SSRIs in lower doses. Obviously, this is one question that needs to be further investigated. In the meantime, physicians may want to utilize other means for managing psychiatric illness in expectant mothers until further research reveals the biological mechanisms influenced by neonatal SSRI exposure.
Acknowledgments
This research was supported by NIH grants RR017701 (KLS and IAP), and EUREKA MH084194 (RCSL). We would like to thank Ms. S. Swilley for her technical support
Literature Cited
- Ansorge MS, Zhou M, Lira A, Hen R, Gingrich JA. Early-life blockade of the 5-HT transporter alters emotional behavior in adult mice. Science. 2004;306:879–881. doi: 10.1126/science.1101678. [DOI] [PubMed] [Google Scholar]
- American Academy of Pediatrics Committee on Drugs. Use of psychoactive medication during pregnancy and possible effects on the fetus and newborn. Pediatrics. 2000;105:880–887. doi: 10.1542/peds.105.4.880. [DOI] [PubMed] [Google Scholar]
- Azmitia EC. Modern views on an ancient chemical: Serotonin effects on cell proliferation, maturation, and apoptosis. Brain Res Bull. 2001;56:413–424. doi: 10.1016/s0361-9230(01)00614-1. [DOI] [PubMed] [Google Scholar]
- Bayer SA, Altman J, Russo RJ, Zhang X. Timetables of neurogenesis in the human brain based on experimentally determined patterns in the rat. Neurotoxicology. 1993;14:83–144. [PubMed] [Google Scholar]
- Bennett-Clarke CA, Chiaia NL, Rhoades RW. Thalamocortical afferents in rat transiently express high-affinity serotonin uptake sites. Brain Res. 1996;733:301–306. doi: 10.1016/0006-8993(96)00791-3. [DOI] [PubMed] [Google Scholar]
- Bjerkenstedt L, Flyckt L, Overo KF, Lingjaerde O. Relationship between clinical effects, serum drug concentration and serotonin uptake inhibition in depressed patients treated with citalopram. A double-blind comparison of three dose levels. Eur J of Clin Pharmacol. 1985;28:553–557. doi: 10.1007/BF00544066. [DOI] [PubMed] [Google Scholar]
- Cases O, Vitalis T, Seif I, De Maeyer E, Sotelo C, Gaspar P. Lack of barrels in the somatosensory cortex of monoamine oxidase A-deficient mice: a role of a serotonin excess during the critical period. Neuron. 1996;16:297–307. doi: 10.1016/s0896-6273(00)80048-3. [DOI] [PubMed] [Google Scholar]
- Casper RC, Fleisher BE, Lee-Ancajas JC, Gilles A, Gaylor E, DeBattista A. Follow-up of children of depressed mothers exposed or not to antidepressant drugs during pregnancy. J Pediatr. 2003;142:402–408. doi: 10.1067/mpd.2003.139. [DOI] [PubMed] [Google Scholar]
- Chambers CD, Johnson KA, Dick LM, Felix RJ, Jones KL. Birth outcomes in pregnant women taking fluoxetine. New Engl J Med. 1996;335:1010–1015. doi: 10.1056/NEJM199610033351402. [DOI] [PubMed] [Google Scholar]
- Chambers CD, Hernandez-Diaz S, Van Marter LJ, Werler MM, Louik C, Jones KL, Mitchell AA. Selective serotonin reuptake inhibitors and risk of persistant pulmonary hypertension of the newborn. New Engl J Med. 2006;354:579–587. doi: 10.1056/NEJMoa052744. [DOI] [PubMed] [Google Scholar]
- Clancy B, Darlington RB, Finlay BL. Translating developmental time across mammalian species. Neuroscience. 2001;105:7–17. doi: 10.1016/s0306-4522(01)00171-3. [DOI] [PubMed] [Google Scholar]
- Cohen LS, Nonacs R, Viguera AC, Reminick A. Diagnosis and treatment of depression during pregnancy. CNS Spectra. 2004;9:209–16. doi: 10.1017/s1092852900009007. [DOI] [PubMed] [Google Scholar]
- D’Amato RI, Blue ME, Largent BL, Lynch DR, Ledbetter DJ, Molliver ME, Synder SH. Ontogeny of the serotonergic projection to rat neocortex: transient expression of a dense innervation to primary sensory areas. Proc Natl Acad Sci USA. 1987;84:4322–4326. doi: 10.1073/pnas.84.12.4322. [DOI] [PMC free article] [PubMed] [Google Scholar]
- Dreyer J, Schleicher M, Tappe A, Schilling K, Kuner T, Kusumawidijaja G, Muller-Esterl W, Oess S, Kuner R. Nitric oxide synthase (NOS)-interacting protein interacts with neuronal NOS and regulates its distribution and activity. J Neurosci. 2004;24:10454–10465. doi: 10.1523/JNEUROSCI.2265-04.2004. [DOI] [PMC free article] [PubMed] [Google Scholar]
- Esaki T, Cook M, Shimoji K, Murphy DL, Sokoloff L, Holmes A. Developmental disruption of serotonin tranporter function impairs cerebral responses to whisker stimulation in mice. Proc Natl Acad Sci USA. 2005;102:5582–5587. doi: 10.1073/pnas.0501509102. [DOI] [PMC free article] [PubMed] [Google Scholar]
- Federal Drug Administration. Adverse risk of birth defects with Paxil. 2005 http://www.fda.gov/bbs/topics/NEWS/2005/NEW01270.html.
- Gaspar P, Cases O, Maroteaux L. The developmental roles of serotonin: news from mouse molecular genentics. Nature Reviews Neuorosci. 2003;4:1002–1012. doi: 10.1038/nrn1256. [DOI] [PubMed] [Google Scholar]
- Hansen HH, Sanchez C, Meier E. Neonatal administration of the selective serotonin reuptake inhibitor Lu 10–134-C increases forced swimming-induced immobility in adult rats: a putative animal model of depression? J Pharmacol Exp Ther. 1997;283:1333–1341. [PubMed] [Google Scholar]
- Hendrick V, Stowe ZN, Altshuler LL, Hwang S, Lee E, Haynes D. Placental passage of antidepressant medications. Am J Psychiatry. 2003;160:993–996. doi: 10.1176/appi.ajp.160.5.993. [DOI] [PubMed] [Google Scholar]
- Holmes A, Murphy DL, Crawley JN. Abnormal behavioral phenotypes of serotonin transporter knockout mice: parallels with human anxiety and depression. Biol Psychiatry. 2003;54:953–959. doi: 10.1016/j.biopsych.2003.09.003. [DOI] [PubMed] [Google Scholar]
- Hostetter A, Ritchie JC, Stowe ZN. Amniotic fluid and umbilical cord blood concentrations of antidepressants in three women. Biol Psychiatry. 2000;48:1032–1034. doi: 10.1016/s0006-3223(00)00958-6. [DOI] [PubMed] [Google Scholar]
- Imai H, Steindler DA, Kitai ST. The organization of divergent axonal projections from the midbrain raphe nuclei in the rat. J Comp Neurol. 1986;243:363–380. doi: 10.1002/cne.902430307. [DOI] [PubMed] [Google Scholar]
- Jaffar S, Counts SE, Ma SY, Dadko E, Gordon MN, Morgan D, Mufson EJ. Neuropathology of mice carrying mutant APPswe and/or PS1M146L transgenes: alterations in the p75NTR cholinergic basal forebrain septohippocampal pathway. Exp Neurol. 2001;171:227–243. doi: 10.1006/exnr.2001.7710. [DOI] [PubMed] [Google Scholar]
- Kirifides ML, Simpson KL, Lin RCS, Waterhouse BD. Topographic organization and neurochemical identity of dorsal raphe neurons that project to the trigeminal somatosensory pathway in the rat. J Comp Neurol. 2001;435:325–340. doi: 10.1002/cne.1033. [DOI] [PubMed] [Google Scholar]
- Kosofsky BE, Molliver ME. The serotonergic innervation of cerebral cortex: different classes of axon terminals arise from dorsal and median raphe nuclei. Synapse. 1987;1:153–168. doi: 10.1002/syn.890010204. [DOI] [PubMed] [Google Scholar]
- Lauder JM. Ontogeny of the serotonergic system in the rat: serotonin as a developmental signal. Ann N Y Acad Sci. 1990;600:297–313. doi: 10.1111/j.1749-6632.1990.tb16891.x. [DOI] [PubMed] [Google Scholar]
- LeBrand C, Cases O, Wehrle R, Blakely RD, Edwards RH, Gaspar P. Transient Developmental Expression of Monoamine Transporters in the Rodent Forebrain. J Comp Neurol. 1998;401:506–524. [PubMed] [Google Scholar]
- Lu Y, Weaver KJ, Lin RCS, Simpson KL. Regionally specific co-expression of serotonin and nitric oxide in the rat raphe complex: comparisions between cortically-projecting and descending subgroups. Soc Neurosci Abst. 2007:780.14. [Google Scholar]
- Maciag D, Simpson KL, Coppinger D, Lu Y, Wang Y, Lin RCS, Paul IA. Neonatal Antidepressant Exposure has lasting effects on Behavior and Serotonin Circuitry. Neuropsychopharmacology. 2006;31:47–57. doi: 10.1038/sj.npp.1300823. [DOI] [PMC free article] [PubMed] [Google Scholar]
- Mamounas LA, Molliver ME. Evidence for dual serotonergic projections to neocortex: Axons from the dorsal and median raphe nuclei are differentially vulnerable to the neurotoxin p-chloroamphetamine (PCA) Exp Neurol. 1988;102:23–36. doi: 10.1016/0014-4886(88)90075-1. [DOI] [PubMed] [Google Scholar]
- Mendels J, Fabre L, Kiev A. A double-blind placebo controlled study of citalopram in major depressive disorder. Presented at the 30th annual meeting of the New Clinical Drug Evaluation Unit; Florida. May 29-June 1, 1990.1990. [Google Scholar]
- Meyer JH, Wilson AA, Ginovart N, Goulding V, Hussey D, Hood K, Houle S. Occupancy of serotonin transporters by paroxetine and citalopram during treatment of depression: A [11C]DASB PET Imaging Study. Am J Psychiatry. 2001;158:1843–1849. doi: 10.1176/appi.ajp.158.11.1843. [DOI] [PubMed] [Google Scholar]
- Mirmiran M, van de Poll NE, Corner MA, van Oyen HG, Bour HL. Suppression of active sleep by chronic treatment with chlorimipramine during early postnatal development: effects upon adult sleep and behavior in the rat. Brain Res. 1981;204:129–146. doi: 10.1016/0006-8993(81)90657-0. [DOI] [PubMed] [Google Scholar]
- Molliver ME. Serotonergic neuronal systems: what the anatomic organization tells us about function. J Clin Psychopharmacol. 1987;7:3–23. [PubMed] [Google Scholar]
- Pastuszak A, Schick-Boschetto B, Zuber C, Feldkamp M, Pinelli M, Sihn S, Donnenfeld A, McCormack M, Leen-Mitchel M, Woodland C, Gardner G, Horn M, Koren G. Pregnancy outcome following first-trimester exposure to fluoxetine (Prozac) JAMA. 1993;335:2246–2248. [PubMed] [Google Scholar]
- Persico AM, Mengual E, Moessner R, Hall SF, Revay RS, Sora I, Arellano J, DeFelipe J, Gimenez-Amaya JM, Conciatori M, Marino R, Baldi A, Cabib S, Pascucci T, Uhl GR, Murphy DL, Lesch KP, Keller F. Barrel pattern formation requires serotonin uptake by thalamocortical afferents, and not vesicular monoamine release. J Neurosci. 2001;21:6862–6873. doi: 10.1523/JNEUROSCI.21-17-06862.2001. [DOI] [PMC free article] [PubMed] [Google Scholar]
- Sanz EJ, De-las-Cuevas C, Kiuru A, Bate A, Edwards R. Selective serotonin reuptake inhibitors in pregnant women and neonatal withdrawal syndrome: a database analysis. Lancet. 2005;365:482–487. doi: 10.1016/S0140-6736(05)17865-9. [DOI] [PubMed] [Google Scholar]
- Simpson KL, Waterhouse BD, Lin RCS. Differential expression of nitric oxide in serotonergic projection neurons: neurochemical identification of dorsal raphe inputs to rodent trigeminal somatosensory targets. J Comp Neurol. 2003;466:495–512. doi: 10.1002/cne.10912. [DOI] [PubMed] [Google Scholar]
- Vertes RP. A PHA-L analysis of ascending projections of the dorsal raphe nucleus in the rat. J Comp Neurol. 1991;313:643–668. doi: 10.1002/cne.903130409. [DOI] [PubMed] [Google Scholar]
- Vertes RP. Projections of the medial raphe nucleus in the rat. J Comp Neurol. 1999;407:555–582. [PubMed] [Google Scholar]
- Wang Q-P, Guan JL, Nakai Y. Distribution and synaptic relations of NOS neurons in the dorsal raphe nucleus: a comparison to 5-HT neurons. Brain Res Bull. 1995;37:177–187. doi: 10.1016/0361-9230(94)00277-8. [DOI] [PubMed] [Google Scholar]
- Waterhouse BD, Mihailoff GS, Baack JC, Woodward DJ. Topographical distribution of dorsal and median raphe neurons projecting to motor, sensorimotor and visual cortical areas in the rat. J Comp Neurol. 1986;249:460–481. doi: 10.1002/cne.902490403. [DOI] [PubMed] [Google Scholar]
- Wisner KL, Zarin DA, Holmboe ES, Appelbaum PS, Gelenberg AJ, Leonard HL. Risk-benefit decision making for treatment of depression during pregnancy. Am J Psychiatry. 2000;157:1933–1940. doi: 10.1176/appi.ajp.157.12.1933. [DOI] [PubMed] [Google Scholar]
- Xu Y, Sari Y, Zhou FC. Selective serotonin reuptake inhibitor disrupts organization of thalamocortical somatosensory barrels during development. Dev Brain Res. 2004;150:151–161. doi: 10.1016/j.devbrainres.2003.02.001. [DOI] [PubMed] [Google Scholar]
- Zeskind PS, Stephens LE. Maternal selective serotonin reuptake inhibitor use during pregnancy and newborn neurobehavior. Pediatrics. 2004;113:368–375. doi: 10.1542/peds.113.2.368. [DOI] [PubMed] [Google Scholar]
- Zerbinatti CV, Wahrle SE, Kim H, Cam JA, Bales K, Paul SM, Holtzman DM, Bu G. Apolipoprotein E and low density lipoprotein receptor-related protein facilitate itraneuronal Aβ42 accumulation in amyloid model mice. J Biol Chem. 2006;281:36180–36186. doi: 10.1074/jbc.M604436200. [DOI] [PubMed] [Google Scholar]