Abstract
Distinguishing and separating isotopic molecular variants is important across many scientific fields. However, discerning such variants, especially those producing no net mass difference, has been challenging. For example, single-stage mass spectrometry is broadly employed to analyze isotopes, but is blind to isotopic isomers (isotopomers) and, except at very high resolution, species of same nominal mass (isobars). Here, we report separation of isotopic ions, including isotopomers and isobars, using ion mobility spectrometry (IMS), namely the field asymmetric waveform IMS (FAIMS). The effect is not based on the different reduced masses of ion-gas molecule pairs previously theorized to cause isotopic separations in conventional IMS, but appears related to the details of energetic ion-molecule collisions in strong electric fields. The observed separation qualitatively depends on the gas composition and may be improved using gas mixtures. Isotopic shifts depend on the position of labeled site, which allows its localization and contains information about the ion geometry, potentially enabling a new approach to molecular structure characterization.
Since early 1900-s, when vacuum techniques and ion detectors first enabled investigations of gas-phase ions, two approaches to their separation and characterization have emerged - mass spectrometry (MS) and ion mobility spectrometry (IMS).1,2 Though both exploit the motion of charged species in electric field, MS is performed in vacuum and is thus based only on the ion mass/charge (m/q) ratio while IMS involves buffer gases and relies on ion transport properties. The first major discovery enabled by MS was the existence of isotopes by Thomson and Aston,3 and isotopic analyses have since been integral to MS. In particular, the preparative separation of U isotopes using Lawrence’s Calutron was the first industrial MS application,4 and isotopic labeling is intrinsic to MS quantification methods. The issue of isotopes was largely ignored in IMS as the resolving power (R) was generally too low for their separation.
A theory for isotopic separations in conventional IMS, where absolute ion mobility (K) is measured at relatively low electric field intensities (E), has been presented by Valentine and Clemmer.5 Postulating that isotopic variations do not affect the ion-molecule collision cross sections (Ω) significantly, they suggest that isotopic shifts in mobility would primarily reflect the difference in reduced mass in the Mason-Schamp equation:5
| (1) |
where T and N are the gas temperature and number density, and M is the gas molecule mass. Thus lighter isotopes have higher mobilities, and the relative mobility shift between an ion L with the mass m and its heavier isotope H with the mass (m + Δm) is:5
| (2) |
One typically has Δm << m , and eq (2) may be condensed to:
| (3) |
Usually ions are (much) heavier than the buffer gas molecules and the shift by eq (3) is (much) smaller than the relative mass difference. For example, the mobilities of isotopes weighing 100 and 101 Da would differ by 0.1 % in nitrogen and 0.02 % in helium commonly used in IMS, and their resolution would require R of ~1000 and ~5000, respectively (based on the peak width at half-maximum).5 For heavy ions where m >> M, eq (3) further reduces to
| (4) |
Hence the IMS resolving power needed scales with the ion mass squared. As conventional IMS is currently limited6-8 to R ~ 200, the absence of reports or interest in isotope separation by IMS is not surprising. The recently developed cyclotron IMS9 potentially allows a dramatic increase of R to ~103 and higher, but the real separation power of such devices remains to be shown.
Molecular species can have isotopomers with same labeled atom(s) in different locations, e.g., NH2CH2 13CO2H vs. NH2 13CH2CO2H glycines. Such ions have equal masses and, by eq (2), mobilities. There also are “pseudoisotopomers” with identical nominal mass but differing isotopic content and slight mass difference due to unequal atomic mass defects, e.g. NH2CH2 13CO2H (76.035 Da) and 15NH2CH2CO2H (76.029 Da). Such ions can be distinguished10 by high-resolution Fourier-transform MS, but separation by conventional IMS would, according to eq (3), require unrealistic R.
Another IMS approach, the differential or field asymmetric waveform IMS (FAIMS), is based on mobility differences in weak and strong electric fields.11 In practice, ions are filtered in a gap between two electrodes carrying an asymmetric high-voltage waveform (with the peak amplitude called “dispersion voltage”, DV) plus weak fixed “compensation voltage” (CV). Only some species pass the gap at a given CV, and scanning CV produces the spectrum of species present. This method has separated mixtures, including isomers and isobars, and often resolves species undistinguishable by conventional IMS.11-16 A single report of isotopic separation had appeared17 for atomic ions: 35Cl− and 37Cl− that differ in mass by 6%. That work involved a FAIMS unit of cylindrical shape and hence inherently modest14 R of ~10.
Here, we demonstrate that the recently developed high-resolution FAIMS15,16 can separate isotopes with a much smaller mass difference of ~1%, and, most importantly, isobars with different isotopic content and isotopomers. This capability may enable a new method for isotope separation in a small-scale format at ambient pressure and aid localization of labeled sites in molecules. As the observed isotopic shifts depend on the label position, they potentially provide detailed structural information not obtainable for gas-phase ions using conventional IMS or MS.
We employed a planar FAIMS device with R ~ 100, coupled to an ion trap MS. We used the peak waveform amplitude of 4.0 or 5.4 kV and the N2, He/N2, or He/CO2 mixtures for the gas with the He fraction limited to ~70% at 4 kV and ~40% at 5.4 kV (to avoid electrical breakdown in the gap).14-16 To maintain a level ion flux past FAIMS at higher He content, the separation time was reduced from ~200 to ~50 ms by increasing the flow rate from 2 to ~8 L/min. We studied ~1:1 pairwise mixtures of normal glycines or alanines and their isotopically pure analogs: NH2CH2 13CO2H (C1 labeled), NH2 13CH2CO2H (C2 labeled), NH2 13CH2 13CO2H, 15NH2CH2CO2H, and NH2CD2CO2H glycines, and NH2CH2CH2 13CO2H (C1 labeled) and NH2 13CH2CH2CO2H (C3 labeled) alanines (Sigma Aldrich, the label numbers counted from the carboxylic end). Ions were generated by electrospray ionization (ESI), where amino acids yield protonated 1+ ions that produce a single feature in the FAIMS spectrum. Samples were dissolved in 50:49:1 water/methanol/acetic acid and infused to the ESI source at ~0.5 μL/min.
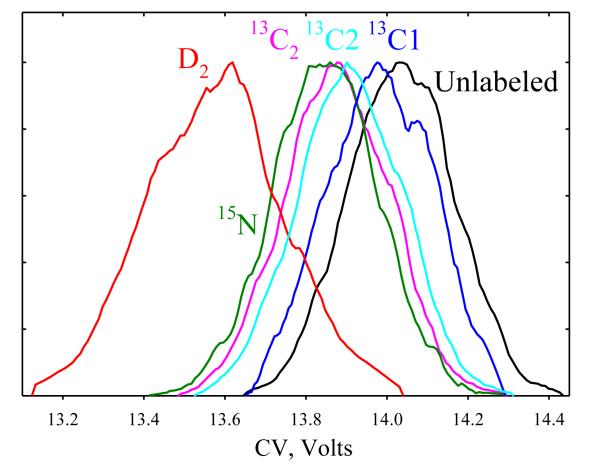
First, we set DV to 4 kV. With N2 gas (Fig. 1), the peak for glycine (m/z = 76) has CV = 14 V, the width of 0.3 V, and thus R ~ 45, which is far too low to separate isotopes based on the reduced mass effect by eq (2). In fact, all labeled glycines (m/z = 77 and 78) have notably lower CVs (Fig. 1) and shifts not controlled by the mass difference: the 13C2 peak (m/z = 78) lies close to and between those for 15N and 13C2 (m/z = 77), while the D2 peak (m/z = 78) has a much lower CV. The physics of this separation clearly differs from that considered in Ref. [5] and isobars, e.g., 13C2- and D2- glycines, can be distinguished.
Fig. 1.
Composite FAIMS spectra for labeled glycines at DV = 4 kV in N2, relative to the normal glycine.
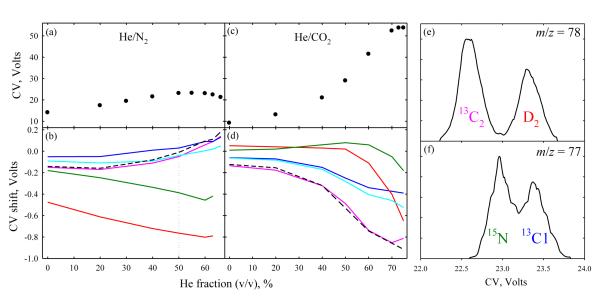
The shifts in Fig. 1 allow only limited separation. The FAIMS resolution can be enhanced using gas mixtures where non-Blanc phenomena (deviations from the Blanc’s law for mobility and diffusion in gas mixtures that occur at high E) expand the separation space,18 especially He/N2 with 50 - 75% He.15,16 Upon He addition, the CVs of small ions first increase and then decrease and cross to negative values.15,18 This applies to isotopic glycines, with CVs maximizing at 22 - 23 V at ~55% He and decreasing to 20 - 21 V at 66% He (Fig. 2a). The covered CV range expands roughly in proportion, from 0.5 V in N2 to 0.9 V at 60% He (Fig. 2b). For 15N- and D2- glycines, the CV shifts vs. the normal one nearly double at ~60% He, varying little in relative terms. The peak widths change little because the flow is adjusted for constant sensitivity (see Methods), and the resolution scales approximately with the CV shifts between relevant features. The order of peaks is retained, except all 13C labeled and the normal glycine switch at ~40 - 60% He and 13C2 and 13C2 switch at ~50% He. These results confirm that the separation is not due to the reduced mass difference, which decreases at higher He fractions and never changes sign.
Fig. 2.
Separation properties for the glycines in Fig. 1, depending on the He/N2 (a, b) and He/CO2 (c, d) mixture composition: (a, c) CV for normal glycine; (b, d) CV shifts for labeled glycines from the values for normal analog; (e, f) separation of the 13C2/D2 and 15N/13C1 glycine ion pairs in 1:1 He/N2 (dotted line in b). The dashed line in (b, d) is the sum of shifts for the 13C1 and 13C2 glycines.
The FAIMS separations in CO2 and He/CO2 mixtures19 differ from those in N2 or He/N2. As He and CO2 diverge in terms of mass, size, or polarizability more than He and N2, the non-Blanc behavior would be stronger18 in He/CO2 than in He/N2. Indeed, the maximum CV of 54 V (at ~75% He) is ~2.3 times that in He/N2 mixtures, and 6 times that at 0% He (Fig. 2c). The CV range for isotopic glycines also expands drastically with He addition, but from a lower base than in N2 and never exceeds 0.9 V reached in He/N2 (Fig. 2d). The peak order strikingly differs from that with He/N2: the 15N- and D2- glycines now have the highest CVs up to ~50% He. Their relative CVs rapidly drop above ~50% He, but, up to the maximum 75% He, the CV for 15N-glycine exceeds that for all 13C labeled ones and that for D2- exceeds that for 13C2-glycine. At low He %, the 15N and D2 peaks are inverted compared to the He/N2 case. The drop of CVs for 15N- and D2- glycines relative to the normal one at high He fractions is expected as the data in He/N2 and He/CO2 must converge in the high-He limit, yet the shifts for the 13C labeled species exhibit no clear upturn up to 75% He. Tailoring the gas composition may help resolving specific targets, even in a narrower separation space. For example, the 13C2- and 13C1- glycines separate by >0.5 V in 7:3 He/CO2 vs. <0.15 V in He/N2 mixtures. Therefore, again, the separation is not derived from the reduced mass difference, the sign of which is independent of the gas.
In any He/N2 or He/CO2 composition, the sum of shifts for 13C1- and 13C2- glycines (relative to the normal one) approximates that for the 13C2-glycine (Fig. 2 b, d). Whether the isotopic CV shifts are additive in general, allowing the prediction upon multiple labeling from the values for individual labels, remains to be determined.
By Fig. 2, all pseudoisotopomer pairs (15N/13C1, 15N/13C2, and 13C2/D2) are best separated in ~3:2 He/N2, with CV shifts of ~0.5 V or more resulting in clear peak partitioning. The peak width variation maximizes the resolution at ~50% He, with the separation at baseline for 13C2/D2 and half-height for 15N/13C1 (Fig. 2 e, f). For the 13C1 and 13C2 isotopomers, the greatest shift is 0.1 V or 1/3 of the peak width, precluding observable peak separation.
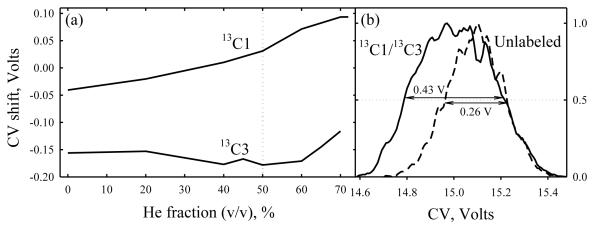
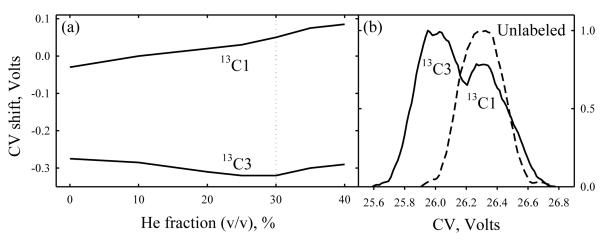
Isotopomers may be easier to separate when the labeled atoms are not adjacent as in 13C1 and 13C2 glycines, but spread apart such as carbons 1 and 3 in alanine. Indeed, the CV shifts for 13C1- and 13C3- alanines relative to the normal analog and each other (Fig. 3a) have the same sign and dependence on He/N2 ratio as those for 13C1- and 13C2- glycines (Fig. 2 b). Although the maximum CV drops to 15 V, the greatest CV difference between the isotopomers increases to 0.24 V (here at ~60% He). This is close to the peak width, which clearly broadens the feature for the mixture (Fig. 3b).
Fig. 3.
Separation of isotopomers: (a) CV shifts for 13C1 and 13C3 alanine from the values for normal analog, depending on the He/N2 composition at DV = 4 kV and (b) broadening of the peak (m/z = 91) relative to that for normal analog (m/z = 90) in the 13C1/13C3/normal alanine mixture analyzed at 50% He.
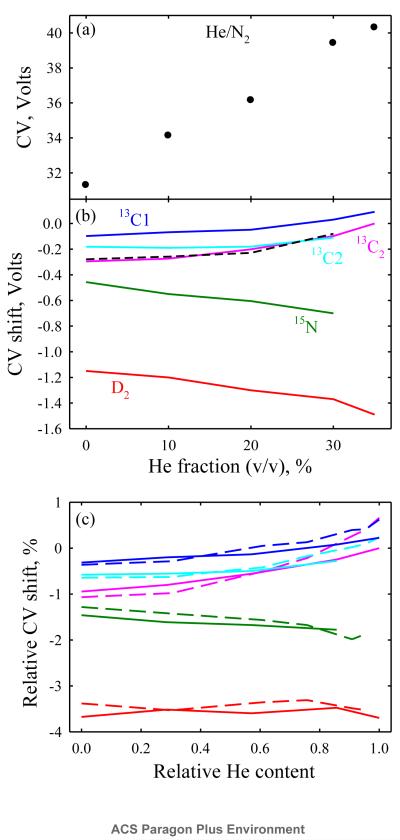
The FAIMS resolving power improves at higher DV, but the electrical breakdown constraint reduces the maximum He content with opposite effect.11,16 At DV = 5.4 kV (the limit of existing waveform generators), the highest He fraction was ~50% and the resolution for amino acids and peptides at best slightly exceeded that at DV = 4 kV.16 Raising the DV from 4 to 5.4 kV in same gas about doubles the CVs for normal glycine to 31 V in N2 and 40 V at 35% He (Fig. 4a). The isotopic shifts also nearly double, reaching 1.5 V with the CV range expanding to 1.6 V (Fig. 4b). However, the relative shifts and thus the peak order are retained (Fig. 4c), and the shifts for 13C1- and 13C2- glycines again add to that for the 13C2- one (Fig. 4b). The same peak order was likewise observed for amino acids or peptides at DV of 4 and 5.4 kV with the maximum He content for each.16 The peak widths in planar FAIMS units scale11 approximately with K−1/2. Hence, with other conditions equal, peaks are broader at the DV of 5.4 kV than 4 kV where ions are more mobile because of higher He content, and the resolving powers at 4 and 5.4 kV are close despite very different CVs.16 Here the separation time is adjusted for level ion signal and the peak widths at 5.4 kV are the same ~0.3 V. This results in a much better resolution at the greater DV.
Fig. 4.
Panels (a, b) replicate Fig. 2 (a, b) at DV = 5.4 kV, (c) shows the CV shifts as a percentage of CV for normal glycine at DV = 5.4 kV (solid lines) and 4 kV (dashed lines). The horizontal axis in (c) is in terms of the fraction of maximum He content at each DV (assumed 66% for 4 kV and 35% for 5.4 kV).
Alanine ions follow the same trend: raising DV to 5.4 kV does not affect the peak order or qualitative dependence of the CV shifts on He content, but increases the maximum CV to 27 V and the greatest CV difference between 13C1 and 13C3 isotopomers to 0.37 V (at ~30 - 40% He), Fig. 5a. This permits a conclusive though still partial separation of these species (Fig. 5b). Further resolution gain by ~1.5 - 2 times, which should be achievable using more effective rectangular waveforms,11,20 would allow full separation of these isotopomers.
Fig. 5.
Same as Fig. 3 at DV = 5.4 kV, (b) is at 30% He.
The physics behind the present isotopic effects and resulting separations remains unclear, but is not based on the variation of reduced mass of ion-gas molecule pair theorized to cause separation of non-isobaric isotopic ions in low-field IMS.5 Isotopic substitutions also affect the ion geometry (particularly bond lengths) and thus the mobility. The greatest mass ratio for any isotopes (two) is for D and H, and deuteration has the maximum isotopic effect on molecular geometries.21,22 The observation of largest isotopic shift in He/N2 mixtures for D2-glycine (Fig. 2 b) is consistent with this mechanism, but an unremarkable shift for this species in He/CO2 combinations (Fig. 2 d) tells that the geometry change is not decisive in at least some cases. Another factor is the shift of ion center of mass, which may have a non-intuitively large impact on high-energy collision dynamics23 that underlies the high-field ion mobility in FAIMS. Experiments for a more extensive and diverse set of small molecules should clarify the trends of shifts as a function of the gas composition and the nature and position of isotopic substitution, from which a physical explanation for the effect would hopefully emerge.
The relative mass difference between the glycines examined here (76 vs. 77 Da or 77 vs. 78 Da) is the same 1.3% as that between 235U and 238U. The capability to separate such isotopes in a simple compact device at atmospheric pressure may be significant. The presence of isotopes in samples (natural or due to labeling) would notably broaden or split the FAIMS peaks, which would otherwise be ascribed to structural isomers. The ability to distinguish isotopomers may aid localization and deconvolution of labeled sites (e.g., in the H/D exchange context), simplify analyses involving isotopic labels and particularly multiple labels (such as used for metabolities in pharmaceutical studies), and enable quantification schemes for FAIMS using stable isotope labeling, in parallel to the MS methods. As the isotopic shifts are sensitive to the labeled atom position, they contain structural information and may provide insights into subtle features that are presently the domain of very different tools such as NMR or molecular spectroscopy, which require large amounts of pure sample and are not applicable to ions. In contrast, the ion mobility methods readily work for chemical traces in complex samples.
Acknowledgements
We thank Drs. Stephen Valentine, Keqi Tang, David Koppenaal, and David Atkinson for discussions. This research was supported by NIH NCRR (RR 18522). The work was performed in the Environmental Molecular Sciences Laboratory, a national scientific user facility at PNNL sponsored by DoE-BER.
References
- 1.Gross JH. Mass Spectrometry: a Textbook. Springer; 2004. [Google Scholar]
- 2.Eiceman GA, Karpas Z. Ion Mobility Spectrometry. CRC Press; Boca Raton, FL: 2004. [Google Scholar]
- 3.Thomson JJ. Proc. Roy. Soc. A. 1913;89:1–20. [Google Scholar]
- 4.Rhodes R. The Making of the Atomic Bomb. Simon & Schuster; NY: 1995. [Google Scholar]
- 5.Valentine SJ, Clemmer DE. Anal. Chem. 2009;81:5876–5880. doi: 10.1021/ac900255a. [DOI] [PMC free article] [PubMed] [Google Scholar]
- 6.Dugourd P, Hudgins RR, Clemmer DE, Jarrold MF. Rev. Sci. Instrum. 1997;68:1122–1129. [Google Scholar]
- 7.Srebalus CA, Li J, Marshall WS, Clemmer DE. Anal. Chem. 1999;71:3918–3927. doi: 10.1021/ac9903757. [DOI] [PubMed] [Google Scholar]
- 8.Asbury GR, Hill HH. J. Microcol. Sep. 2000;12:172–178. [Google Scholar]
- 9.Merenbloom SI, Glaskin RS, Henson ZB, Clemmer DE. Anal. Chem. 2009;81:1482–1487. doi: 10.1021/ac801880a. [DOI] [PMC free article] [PubMed] [Google Scholar]
- 10.He F, Hendrickson CL, Marshall AG. Anal. Chem. 2001;73:647–650. doi: 10.1021/ac000973h. [DOI] [PubMed] [Google Scholar]
- 11.Shvartsburg AA. Differential Ion Mobility Spectrometry: Nonlinear Ion Transport and Fundamentals of FAIMS. CRC Press; Boca Raton, FL: 2008. [Google Scholar]
- 12.Canterbury JD, Yi XH, Hoopmann MR, MacCoss M. J. Anal. Chem. 2008;80:6888–6897. doi: 10.1021/ac8004988. [DOI] [PMC free article] [PubMed] [Google Scholar]
- 13.Shvartsburg AA, Li F, Tang K, Smith RD. Anal. Chem. 2006;78:3304–3315. doi: 10.1021/ac060283z. [DOI] [PubMed] [Google Scholar]
- 14.Shvartsburg AA, Li F, Tang K, Smith RD. Anal. Chem. 2006;78:3706–3714. doi: 10.1021/ac052020v. [DOI] [PMC free article] [PubMed] [Google Scholar]
- 15.Shvartsburg AA, Danielson WF, Smith RD. Anal. Chem. 2010;82:2456–2462. doi: 10.1021/ac902852a. [DOI] [PMC free article] [PubMed] [Google Scholar]
- 16.Shvartsburg AA, Prior DC, Tang K, Smith RD. Anal. Chem. doi: 10.1021/ac101413k. DOI: 10.1021/ac101413k. [DOI] [PMC free article] [PubMed] [Google Scholar]
- 17.Barnett DA, Purves RW, Guevremont R. Nucl. Instrum. Meth. Phys. Res. A. 2000;450:179–185. [Google Scholar]
- 18.Shvartsburg AA, Tang K, Smith RD. Anal. Chem. 2004;76:7366–7374. doi: 10.1021/ac049299k. [DOI] [PubMed] [Google Scholar]
- 19.Cui M, Ding L, Mester Z. Anal. Chem. 2003;75:5847–5853. doi: 10.1021/ac0344182. [DOI] [PubMed] [Google Scholar]
- 20.Shvartsburg AA, Smith RD. J. Am. Soc. Mass Spectrom. 2008;19:1286–1295. doi: 10.1016/j.jasms.2008.05.008. [DOI] [PMC free article] [PubMed] [Google Scholar]
- 21.Robertson JM, Ubbelohde AR. Proc. R. Soc. A. 1939;170:222–240. [Google Scholar]
- 22.Cohen A, Limbach HH, editors. Isotope Effects in Chemistry and Biology. CRC Press; Boca Raton, FL: 2005. [Google Scholar]
- 23.Beck D, Ross U, Schepper U. Phys. Rev. A. 1979;19:2173–2179. [Google Scholar]


