

Abstract
Chronic infection and associated inflammation are key contributors to human carcinogenesis. Ulcerative colitis (UC) is an oxyradical overload disease and is characterized by free radical stress and colon cancer proneness. Here we examined tissues from noncancerous colons of ulcerative colitis patients to determine (a) the activity of two base excision–repair enzymes , AAG, the major 3-methyladenine DNA glycosylase, and APE1, the major apurinic site endonuclease; and (b) the prevalence of microsatellite instability (MSI). AAG and APE1 were significantly increased in UC colon epithelium undergoing elevated inflammation and MSI was positively correlated with their imbalanced enzymatic activities. These latter results were supported by mechanistic studies using yeast and human cell models in which overexpression of AAG and/or APE1 was associated with frameshift mutations and MSI. Our results are consistent with the hypothesis that the adaptive and imbalanced increase in AAG and APE1 is a novel mechanism contributing to MSI in patients with UC and may extend to chronic inflammatory or other diseases with MSI of unknown etiology.
Introduction
Ulcerative colitis (UC) is a chronic inflammatory disease associated with an increased colon cancer risk (1). Although the molecular mechanisms involved in the increased risk remain unclear, UC is associated with chromosome instability and microsatellite instability (MSI) (2, 3). The prevailing hypothesis of a cause for MSI in chronic inflammatory diseases is that overproduction of free radicals saturates the ability of the cell to repair DNA damage prior to replication (3, 4). Another hypothesis is that oxidative stress inactivates the human DNA mismatch repair system directly (5). One study reported 6 of 13 samples with high MSI as having hMLH1 hypermethylation (6). Unlike the findings in hereditary nonpolyposis colon cancer, however, other studies found little evidence for mismatch repair defects as a cause of MSI in UC (7, 8). This raises the possibility that mechanisms other than mismatch repair defects exist. We show here that there is an adaptive increase in the activities of 3-methyladenine DNA glycosylase (AAG) and apurinic endonuclease (APE1) in areas of UC colon undergoing active inflammation. Interestingly, this adaptive and imbalanced increase is associated with the MSI observed in UC. The data are consistent with a novel mechanism by which patients with chronic inflammatory diseases acquire MSI and may contribute to a better understanding of carcinogenesis in UC patients.
Methods
UC colon tissues.
Noncancerous UC colon tissues were obtained from the Cooperative Human Tissue Network (Philadelphia, Pennsylvania, USA) or the University of Maryland Department of Pathology (Baltimore, Maryland, USA). The study was approved by the Institutional Review Boards of the University of Maryland (Baltimore, Maryland, USA) and the National Institutes of Health. Because the degree of inflammation is dynamic and varies within the UC colon, two samples (paired tissues “X” and “Y”) were taken from each surgical specimen. Thirty pairs of colon samples obtained during surgery from 30 patients with UC were available for analysis.
Immunohistochemistry of AAG and APE1.
Serial paraffin sections were incubated in rabbit polyclonal antibodies (1:500 dilution) against human AAG protein (a gift from Robert Sobol, Pittsburgh School of Medicine, Pittsburgh, Pennsylvania, USA, and Timothy O’Connor, Beckman Institute, Duarte, California, USA) or monoclonal antibodies against human APE1 protein (Novus, Littleton, Colorado, USA; 1:2,000 dilution). Amplified signals were detected as described previously (9). Antigen retrieval (microwave boiling for 15 minutes in citrate buffer) was required for maximum sensitivity. The negative control was incubated with normal serum, which resulted in no signal. Scores were assigned to the immunoreactivity for AAG and APE1 as follows: less than 10% nuclear reactivity = 0; 11–25% = +0.5; 26–40% = +1; 41–55% = +1.5; 56–70% = +2.0; 71–85% = +2.5; 86–100% = +3.0.
Preparation of tissue extracts for AAG and APE1 activity assays.
All steps for protein isolation were carried out at 4°C. Tissues that were frozen when fresh were homogenized for 5-second intervals in cold (4°C) AAG or APE1 buffer. The AAG buffer contained 100 mM Tris (pH 7.5), 300 mM KCl, 50 mM EDTA, 50 mM EGTA, 143 mM β-mercaptoethanol, 10 mM benzamidine, 100 μg/ml leupeptine, 100 μg/ml pepstatin A, and 1 mg/ml aprotinin. The APE1 buffer contained 50 mM HEPES-KOH (pH 7.5), 50 mM KCl, 100 μg/ml BSA, 10 mM MgCl2, and 0.05% Triton X-100. The homogenate was centrifuged at 150,000 g in a Sorval RC M120 centrifuge for 10 minutes. Following supernatant collection and determination of protein concentrations, samples were frozen at –80°C until analysis.
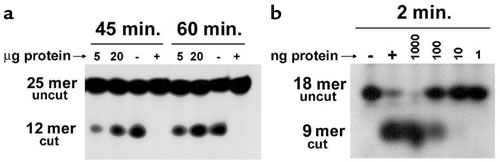
The AAG glycosylase is the major glycosylase involved in the repair of 1,N 6-ethenoadenine (εA) and hypoxanthine adducts (11); both products are adducts formed by free radicals and in areas of chronic inflammation (12–16). The oligonucleotide-based assay for AAG activity has been described previously (10). The oligonucleotide substrates (5′-GGATCATCGTTTTTεAGCTACATCGC-3′; 25-mer) and its complementary strand (5′-GCGATGTAGCTAAAAACGATGATCC-3′) were purchased from Midland Certified Reagents (Midland, Texas, USA).
Time-course and dose-response experiments were carried out to determine the best conditions to compare paired tissue samples X and Y. Conditions in the linear range of the curves were chosen (Supplementary Figure 1a, http://www.jci.org/cgi/content/full/112/12/1887/DC1). Therefore, incubations were carried out for 45 minutes with 20 μg protein in AAG buffer. Recombinant AAG glycosylase protein (1 μg; Trevigen, Gaithersburg, Maryland, USA) was used as a positive control, and BSA (1 μg) was used as a negative control.
The oligonucleotide-based assay for APE1 activity was carried out on a double-stranded DNA substrate (18-mer) containing an apurinic/apyrimidinic (AP) site (Midland Certified Reagents). Briefly, an oligonucleotide sequence containing the AP site (5′-GTCACCGTC(AP)TACGACTC-3′) was 5′-end-labeled with T4 polynucleotide kinase and [γ- 32P]ATP, then annealed to a fivefold excess of the complimentary strand (3′-CAGTGGCAGCATGCTGAG-5′). Time-course and dose-response experiments were carried out to determine the best conditions to compare paired tissue samples X and Y. Conditions in the linear range of the curves were chosen (Supplementary Figure 1b, http://www.jci.org/cgi/content/full/112/12/1887/DC1). Therefore, incubations were carried out for 2 minutes with 0.2 μg protein in APE1 buffer followed by the addition of formamide loading buffer and heating to 65°C for 5 minutes to stop the reaction. Recombinant APE1 (1 μg; Trevigen) was used as a positive control, and BSA (1 μg) was used as a negative control. For both the AAG and APE1 assays, the DNA fragments were separated by 20% denaturing polyacrylamide gel electrophoresis. Gels were exposed to a phosphorimaging screen, and images were captured using a Fujifilm FLA-5000 (Fuji Medical System, Stamford, Connecticut, USA) phosphorimager. Bands were quantified using Image Gauge Version 3.45 (Fuji Medical System). Each experiment was repeated three times. AAG and APE1 enzyme activities were expressed as femtomoles of oligonucleotide cut per microgram of protein per minute, after quantification of upper and lower bands on a phosphorimager. For these reactions, 100 fmol uncut product was added to each reaction mixture.
CD68 quantification of inflammation.
CD68 is highly expressed by human monocytes and tissue macrophages (17). Therefore, we used this as a marker of inflammation. Western blot analyses were done on the extracts used for oligonucleotide-based AAG and APE1 activity assays. Briefly, 35 μg of protein lysates was loaded onto each lane of a 10% SDS-PAGE gel (Invitrogen, Carlsbad, California, USA), followed by electrotransfer onto a nitrocellulose membrane. The primary antibody used was a mouse monoclonal anti-human CD68 (Dako, Carpinteria, California, USA). Extracts from HL60 cells were used as positive controls. Extracts from MCF-7 cells were used as negative controls.
MSI.
DNA isolation for MSI has been described previously (18). A PCR-based approach (19) of microsatellite polymorphism analysis was used. Markers for MSI were chosen based on recommendations from the National Cancer Institute Workshop on Microsatellite Instability (20). The following panel of five loci was examined: BAT 25, BAT 26, D5S346 (APC), D2S123, and D17S250 (Mfd15CA). The UC colon samples and human cells overexpressing AAG or APE1 were characterized as high-frequency MSI (MSI-High) if two or more of the five markers showed instability (i.e., had insertion or deletion mutations); low-frequency MSI (MSI-Low) if only one of the five markers showed instability; or microsatellite stable. Because the Bloom syndrome gene (BLM) and TGF-β receptor 2 gene (TGFβRII) have been shown to be mutated in colon cancers, we also examined these two genes for MSI (21, 22).
AAG and APN1 protein expression and the generation of frameshift mutations in yeast.
Human AAG cDNA (encoding the major 3-MeA DNA glycosylase) was expressed from the galactose inducible promoter in the pYES-AAG plasmid (derived from the Invitrogen pYES2.0 plasmid) as described previously (23). The Saccharomyces cerevisiae APN1 gene was expressed from the YEpAPN1 plasmid as described previously (23). YEpAPN1, pYES2.0, and pYES-AAG were transformed into two yeast strains by the lithium acetate method. The isogenic S. cerevisiae haploid strains E133 and E134 are Matα ade5-1 his7-2 leu2-3,112 trp1-289 ura3-52 lys2:InsE. The lys2:InsE inserts in the LYS2 gene were described previously (24) and contain homonucleotide runs of A residues, resulting in a Lys– phenotype because of a –1 or +1 frameshift, respectively. Thus, E133 reverts to Lys+ by a +1 frameshift, and E134 reverts by a –1 frameshift mutation. For the Lys–-to-Lys+ spontaneous mutation assays, cultures were grown to saturation at 30°C in synthetic glucose (2% [weight/volume]) minimal medium lacking uracil or histidine (to maintain selection of the pYES and pYES-AAG vectors or to maintain selection of the YEpAPN1 vector, respectively) and supplemented with the required amino acids. The cultures were diluted to a density of about 4,000 cells/ml in synthetic galactose medium (2% [weight/volume]) (to induce expression from the GAL1 promoter) and were divided into ten 10-ml cultures, which were then incubated at 30°C for 5 days. After the incubation period, cells were harvested by centrifugation, washed, and resuspended in water, and aliquots (0.1 ml) of each of the cultures were spread on agar plates made of synthetic minimal medium lacking uracil and lysine; after 5 days at 30°C, the number of Lys+ colonies was scored. Cell viability was determined by plating aliquots from three randomly chosen cultures for each strain on synthetic glucose minimal medium agar plates containing lysine. Mutant frequencies were calculated by dividing the median number of Lys+ revertants by the number of colony-forming units. Results are expressed as mean ± standard deviation.
AAG and APE1 protein expression and MSI in human cells.
K562 cells were transduced with retroviral supernatants (3 × 10⁵ viral particles) supplemented with 4 μg/ml polybrene for 6 hours at 37°C, and then colonies were isolated and tested for expression levels by western blotting. Cells with the highest AAG and/or APE1 expression were selected for further studies and were cultured in RPMI 1640 supplemented with 10% FBS, penicillin/streptomycin, and L-glutamine for approximately 45 population doublings.
K562 cells were harvested by centrifugation and washed with glycosylase buffer (20 mM Tris-HCl, pH 7.6, 100 mM KCl, 5 mM EDTA, 1 mM EGTA, and 5 mM β-mercaptoethanol), and pellets were flash-frozen in liquid nitrogen. Pellets were allowed to thaw in 200–400 μl glycosylase buffer supplemented with protease inhibitors (100 μM benzamidine HCl, 1 μg/ml leupeptin, 1 μg/ml pepstatin A, and 1 μg/ml aprotinin) and were disrupted by sonication. Cell debris were removed by centrifugation (10,000 g for 30 minutes at 4°C) and protein concentration was determined by the Coomassie Plus Protein Assay (Biorad, Hercules, California, USA).
For AAG activity assays, 400 fmol of 32P-labeled oligonucleotide duplex containing a centrally located hypoxanthine base was incubated in glycosylase buffer with 12.5 μg protein extract for 24 minutes at 37°C. The DNA was chemically cleaved (1 M piperidine at 90°C for 15 minutes) at AP sites, and the reaction products were analyzed on a 20% denaturing polyacrylamide gel.
For APE1 activity assays, 150 fmol of 32P-labeled oligonucleotide duplex containing a centrally located AP site was incubated for 5 minutes at 37°C with 0.0125 μg protein extract in assay buffer containing 50 mM HEPES-KOH (pH 7.5), 50 mM KCl, 100 μg/ml BSA, 10 mM MgCl2, and 0.05% Triton X-100. Reactions were stopped by the addition of EDTA, and the reaction products were analyzed on a 20% denaturing polyacrylamide gel. MSI was assessed as described earlier in Methods.
Statistics.
The software used for analysis was Stata (StataCorp, College Station, Texas, USA). Mean differences in base excision–repair (BER) activities and levels were compared by a paired t test. Robust regression analyses using median regression and one-way ANOVA with Scheffe multiple comparison tests were performed for comparisons of enzyme activity with MSI trends. A Pearson correlation coefficient was applied for comparisons of the CD68 and BER enzyme activities. The Mantel-Haenszel χ2 and the Row mean scores tests were used to evaluate the shift toward MSI with imbalances of BER. Kappa statistics were used to calculate significant deviation from a balance of AAG and APE1 enzyme activities. The P value chosen for significance in this study was 0.05.
Results
Immunohistochemical localization of AAG and APE1.
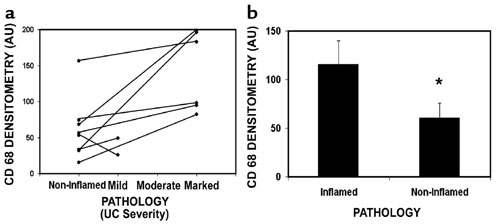
We first examined the UC tissues by immunohistochemistry to determine the expression and localization of AAG and APE1. Figure 1a shows that these enzymes had nuclear localization in both the inflammatory cells (consistent with an area of active inflammation) and the mucosa (epithelium and stroma). AAG and APE1 were detectable at lower levels in the areas of the UC colon categorized according to their pathology as noninflamed (Figure 1b and Supplementary Figure 2, http://www.jci.org/cgi/content/full/112/12/1887/DC1).
Figure 1.

Cellular localization and quantification of AAG and APE1 in the UC colon. (a) AAG and APE1 were present in inflammatory cells (I) and in the mucosa (epithelium [E] and stroma [S]) of a patient with UC. Magnification, ×400. (b) AAG (n = 8) and APE1 (n = 8) levels were quantified in areas of UC colon pathologically defined as inflamed (black bars) and noninflamed (white bars). *, significantly lower AAG levels in the noninflamed areas of the UC colon (P = 0.04). **, significantly lower APE1 levels in the noninflamed areas of the UC colon (P = 0.003). Scoring criteria are described in Methods.
Adaptive increases in AAG and APE1 activity in UC colon tissue.
Because increased levels of AAG and APE1 proteins were observed in the epithelial mucosa of areas of UC tissue defined pathologically as inflamed or noninflamed, we set out to determine whether AAG and APE1 enzyme activities were elevated in inflamed mucosa in a panel of 30 UC cases. Although there is a correlation between diagnosis based on pathology and CD68 levels (Supplementary Figure 2, http://www.jci.org/cgi/content/full/112/12/1887/DC1), the diagnosis does not necessarily reflect the degree of inflammation and pathology in the adjacent, specific tissue sample used for activity assays. We therefore independently measured the level of the inflammatory cell marker CD68 in each paired tissue (X and Y). The tissue sample with the lower CD68 level was analyzed for AAG and APE1 enzyme activities. This “baseline” activity was then compared with the activity of the more inflamed sample (i.e., the sample with the higher CD68 level).
First, we examined AAG activities (Figure 2, a, c, and e). In tissue samples (X vs. Y) from each individual, the sample with the higher CD68 tended to have higher enzyme activity (Figure 2a). When these values were plotted (Figure 2e), there was a statistically significant positive correlation between the difference in CD68 values (ratio of CD68 high to CD68 baseline) and the difference in AAG activity values (ratio of CD68 high to CD68 baseline) (P = 0.005), indicating that as the degree of inflammation increases, the AAG activity increases. Overall, AAG activity was higher in areas of higher inflammation (0.27 ± 0.02 fmol oligonucleotide cut per minute) than in the less-inflamed areas (0.24 ± 0.01 fmol oligonucleotide cut per minute; P = 0.01). Twenty-two of thirty subjects (73%) had higher AAG activity in the paired tissue that had higher CD68 levels.
Figure 2.

AAG and APE1 activities adaptively increase in response to increasing amounts of inflammation. (a) Examples of how levels of CD68 parallel changes in AAG activity. Tissues X and Y were categorized into inflamed (I) and noninflamed (NI) areas as described in Methods, then assessed for AAG activity (arrowhead). (b) Examples of how levels of CD68 parallel changes in APE1 activity. Tissues X and Y were categorized into inflamed and noninflamed areas as described in Methods, then assessed for APE1 activity (arrowhead). (c) Comparison of activity of AAG in areas of the UC colon categorized by CD68 levels as noninflamed or inflamed (n = 30). *, significant difference from CD68-low tissues (paired t test, P < 0.01). (d) Comparison of activity of APE1 in areas of the UC colon categorized by CD68 levels as noninflamed or inflamed. *, significant difference from CD68-low tissues (paired t-test, P < 0.01). (e) Pearson correlation coefficient quantifying the ratio of samples X/Y with regards to CD68 densitometry and AAG activity. (f) Pearson correlation coefficient quantifying the ratio of samples X/Y with regards to CD68 densitometry and APE1 activity.
We next examined APE1 activities (Figure 2, b, d, f). In tissue samples (X vs. Y) from each individual, the sample with the higher CD68 tended to have higher APE1 activity (Figure 2b). When these values were plotted (Figure 2f), there was a marginal but significant positive correlation between the difference in CD68 values (ratio of CD68 high to CD68 baseline) and the difference in APE1 activity values (ratio of CD68 high to CD68 baseline) (P = 0.04), indicating that as the degree of inflammation increases, the APE1 activity increases. Overall, APE1 activity was higher in areas of higher inflammation (43.4 ± 1.6 fmol oligonucleotide cleaved per minute) than in the less-inflamed areas (36.9 ± 2.6 fmol oligonucleotide cleaved per minute; P = 0.03). Nineteen of thirty subjects (63%) had higher APE1 activity in the paired tissue that had higher CD68 levels. The observation that the AAG and APE1 antibodies detected an adaptive increase in epithelial and inflammatory cells following laser-capture microdissection (Supplementary Figure 3, http://www.jci.org/cgi/content/full/112/12/1887/DC1) is consistent with the hypothesis that both cell types have the ability to adaptively respond to inflammatory stress.
Positive correlation between increasing AAG and APE1 enzymatic activities and increasing MSI in UC colon tissues.
In a separate set of experiments, we assessed MSI in our UC sample set. Ten of the thirty UC subjects were identified as MSI-Low (three in mononucleotide tracts and seven in CAn dinucleotide repeats). This observation is consistent with previous studies (3, 25) that also found that a majority of MSI-Low tissues have instability occurring in dinucleotide repeats. Five of the thirty subjects were identified as MSI-High (one in mononucleotide tracts only and four in both mononucleotide tracts and CAn dinucleotide repeats). Also supported by previous studies (26) was the observation that instability at the mononucleotide tract BAT26 occurred in 100% of the MSI-High group. After subdividing the UC cases into three groups (microsatellite stable, MSI-Low, and MSI-High), we determined whether the increases in AAG and APE1 activities were uniform among the three groups. There was a statistically significant (robust regression analysis, P = 0.0012) positive correlation between MSI and AAG activity (Figure 3a). In addition, the MSI-High group had statistically significantly higher APE1 activity (Figure 3b) than the microsatellite stable and MSI-Low groups (one-way ANOVA, Scheffe multiple comparison, P = 0.0004). Thus, the MSI-High group had the highest increases in AAG and APE1 activities. Data in Figure 3, c, d, and e also highlight that an imbalance of BER in UC is associated with MSI; 64% and 67% of MSI-Low and MSI-High samples, respectively, had an imbalance in AAG and APE1 activities, compared with 34% of the microsatellite-stable samples. The Mantel-Haenszel chi-square and row mean scores tests indicated a shift toward higher MSI in the groups identified as imbalanced (P = 0.049; Figure 3 c, d and e, shaded areas). Simple kappa values for each stratum of MSI were as follows: microsatellite stable, 0.4798 (confidence interval = 0.2688 to 0.6909); MSI-Low: 0.125 (confidence interval = –0.2054 to 0.4554); MSI-High: 0.0769 (confidence interval = –0.1240 to 0.2778). There was a visible trend for decreased kappa values at higher levels of MSI, consistent with the notion that an imbalance between AAG and APE1 (i.e., more samples in shaded areas of Figure 3, c, d, and e) increased at higher levels of MSI. The kappa values for the different levels of MSI were statistically different (P = 0.0188). We also observed that instability in mononucleotide repeats was more likely to occur only in tissues ranked in the bottom two thirds with regards to either AAG or APE1 enzyme activity. Higher enzyme activity appeared to generate MSI instability in dinucleotide repeats (Supplementary Figure 4, http://www.jci.org/cgi/content/full/112/12/1887/DC1).
Figure 3.

(a and b) Correlation between MSI and AAG (a) or APE1 (b) activity. Bar graphs represent means ± SEM. There was a significant trend for MSI and AAG activity (robust regression analysis, P = 0.0012). Although this trend was not observed between MSI and APE1, there was a significant increase in APE1 activity in the MSI-High group (n = 5; one-way ANOVA with Scheffe multiple comparison test, P = 0.0004). *, AAG activity is significantly higher in the MSI-Low group (n = 10) than in the microsatellite stable group (n = 15). **, AAG activity is significantly higher in the MSI-High group (n = 5) than in the MSI-Low group (n = 10). ***, APE1 activity is significantly higher in the MSI-High group (n = 5) than in the MSI-Low (n = 10) and microsatellite stable (n = 15) groups. (c–e) Number of samples belonging to a specific AAG and APE1 activity category. AAG and APE1 activities were ranked in order, then placed into tertiles as samples with activity belonging to the Lower 1/3, Middle 1/3, or Top 1/3. (c) Of the 60 samples, 43 did not have a band shift and were characterized as microsatellite stable samples. (d) Of the 60 samples, 11 had a band shift in one of the markers examined (including TGFβRII and BLM) and were characterized as MSI-Low samples. (e) Of the 60 samples, six had a band shift in two or more of the markers examined (including TGFβRII and BLM) and were characterized as MSI-High samples. Shaded boxes represent activities where there is an imbalance of AAG and APE1 activities. The simple κ statistic indicates a trend for imbalance between AAG and APE1 as MSI levels increase. The simple κ statistic of 1.0 indicates no imbalance. A simple κ statistic moving toward zero indicates greater imbalance between the two enzymes.
Expression of AAG and APE1 in human cells generates MSI.
Because UC patients diagnosed as MSI-High had elevated levels of both AAG and APE1, we overexpressed these enzymes in a human cell line. Supplementary Figure 5 (http://www.jci.org/cgi/content/full/112/12/1887/DC1) shows the activity of each enzyme was elevated (approximately twofold for each enzyme) following their overexpression in K562 human erythroleukemia cells. Table 1 and Supplementary Figure 6 (http://www.jci.org/cgi/content/full/112/12/1887/DC1) show that cells overexpressing either enzyme are microsatellite unstable. Cells were assessed for MSI at approximately 45 population doublings. AAG-expressing cells were classified as MSI-Low. Expression of APE1 alone or in combination with AAG generated a MSI-High phenotype. Overexpression of AAG or APE1 generated frameshift mutations in microsatellite markers with dinucleotide repeats (D2S123 and D17S250), whereas overexpression of both AAG and APE1 also yielded frameshift mutations in microsatellite markers with monotonic nucleotide runs of A residues (TGFβRII and BAT26).
Table 1.
MSI in K562 human erythroleukemia cells overexpressing (twofold activity) AAG, APE1, or both AAG and APE1

Expression of the AAG in yeast elevates spontaneous frameshift mutations.
We extended these mechanistic studies to a yeast model. 3-MeA DNA glycosylase overexpression has previously been shown to generate a strong mutator phenotype in yeast, as measured by an increased rate of base substitution mutations (23, 27, 28). In a separate set of experiments, we observed here that expression of the human AAG enzyme dramatically increased spontaneous frameshift mutations, having a greater effect on the generation of a –1 frameshift mutation (approximately 30-fold; Figure 4a) than on the generation of a +1 frameshift mutation (approximately sixfold; Figure 4b). In contrast to previous studies showing that coexpression of APN1 (the major AP endonuclease in S. cerevisiae) with the yeast homolog of AAG suppressed the increased rate of spontaneous base substitution mutations induced by excess AAG (23), APN1 did not suppress the AAG-induced increased rates of frameshift mutations (Figure 4, a and b).
Figure 4.

Induction of –1 (a) and +1 (b) frameshift mutations in yeast by human AAG. Plasmids pYES2.0 and pYES-AAG were transformed into the E133 or E134 yeast strains, then assessed for frameshift mutations by reversion from Lys– to Lys+. APN1 was also coexpressed to determine its effect on AAG-induced mutations (right bars). Bar graphs represent the mean ± standard deviations. *, significant difference from pYES control (P < 0.01).
Discussion
Free radicals generated at sites of active inflammation cause DNA damage (29, 30). BER is a key pathway used in the protection of free radical attack on DNA (31). Here, we show that (a) UC patients have increased AAG and APE1 enzyme activities in epithelial areas of their colon undergoing active inflammation; (b) UC patients with MSI have the largest increase and imbalance in levels of AAG and APE1 in inflamed areas of their colons; and (c) overexpression of the AAG and APE1/ APN1 enzymes is associated with frameshift mutations in S. cerevisiae and MSI in human cells. These observations indicate that, ironically, the adaptive imbalanced increase in BER enzymes may have DNA-damaging effects and contribute to carcinogenesis in chronic inflammation.
The adaptive AAG and APE1 increases in the colonic epithelium may reflect a defense mechanism to repair DNA damage induced by free radicals. Indeed, various kinases and DNA repair enzymes are modulated by free radicals in cell models (32–35). We have shown that p53 is post-translationally modified and accumulates in response to the free radical, nitric oxide (NO•). This occurs not only with NO• donors but also in a coculture model with NO•-releasing macrophages and in patients with UC who have high NO• levels (36). Interestingly, we have observed that NO• can increase AAG and APE1 protein and its activity (ref. 37 and data not shown). Similarly, zinc deficiency, which causes an increase in free radical formation, leads to an increase in APE1 (38).
One mechanism of activation of repair enzymes is through cellular recognition of damage and transcriptional upregulation of BER enzymes (e.g., AAG and APE1). Putative transcription factor binding sites for AAG include n-myc (39), Sp-1 (39), Usf-1 (39), E2F (39), CBP (39), and AP-2 (40). Putative transcription factor recognition sites for APE include Sp-1 (41), USF (42), AP-1 (43), CREB (43), ATF (43), and the calcium responsive elements nCaRE-A and nCaRE-B (44). The APE-1 promoter also contains the consensus sequence for binding NF-κB (34). It would be interesting to determine the response of the human AAG and APE1 promoter elements to the inflammatory agents such as free radicals and cytokines. For example, the CREB binding site has been shown to upregulate Ape1/Ref-1 in response to oxidative stress (43).
Additionally, as with p53 (36), AAG and APE1 enzyme levels and activity may be increased through post-translational modification. Although AAG has not been shown to be activated by post-translational modification, its family member human OGG1 DNA glycosylase does undergo serine phosphorylation by protein kinase C (45). Furthermore, p300/CBP can acetylate members of the BER pathway like thymine DNA glycosylase (46), polymerase β (47), and flap endonuclease I (48). Thus, a yet-to-be-defined molecular switch, most likely controlled by free radicals, may regulate the AAG and APE1 enzymatic activities or stabilization.
MSI occurs in many tumor types and has been shown to occur in tissues undergoing inflammation, including UC (3). Overexpression of DNA polymerase β has recently been shown to contribute to MSI in vitro (49). Previously, an imbalance of BER enzymes was shown to generate spontaneous mutations (23, 27, 28). We now show that an imbalanced increase of AAG and APE1 may contribute to MSI. First, excess AAG and APE1 increased frameshift mutations in yeast (Figure 4) and MSI in human cells (Table 1 and Supplementary Figures 5 and 6, http://www.jci.org/cgi/content/full/112/12/1887/DC1). In addition, there is a significant positive correlation between elevated AAG and APE1 activities and MSI (Figure 3). In turn, MSI may mutate genes involved in colon carcinogenesis. For example, Bax, TGF-βRII, and BLM have monotonic nucleotide repeats that can be inactivated by frameshift mutations (21, 50, 51). Interestingly, we observed a frameshift mutation in the TGFβRII gene in one individual in our UC sample set (data not shown). We also observed a frameshift mutation in the TGFβRII gene and another microsatellite marker (BAT26) with a monotonic nucleotide run of A residues in our human cell model, in which both AAG and APE1 are overexpressed (Table 1 and Supplementary Figure 6, http://www.jci.org/cgi/content/full/112/12/1887/DC1). Recently, MSI of the BLM gene was reported in sporadic colon cancers (22). Also, haploinsufficiency of BLM has been shown to increase the risk of colon cancer in humans and animal models (52, 53). However, we did not find a BLM mutation in our UC sample set or cell lines (data not shown).
To our knowledge, this is the first time that inflamed UC colon tissues exhibiting MSI have been shown to display increased AAG and APE1 activities and to be positively correlated with their imbalance. Our studies using yeast and human cells indicate that increased AAG and APE1 activities alone or together are associated with MSI. The specific mechanisms for the BER association with MSI remain to be elucidated. It was previously shown that the AAG enzyme is capable of removing normal, undamaged bases from DNA (54), and it is possible that such activity is more pronounced in particular sequence contexts such as monotonic runs of A residues and dinucleotide repeat regions. Alternatively, these kinds of sequences may be more prone to the induction of damage recognized by AAG and by other DNA glycosylases. Thus, increased activity of BER enzymes at monotonic nucleotide runs of A residues and at microsatellite repeat sequences appears to increase spontaneous frameshift mutagenesis, and the precise mechanism by which these mutations arise is currently under investigation. The results of such studies, together with those presented here, will enhance our understanding of carcinogenesis in UC and may extend to other chronic inflammatory diseases.
Supplementary Material
Acknowledgments
We would like to thank Ping He for expert assistance in diagnosis of pathology; and David M. Wilson, Vilhelm A. Bohr, and C. Richard Boland for their critical comments. We thank Dorothea Dudek for editorial assistance, and Karen MacPherson for assistance in manuscript preparation. We would also like to thank Wendy Ullmer, Elise D. Bowman, Peijun He, and Irfan Shaikh for their expert technical assistance. This research was supported in part by NIH grants CA75576, CA55042, and ES02109 (L.D. Samson), and NSF Biotechnology Process Engineering Center (O. Nikolayeva). L.D. Samson is the Ellison American Cancer Society Research Professor.
Footnotes
See the related Commentary beginning on page 1793.
Lorne J. Hofseth and Mohammed A. Khan contributed equally to this work.
Conflict of interest: The authors have declared that no conflict of interest exists.
Nonstandard abbreviations used: ulcerative colitis (UC); microsatellite instability (MSI); 3-methyladenine DNA glycosylase (AAG); apurinic/apyrimidinic endonuclease (APE1); 3-methyladenine (3-MeA); apurinic/apyrimidinic (AP); base excision–repair (BER).
References
- 1.Ekbom A, Helmick C, Zack M, Adami HO. Ulcerative colitis and colorectal cancer. A population-based study. N. Engl. J. Med. 1990;323:1228–1233. doi: 10.1056/NEJM199011013231802. [DOI] [PubMed] [Google Scholar]
- 2.O’Sullivan JN, et al. Chromosomal instability in ulcerative colitis is related to telomere shortening. Nat. Genet. 2002;32:280–284. doi: 10.1038/ng989. [DOI] [PubMed] [Google Scholar]
- 3.Loeb KR, Loeb LA. Genetic instability and the mutator phenotype. Studies in ulcerative colitis. Am. J. Pathol. 1999;154:1621–1626. doi: 10.1016/S0002-9440(10)65415-6. [DOI] [PMC free article] [PubMed] [Google Scholar]
- 4.Brentnall TA, et al. Microsatellite instability in nonneoplastic mucosa from patients with chronic ulcerative colitis. Cancer Res. 1996;56:1237–1240. [PubMed] [Google Scholar]
- 5.Chang CL, et al. Oxidative stress inactivates the human DNA mismatch repair system. Am. J. Physiol. Cell Physiol. 2002;283:C148–C154. doi: 10.1152/ajpcell.00422.2001. [DOI] [PubMed] [Google Scholar]
- 6.Fleisher AS, et al. Microsatellite instability in inflammatory bowel disease-associated neoplastic lesions is associated with hypermethylation and diminished expression of the DNA mismatch repair gene, hMLH1. Cancer Res. 2000;60:4864–4868. [PubMed] [Google Scholar]
- 7.Cawkwell L, et al. Defective hMSH2/hMLH1 protein expression is seen infrequently in ulcerative colitis associated colorectal cancers. Gut. 2000;46:367–369. doi: 10.1136/gut.46.3.367. [DOI] [PMC free article] [PubMed] [Google Scholar]
- 8.Noffsinger AE, et al. A germline hMSH2 alteration is unrelated to colonic microsatellite instability in patients with ulcerative colitis. Hum. Pathol. 1999;30:8–12. doi: 10.1016/s0046-8177(99)90293-9. [DOI] [PubMed] [Google Scholar]
- 9.Ambs S, et al. Frequent nitric oxide synthase-2 expression in human colon adenomas: implication for tumor angiogenesis and colon cancer progression. Cancer Res. 1998;58:334–341. [PubMed] [Google Scholar]
- 10.Wyatt MD, Samson LD. Influence of DNA structure on hypoxanthine and 1, N6-ethenoadenine removal by murine 3-methyladenine DNA glycosylase. Carcinogenesis. 2000;21:901–908. doi: 10.1093/carcin/21.5.901. [DOI] [PubMed] [Google Scholar]
- 11.Engelward BP, et al. Base excision repair deficient mice lacking the Aag alkyladenine DNA glycosylase. Proc. Natl. Acad. Sci. U. S. A. 1997;94:13087–13092. doi: 10.1073/pnas.94.24.13087. [DOI] [PMC free article] [PubMed] [Google Scholar]
- 12.Bartsch H, Nair J, Velic I. Etheno-DNA base adducts as tools in human cancer aetiology and chemoprevention. Eur. J. Cancer. Prev. 1997;6:529–534. doi: 10.1097/00008469-199712000-00007. [DOI] [PubMed] [Google Scholar]
- 13.Bartsch H. Studies on biomarkers in cancer etiology and prevention: a summary and challenge of 20 years of interdisciplinary research. Mutat. Res. 2000;462:255–279. doi: 10.1016/s1383-5742(00)00008-9. [DOI] [PubMed] [Google Scholar]
- 14.Ohshima H, Bartsch H. Chronic infections and inflammatory processes as cancer risk factors: possible role of nitric oxide in carcinogenesis. Mutat. Res. 1994;305:253–264. doi: 10.1016/0027-5107(94)90245-3. [DOI] [PubMed] [Google Scholar]
- 15.Nair J, et al. Lipid peroxidation-induced etheno-DNA adducts in the liver of patients with the genetic metal storage disorders Wilson’s disease and primary hemochromatosis. Cancer Epidemiol. Biomarkers Prev. 1998;7:435–440. [PubMed] [Google Scholar]
- 16.Nair J, Barbin A, Velic I, Bartsch H. Etheno DNA-base adducts from endogenous reactive species. Mutat. Res. 1999;424:59–69. doi: 10.1016/s0027-5107(99)00008-1. [DOI] [PubMed] [Google Scholar]
- 17.Holness CL, Simmons DL. Molecular cloning of CD68, a human macrophage marker related to lysosomal glycoproteins. Blood. 1993;81:1607–1613. [PubMed] [Google Scholar]
- 18.Soini Y, et al. An aflatoxin-associated mutational hotspot at codon 249 in the p53 tumor suppressor gene occurs in hepatocellular carcinomas from Mexico. Carcinogenesis. 1996;17:1007–1012. doi: 10.1093/carcin/17.5.1007. [DOI] [PubMed] [Google Scholar]
- 19.Burke L, et al. Allelic deletion analysis of the FHIT gene predicts poor survival in non-small cell lung cancer. Cancer Res. 1998;58:2533–2536. [PubMed] [Google Scholar]
- 20.Boland CR, et al. A National Cancer Institute Workshop on Microsatellite Instability for cancer detection and familial predisposition: development of international criteria for the determination of microsatellite instability in colorectal cancer. Cancer Res. 1998;58:5248–5257. [PubMed] [Google Scholar]
- 21.Markowitz S, et al. Inactivation of the type II TGF-β receptor in colon cancer cells with microsatellite instability. Science. 1995;268:1336–1338. doi: 10.1126/science.7761852. [DOI] [PubMed] [Google Scholar]
- 22.Calin G, et al. Somatic frameshift mutations in the Bloom syndrome BLM gene are frequent in sporadic gastric carcinomas with microsatellite mutator phenotype. BMC Genet. 2001;2:14. doi: 10.1186/1471-2156-2-14. [DOI] [PMC free article] [PubMed] [Google Scholar]
- 23.Glassner BJ, Rasmussen LJ, Najarian MT, Posnick LM, Samson LD. Generation of a strong mutator phenotype in yeast by imbalanced base excision repair. Proc. Natl. Acad. Sci. U. S. A. 1998;95:9997–10002. doi: 10.1073/pnas.95.17.9997. [DOI] [PMC free article] [PubMed] [Google Scholar]
- 24.Tran HT, Keen JD, Kricker M, Resnick MA, Gordenin DA. Hypermutability of homonucleotide runs in mismatch repair and DNA polymerase proofreading yeast mutants. Mol. Cell Biol. 1997;17:2859–2865. doi: 10.1128/mcb.17.5.2859. [DOI] [PMC free article] [PubMed] [Google Scholar]
- 25.Goel A, et al. Characterization of sporadic colon cancer by patterns of genomic instability. Cancer Res. 2003;63:1608–1614. [PubMed] [Google Scholar]
- 26.Hoang JM, et al. BAT-26, an indicator of the replication error phenotype in colorectal cancers and cell lines. Cancer Res. 1997;57:300–303. [PubMed] [Google Scholar]
- 27.Glassner BJ, Posnick LM, Samson LD. The influence of DNA glycosylases on spontaneous mutation. Mutat. Res. 1998;400:33–44. doi: 10.1016/s0027-5107(98)00045-1. [DOI] [PubMed] [Google Scholar]
- 28.Xiao W, Samson L. In vivo evidence for endogenous DNA alkylation damage as a source of spontaneous mutation in eukaryotic cells. Proc. Natl. Acad. Sci. U. S. A. 1993;90:2117–2121. doi: 10.1073/pnas.90.6.2117. [DOI] [PMC free article] [PubMed] [Google Scholar]
- 29.Ames BN. Endogenous oxidative DNA damage, aging, and cancer. Free Radic. Res Commun. 1989;7:121–128. doi: 10.3109/10715768909087933. [DOI] [PubMed] [Google Scholar]
- 30.Hussain SP, Hofseth LJ, Harris CC. Radical causes of cancer. Nat. Rev. Cancer. 2003;3:276–285. doi: 10.1038/nrc1046. [DOI] [PubMed] [Google Scholar]
- 31.Bohr VA. Repair of oxidative DNA damage in nuclear and mitochondrial DNA, and some changes with aging in mammalian cells. Free Radic. Biol. Med. 2002;32:804–812. doi: 10.1016/s0891-5849(02)00787-6. [DOI] [PubMed] [Google Scholar]
- 32.Xu W, Liu L, Smith GC, Charles l. Nitric oxide upregulates expression of DNA-PKcs to protect cells from DNA-damaging anti-tumour agents. Nat. Cell Biol. 2000;2:339–345. doi: 10.1038/35014028. [DOI] [PubMed] [Google Scholar]
- 33.Akhand AA, et al. Nitric oxide controls src kinase activity through a sulfhydryl group modification-mediated Tyr-527-independent and Tyr-416-linked mechanism. J. Biol. Chem. 1999;274:25821–25826. doi: 10.1074/jbc.274.36.25821. [DOI] [PubMed] [Google Scholar]
- 34.Ramana CV, Boldogh I, Izumi T, Mitra S. Activation of apurinic/apyrimidinic endonuclease in human cells by reactive oxygen species and its correlation with their adaptive response to genotoxicity of free radicals. Proc. Natl. Acad. Sci. U. S. A. 1998;95:5061–5066. doi: 10.1073/pnas.95.9.5061. [DOI] [PMC free article] [PubMed] [Google Scholar]
- 35.Rusyn I, et al. Expression of base excision repair enzymes in rat and mouse liver is induced by peroxisome proliferators and is dependent upon carcinogenic potency. Carcinogenesis. 2000;21:2141–2145. doi: 10.1093/carcin/21.12.2141. [DOI] [PubMed] [Google Scholar]
- 36.Hofseth LJ, et al. Nitric oxide-induced cellular stress and p53 activation in chronic inflammation. Proc. Natl. Acad. Sci. U. S. A. 2003;100:143–148. doi: 10.1073/pnas.0237083100. [DOI] [PMC free article] [PubMed] [Google Scholar]
- 37.Zurer, I., et al. 2003. The role of p53 in base excision repair following genotoxic stress. Carcinogenesis. In press. [DOI] [PubMed]
- 38.Ho E, Ames BN. Low intracellular zinc induces oxidative DNA damage, disrupts p53, NFkappa B, and AP1 DNA binding, and affects DNA repair in a rat glioma cell line. Proc. Natl. Acad. Sci. U. S. A. 2002;99:16770–16775. doi: 10.1073/pnas.222679399. [DOI] [PMC free article] [PubMed] [Google Scholar]
- 39.Bouziane M, et al. Promoter structure and cell cycle dependent expression of the human methylpurine-DNA glycosylase gene. Mutat. Res. 2000;461:15–29. doi: 10.1016/s0921-8777(00)00036-7. [DOI] [PubMed] [Google Scholar]
- 40.Cerda SR, et al. Regulation of expression of N-methylpurine DNA glycosylase in human mammary epithelial cells: role of transcription factor AP-2. Chem. Res. Toxicol. 1999;12:1098–1109. doi: 10.1021/tx9901027. [DOI] [PubMed] [Google Scholar]
- 41.Fung H, Bennett RA, Demple B. Key role of a downstream specificity protein 1 site in cell cycle-regulated transcription of the AP endonuclease gene APE1/APEX in NIH3T3 cells. J. Biol. Chem. 2001;276:42011–42017. doi: 10.1074/jbc.M106423200. [DOI] [PubMed] [Google Scholar]
- 42.Harrison L, et al. Comparison of the promoters of the mouse (APEX) and human (APE) apurinic endonuclease genes. Mutat. Res. 1997;385:159–172. doi: 10.1016/s0921-8777(97)00053-0. [DOI] [PubMed] [Google Scholar]
- 43.Evans AR, Limp-Foster M, Kelley MR. Going APE over ref-1. Mutat. Res. 2000;461:83–108. doi: 10.1016/s0921-8777(00)00046-x. [DOI] [PubMed] [Google Scholar]
- 44.Izumi T, Henner WD, Mitra S. Negative regulation of the major human AP-endonuclease, a multifunctional protein. Biochemistry. 1996;35:14679–14683. doi: 10.1021/bi961995u. [DOI] [PubMed] [Google Scholar]
- 45.Dantzer F, Luna L, Bjoras M, Seeberg E. Human OGG1 undergoes serine phosphorylation and associates with the nuclear matrix and mitotic chromatin in vivo. Nucleic Acids Res. 2002;30:2349–2357. doi: 10.1093/nar/30.11.2349. [DOI] [PMC free article] [PubMed] [Google Scholar]
- 46.Tini M, et al. Association of CBP/p300 acetylase and thymine DNA glycosylase links DNA repair and transcription. Mol. Cell. 2002;9:265–277. doi: 10.1016/s1097-2765(02)00453-7. [DOI] [PubMed] [Google Scholar]
- 47.Hasan S, et al. Acetylation regulates the DNA end-trimming activity of DNA polymerase β. Mol. Cell. 2002;10:1213–1222. doi: 10.1016/s1097-2765(02)00745-1. [DOI] [PubMed] [Google Scholar]
- 48.Hasan S, et al. Regulation of human flap endonuclease-1 activity by acetylation through the transcriptional coactivator p300. Mol. Cell. 2001;7:1221–1231. doi: 10.1016/s1097-2765(01)00272-6. [DOI] [PubMed] [Google Scholar]
- 49.Yamada NA, Farber RA. Induction of a low level of microsatellite instability by overexpression of DNA polymerase β. Cancer Res. 2002;62:6061–6064. [PubMed] [Google Scholar]
- 50.Mori Y, et al. Instabilotyping: comprehensive identification of frameshift mutations caused by coding region microsatellite instability. Cancer Res. 2001;61:6046–6049. [PubMed] [Google Scholar]
- 51.Rampino N, et al. Somatic frameshift mutations in the BAX gene in colon cancers of the microsatellite mutator phenotype. Science. 1997;275:967–969. doi: 10.1126/science.275.5302.967. [DOI] [PubMed] [Google Scholar]
- 52.Gruber SB, et al. BLM heterozygosity and the risk of colorectal cancer. Science. 2002;297:2013. doi: 10.1126/science.1074399. [DOI] [PubMed] [Google Scholar]
- 53.Goss KH, et al. Enhanced tumor formation in mice heterozygous for Blm mutation. Science. 2002;297:2051–2053. doi: 10.1126/science.1074340. [DOI] [PubMed] [Google Scholar]
- 54.Berdal KG, Johansen RF, Seeberg E. Release of normal bases from intact DNA by a native DNA repair enzyme. EMBO J. 1998;17:363–367. doi: 10.1093/emboj/17.2.363. [DOI] [PMC free article] [PubMed] [Google Scholar]
Associated Data
This section collects any data citations, data availability statements, or supplementary materials included in this article.