

Abstract
Individuals may obtain health information, particularly from the mass media, without engaging in purposeful information searches (called scanning). This study used the Seeking and Scanning Behavior Survey of the General Population (SSBG), a nationally representative survey of adults aged 40–70 years (n =2,489), to validate measures of scanned information exposure about cancer prevention and screening behaviors. Scanned exposure measures concerning specific behaviors (exercise; fruit and vegetable consumption; dieting; and mammogram, prostate-specific antigen (PSA) text, and colonoscopy screening) have good face validity and are convergent across behaviors (mean correlation across six preventive behaviors =0.50, sd =0.09). These measures can be discriminated from measures of general media exposure (mean r =0.23, sd =0.02) and seeking exposure for the same behaviors (mean r =0.25, sd =0.06). Scanned information exposure was associated with weekly volume of newspaper coverage for two of six behaviors, providing additional evidence of nomological validity. Scanned information exposure at the first round of measurement was associated with identical exposure 1 year later (mean r =.41, sd =.04). Scanned exposure measures also were significantly associated with five of the six preventive behaviors. These results provide evidence that scanned information exposure measures are valid indicators of the construct. Researchers might consider their use to capture scanned media influence on cognitions and behaviors.
The amount of cancer-related information appearing in the media has increased sharply in the past few decades (Viswanath, 2005). This proliferation, combined with the rise of health information availability via the Internet (e.g., Eysenbach, Powell, Kuss, & Sa, 2002; Fox & Ranie, 2002), has expanded the potential for widespread exposure to information about cancer. This potential underscores the need to understand how individuals acquire and use this information to make decisions about cancer prevention and screening behaviors. Understanding of the use and impact of cancer information acquisition will require reliable and valid measurement of exposure from a wide range of possible sources. Existing measures are inadequate for the purposes of comparing individuals on exposure to cancer information, particularly information exposure that occurs within routine patterns of interpersonal conversation and media use (Niederdeppe et al., 2007). This study assesses the validity of a new class of measures, scanned information exposure, which may prove useful in assessing the impact of public information on cancer prevention and screening behaviors.
Defining Scanned Information Exposure
Much communication theory (e.g., Brashers, Goldsmith, & Hsieh, 2002; Freimuth, Stein, & Kean, 1989; Johnson, 1997) and research (e.g., Bader & Theofanos, 2003; Johnson, 1997; Koyani & Mathews, 2001; Satterlund, McCaul, & Sandgren, 2003) describes and predicts active efforts to search for health information. Elsewhere, information seeking is conceptualized as “active efforts to obtain specific information outside of the normal patterns of exposure to mediated and interpersonal sources” (Niederdeppe et al., 2007, p. 154). Considerable research has focused on information seeking behaviors among diagnosed cancer patients (e.g., Czaja, Manfredi, & Price, 2003; Freimuth et al., 1989) and on health information obtained from physicians or other health care providers (Katz et al., 2004; Leadbeater, 2005; Nguyen & McPhee, 2003; Talosig-Garcia & Davis, 2005).
Comparatively less attention has been devoted to health information acquisition that occurs outside of active information searches. Nevertheless, a variety of authors note the importance of less-active efforts to obtain relevant information. It has been called “incidental” or “mere exposure” (Bornstein, Leone, Galley, 1987; Case, 2002; Tewksbury, Weaver, & Maddex, 2001), “passive information seeking” (Brashers et al., 2002), “browsing” (Case, 2002), “nonstrategic information acquisition” (Berger, 2002), “passive learning” (Krugman & Hartley, 1970; Zukin & Snyder, 1984), “news reception” (Price & Zaller, 1993), “routine information acquisition” (Griffin, Dunwoody, & Newirth, 1999), “information yielding” (Atkin, 1973), and “scanning” (Niederdeppe et al., 2007; Slater, 1997).
“Information scanning” has been proposed to describe less-purposive receipt of information, defined as “information acquisition that occurs within routine patterns of exposure to mediated and interpersonal sources that can be recalled with a minimal prompt” (Niederdeppe et al., 2007, p. 154). Scanning includes “information that has been encountered in a purely incidental manner, insofar as sufficient attention was paid to generate a minimal memory trace that can be recalled later (Southwell, Barmada, Hornik, & Maklan, 2002). Information scanning also includes information accessed by browsing the news media, paying attention to health content in regular television viewing, or hearing cancer information in the course of routine interactions with friends, family, or medical practitioners” (Niederdeppe et al., 2007).
Information encountered in this manner that is encoded and made accessible for recall at a later time may be referred to as scanned information exposure. This definition is most closely aligned with Griffin et al.’s (1999) concept of routine information acquisition and Atkin’s (1973) discussion of information yielding. It also is inclusive of Brashers et al.’s (2002) process of “passive information seeking” by which people create an environment in which they do not have to seek, but let information flow to them. Individuals may differ in the degree to which they create environments that yield scanned information exposure. The health information people encounter in their information environments will influence the nature and amount of their topic-specific scanned information exposure.
A large body of literature examines how physician–patient communication affects treatment decisions, prevention behaviors, and other outcomes (e.g., Arora, 2003; Bakker, Fitch, Gray, Reed, & Bennett, 2001; Nguyen & McPhee, 2003; Talosig-Garcia & Davis, 2005; Thorne, Hislop, Kuo, & Armstrong, 2006). Most Americans receive a substantial amount of information about cancer prevention and screening from physicians or other health care providers (Niederdeppe et al., 2007). At the same time, information obtained via interpersonal or mediated sources also is consequential for prevention and screening decisions (Niederdeppe et al., 2007; Shim, Kelly, & Hornik, 2006). Far less is known about the amount and process by which individuals obtain and make sense of cancer prevention and screening information obtained from interpersonal and mediated sources.
Operationalizing Scanned Information Exposure
Despite general agreement that scanned information might be influential, there is little consensus on how best to measure scanned exposure or related constructs (Johnson, 1997). Concepts related to scanned information exposure have been measured in a variety of ways across disciplines (Table 1). Each existing strategy has limitations. We sought an approach that would permit assessment of individual differences and that would, on its face, address exposure so that exposure was separable from its consequences.
Table 1.
Measures of passive information acquisition
| Measure | Limitations |
|---|---|
| Approaches used in laboratory settings. In the advertising literature, “incidental” or “mere exposure” has been operationalized as recall of information played over a radio in the background while a person is instructed to focus on a primary task in a laboratory setting (Shapiro, 1999; Shapiro, MacInnis, & Heckler, 1997). | These measures have obvious limitations in their applicability to population-based research, which typically utilizes telephone or internet- based surveys. Furthermore, these measures may underestimate the amount of information retained, as it is not necessarily the case that a person’s attention be focused elsewhere when information is scanned. |
| General media use and attention. An alternative approach involves asking respondents about their patterns of media use (general or genre-specific) or attention paid to topics within specific media. | While habitual patterns of media use certainly influence the likelihood of exposure to information about a particular topic (e.g., Eveland & Dunwoody, 2002; Johnson, 1997; Price & Czilli, 1996; Tewksbury, Weaver, & Maddex, 2001), there is certain to be large variance among individuals in the degree to which information is paid attention to, encoded, and made available for subsequent retrieval. Furthermore, individuals may scan cancer prevention information from non-mediated sources including family and friends. |
| Attention paid to specific topics Attention measures address the limitations of media use items in attempting to specify who pays attention to specific topics within their use of media sources. | Measures of “attention” may imply some element of motivation, involvement or interest on the part of the viewer or listener (Donohew, Lorch, & Palmgreen, 1998; Salmon, 1986). |
| Recall of specific message content. Media campaign evaluations typically measure some form of message recall as an indicator of exposure, with individuals asked whether they recall seeing a particular message or tagline, or even whether they recognize an ad when it is played for them (Southwell, Barmada, Hornik & Maklan, 2002; Niederdeppe, 2005). | This class of measures is too specific to serve as a useful indicator of scanned information exposure about cancer prevention and screening. |
| Variation in the media environment. A final approach has relied on natural variation in the news media environment either by (1) comparing individual’s behaviors before and after a major celebrity news event (e.g., Casey, Allen, Emmers-Sommer, Sahlstein, Degooyer, Winters, et al., 2003; Cram, Fendrick, Inadmoi, Cowen, Carpenter & Vijan, 2003) or (2) examining associations between the aggregate volume of media content (typically news coverage) and aggregate changes in behavior over time (e.g., Fan & Holway, 1994; Pierce & Gilpin, 2001; Stryker, 2003; Yanovitzky & Stryker, 2001). | These studies are limited: exposure is assumed but not measured; exposure scores can not be assigned to individuals, so individual difference analyses are limited; information gleaned from health advertisements, entertainment programming, or interpersonal sources may be missed. |
Measuring exposure through self-report can be done in a variety of ways. Given a focus on natural exposure to the wide range of messages about a topic from many channels (rather than to discrete campaign messages), it would be impractical to identify all such messages and then ask respondents to recall exposure to specific ones. There are important alternatives, however, remaining at increasing levels of specificity: measuring self-reports of exposure to media channels known to carry relevant content; measuring exposure to a broad topic area (e.g., cancer); measuring topic-specific exposure (e.g., mammograms); or measuring belief-specific exposure (e.g., about whether mammograms reduce risk of breast cancer mortality).
We propose measures here that work at the topic level of specificity. A very large body of social psychological theory and research argues that health behavior must be considered at the specific level—people decide whether to obtain a mammogram, not whether they should do something about cancer (e.g., Bandura, 1986; Fishbein & Ajzen, 1975; Rosenstock, 1974). Thus, we propose measures that focus on scanned information exposure about specific preventive and screening behaviors.
Scanned exposure measures may have a time frame for recall and may name relevant sources of exposure of interest. Both of these provide explicit boundaries for expected recall (in the last 30 days versus in the last 12 months), but also they may serve as prompts to remind respondents what they ought to be thinking about (from friends, from the Internet, etc., versus from any sources).
The current proposed question structure reflects extensive qualitative baseline interviewing (see Niederdeppe, 2007) and pretesting of the instrument, as well as prior work in formally comparing exposure measures (Romantan et al., 2008). The evidence presented here about validity, however, comes from a study testing substantive hypotheses; it did not include alternative forms of topic-specific self-report questions. We chose a particular structure and test here how well it worked, without denying that other structures might capture these ideas as well or better.
Criteria for Validating Measures of Scanned Information Exposure
This article focuses on four types of evidence for a new measure of scanned information exposure: face validity, convergent validity, discriminant validity, and nomological validity.
Face Validity
Face validity as assessed here explores whether the item, on its face, measures exposure but not attention; differentiates scanned exposure from exposure that was deliberately sought; and assesses exposure from both mediated and interpersonal sources.
Convergent Validity
If scanned exposure represents a meaningful construct, one might expect individuals who scan information about one cancer topic to scan information about related topics. While there are influences on scanning that are specific to a topic, we also suspect that there is a general habit of scanning that affects many topics:
H1: Scanned information exposure about six specific cancer prevention and screening behaviors will be substantially and positively correlated.
Discriminant Validity
In contrast, validation also requires evidence that measures of scanned exposure are distinct from measures of general media use and from deliberate seeking. One would expect some degree of correspondence between these three constructs (Shim et al., 2006), but the six measures of scanned exposure should be more highly correlated with one another than with general media use or sought exposure measures for the same behaviors:
H2: Scanned information exposure will be positively correlated with general media use, but these associations will be weaker than correlations among the six scanned information exposure topics.
H3: Scanned information exposure will be correlated positively with sought exposure, but the associations between scanned and sought exposure will be weaker than correlations within each of the six scanned information exposure topics.
Finally, based on previous evidence (Niederdeppe et al., 2007), one would expect to find scanned exposure more prevalent than sought exposure:
H4: Scanned information exposure will be more prevalent than sought information exposure across each of the six prevention and screening topics.
Nomological Validity
Nomological validity is achieved if a construct is associated with variables it logically should be (Cronbach & Meehl, 1955; Shadish, Cook, & Campbell, 2002). In this case, this includes variables that are either likely to predict who does more scanning or those that are likely to be affected by scanning.
Media channels are among the most common sources of scanned information about cancer (Niederdeppe et al., 2007). Agenda setting, news reception, and diffusion research suggest that issue awareness tends to be greater during periods of elevated news coverage (e.g., McCombs & Shaw, 1972; Price & Czilli, 1996; Rogers, 2000). As a result, we expect that reports of recent scanned exposure should be more likely to occur during periods of elevated news coverage about cancer topics. This is a particularly important form of validation. All of the other forms of validity relate scanning response to other responses within the questionnaire. This test relates external information about availability of information to questionnaire responses:
H5: Periods of higher volume of news coverage about six cancer prevention and screening behaviors will be positively associated with greater scanned information exposure.
We also expect that people who report scanned exposure about a behavioral topic also would be more likely to engage in the behavior. This may be because the scanning affects behavior or because behavior affects scanning. In previous work, information scanning (measured by amount of attention paid to health topics) was associated with cancer prevention behaviors and cancer screening (Shim et al., 2006). While we recognize that exposure to information about a behavior also could contain negative information about that behavior, for the six behaviors described here, the predominant message is positive (as we report below), thus supporting the expectation for a positive association:
H6: Greater scanned information exposure will be associated with a higher likelihood of engaging in six cancer prevention and screening behaviors.
Finally, we would expect that scanned exposure concerning a specific health behavior would be substantially associated with an identical measure taken 1 year later. We argue that characteristic use of media, interest in a topic, and availability of information about a topic in the media combine to produce recall of scanned exposure concerning that topic. While each of those may vary across a year, we still expect some stability in scanning behavior over time.
H7: Behavior-specific scanning at baseline will be substantially correlated with identically measured scanning exposure 1 year later.
Methods
Participants
Participants were adults ages 40 to 70, for whom screening for the three cancers is most relevant. The sample was a list-assisted, national random-digit-dial (RDD)-recruited panel, selected by an on-line survey company called Knowledge Networks. The sampling frame is the entire U.S. telephone population. The RDD method is used to select households. All household members are enumerated, and one adult is selected for a panel that receives surveys periodically. If respondents did not have a computer or Internet access, both were provided.
A sample was selected from the Knowledge Networks panel. Data collection began in October 2005, with weekly samples of 50 cases collected for 52 weeks (ending in October 2006). Panel recruitment response rates averaged 22% across all months. The survey completion rate was 73%. The final sample was 2,489. Respondents were surveyed again 1 year later. Twenty-seven percent (n =1,812) were lost to follow-up. There were no differences in loss to follow-up by gender, age, or amount of scanning. Those who had a college degree were more likely to complete the follow-up survey than those with less education (81% versus 69%, χ2 =35.27, p <.001). African Americans were less likely (65% versus 74%, χ2 =9.40, p <.01) than other races to complete the survey. Those over age 60 were also more likely than their younger counterparts to complete the survey (79% versus 71%, χ2 =18.58, p <.001).
Measures
Sought and Scanned Information Exposure About Six Behaviors
Respondents were asked about their sought and scanned information exposure about exercise, fruit and vegetable consumption, weight-loss attempts, colonoscopy, the PSA test (men only), and mammography (women only).1 Sought exposure was assessed first, using two questions for each topic. The first question asked the following:
‘Some people are actively looking for information about [colonoscopy], while other people just happen to hear or come across such information. Some people don’t come across information about colonoscopy at all. Thinking about the past 12 months, did you actively look for information about [colonoscopy] from doctors, from other people, or from the media? (Yes, no, don’t recall)’.
Those who answered “yes,” received the second question:
‘Were you actively looking for information about [colonoscopy] in the past 12 months from any of the following sources (check all that apply): doctors or other medical professionals; family, friends or coworkers; television or radio; newspapers, magazines, or newsletters; the Internet; other sources?’
The two seeking questions were combined to form a dichotomous measure of whether a respondent sought information from each source. Those who answered “no” to the first question about having sought any information at all from any source were coded as nonseekers for that source. We omitted sought information exposure from the doctor to focus instead on nonmedical source seeking and scanning. We also omitted information from “other sources” because the responses had no specific referent. The source-specific measures then were summed to form an index (range 0–4) of sought exposure specific to each of the six behaviors.
Questions about scanned exposure were asked immediately after the items about sought exposure for each behavior. Respondents were asked, “Thinking about the past 12 months, did you hear or come across information about [colonoscopy] from doctors, from other people, or from the media even when you were not actively looking for it? (Yes, no, don’t recall).”
Those who answered “yes” received the following: “How many times did you hear or come across information about [colonoscopy] from each of the following sources when you were not actively looking for it?” (answer for each source): (for each of the sources, respondents could answer: not at all, 1–2 times; 3 or more times; I don’t recall). Sources were the same as those listed for seeking.
A third question asked about the recency of scanning: “When was the last time you came across information about [colonoscopy] when you were not actively looking for it?” (in the past 7 days; between 1 week and less than 1 month ago; between 1 month and less than 1 year ago; I don’t recall).
The questions about scanned exposure from the doctor and about “other sources” were omitted. For each source, the number of scanning episodes was coded “0” for not at all, “1” for one to two times, or “2” for three or more times. The four sources then were averaged, resulting in a measure with a range of 0–2. Respondents who reported any scanned information exposure about a behavior also were asked about scanning recency. Respondents were classified as either (1) scanned exposure to information about [colonoscopy] in the past 7 days, or (0) no scanned exposure in the past 7 days. This information was used to create dichotomous measures of past-week scanned exposure for each of the six behaviors.
General Media Use
An index of general media use was created by averaging five items: “In the past 7 days, on how many days did you …[Read a newspaper]; [Watch the national news on television]; [Watch the local news on television]; [Use the Internet for email]; [Use the Internet, other than e-mail]?” The range for the index was 0–7 (m =4.4, sd =1.5).
Newspaper Coverage of Each Prevention and Screening Behavior
News coverage data were collected from the Associated Press, 49 of the top 50 U.S. newspapers (in terms of overall circulation), and broadcast television news transcripts (both morning and evening news programs) using Lexis-Nexis. We used an automated procedure to identify the volume of news coverage that appeared during the survey data collection period using methods described in detail by Stryker, Wray, Hornik, and Yanovitzky (2006).
We began by developing relevance criteria for each behavior. Articles were considered relevant if they mentioned the behavior in the headline, in the lead, or at least four times in at least two paragraphs of the article. Using Stryker and colleagues’ (2006) guidelines, an open search term was developed to capture all stories relevant to the topic. Then, based on the text received using this open search term, a refined (closed) search term was developed. The closed search term was then compared with human coders to determine precision (relevant texts retrieved divided by all texts retrieved) and recall (relevant texts retrieved divided by relevant texts identified by human coders). Each search term had adequate precision (mean recall across terms =0.89, range 0.74 to 0.98) and recall (mean recall across terms =0.84, range 0.77 to 0.94) to capture the frequency of stories about each behavior over the 1-year period of data collection.
The validated search terms (Niederdeppe, 2006) were used to identify relevant stories about each of six behaviors that appeared in news sources between October 21, 2005, and October 25, 2006. The relative volume of coverage about each topic generally was consistent across news sources, with lifestyle behaviors generating greater coverage than screening behaviors. Exercise generated the greatest coverage volume (212 TV segments, 5,115 newspaper stories, 95 AP stories) followed by dieting to lose weight (201 TV, 2,997 newspaper, 144 AP) and fruit and vegetable consumption (143 TV, 2,741 newspaper, 104 AP). Screening behaviors generated less coverage. Mammography (12 TV, 344 newspaper, 16 AP) generated more coverage than colonoscopy (7 TV, 123 newspaper, 9 AP), which in turn generated more coverage than the PSA test (3 TV, 66 newspaper, 5 AP) over the observation period.
We used these data to create weekly news coverage volume measures for each behavior. We standardized the weekly volume of news coverage from each news source by setting the mean to zero and the standard deviation to one. We then summed the standardized weekly volume measures for each of the three news sources into a single, additive index for each behavior. The resulting six variables, termed “overall weekly news coverage volume,” thus capture weekly variation in the volume of news coverage about each behavior. The mean value for overall weekly news coverage volume for each behavior was zero, while standard deviations varied by behavior (mammography news coverage volume sd =2.2; colonoscopy sd =1.8; PSA test sd =2.1; dieting sd =2.2; exercise sd =1.8; fruit and vegetable sd =2.6).
Behaviors
The survey asked about colonoscopy, PSA, mammogram, fruit and vegetable -consumption, dieting for weight loss, and exercise. These measures are detailed in Appendix A.
Analytic Approach
Face Validity
Face validity was determined through careful deliberation over a number of months among members of our research team, consisting of experts in fields including psychology, public health, oncology, general medicine, and health communication.
Convergent and Discriminant Validity
Convergent and discriminant validity often are evaluated using the multitrait-multimethod matrix, which involves creating a table of correlations for measures of multiple concepts measured via multiple methods (Campbell & Fiske, 1959). Because we did not have the luxury of using multiple methods to collect the data in this study, we employed a variation on this approach, a multitrait matrix, with each construct measured by only one method (Trochim, 2000).
We computed correlations of each topic-specific scanning measure with the following: (1) the scanning measures for the other health topics; (2) each seeking measure; and (3) general media use. We also computed correlations for each scanning measure about a specific behavior (i.e., colonoscopy) with seeking measures for the same behavior. We averaged correlations across each of the six behaviors. Confidence intervals were computed using the formula: CI =average correlation + or −SE* (.975 quantile of the t distribution with n−1 degrees of freedom). This approach allowed us to assess the overall correspondence between scanned exposure measures across behaviors (testing H1) and determine whether the mean correlation for each of the scanned exposure measures with other scanned exposure measures was significantly higher than the mean correlation for scanned exposure items with general media use (testing H2) or sought exposure for each behavior (testing H3). Standard errors and confidence intervals were used to determine whether the mean correlations were significantly different from one another (for the full matrix of correlations, see Appendix B).
We used Wilcoxon nonparametric tests to assess whether scanned information exposure was more prevalent than sought information exposure for each of the six behaviors (testing H4). Logistic regression was used to assess whether weekly news coverage volume predicted past-week scanned information exposure for each of the six prevention and screening behaviors (testing H5). We also used logistic regression to assess whether the behavior-specific measures of scanned exposure were significant predictors of behaviors (testing H7).2,3 Test–retest association was estimated from Pearson correlations (testing H8).
Results
Participant Characteristics
The mean age of the sample was 53 years. Fifty-one percent were female and 87.5% had at least a high school education. Seventy-four percent were White, non-Hispanic; 11% Black, non-Hispanic; 3% other; and 7% Hispanic. Fifty-nine percent were married.
Prevalence of Scanned Information Exposure About Six Preventive and Screening Behaviors
Ninety-one percent reported having scanned from at least one source for at least one topic. The mean number of source-specific instances of scanning was 9.07 (sd =5.66) out of 20. The mean number of sources out of a possible four used for scanning ranged from 0.80 (sd =1.24) for the PSA test to 2.30 (sd =1.53) for exercise (Table 2).
Table 2.
Mean number of sources for scanned information exposure by behavior and overall
| Mean | Standard deviation | 95% CI | n of observations | |
|---|---|---|---|---|
| Scanned colonoscopy information | 1.29 | 1.36 | 1.24–1.34 | 2,434 |
| Scanned mammography information | 1.78 | 1.43 | 1.70–1.86 | 1,243 |
| Scanned PSA test information | .80 | 1.24 | .73–.87 | 1,187 |
| Scanned exercise information | 2.30 | 1.53 | 2.24–2.36 | 2,446 |
| Scanned fruit and vegetable information | 2.04 | 1.55 | 1.98–2.10 | 2,440 |
| Scanned diet information | 2.21 | 1.59 | 2.15–2.27 | 2,425 |
| Overall scanned exposure | 9.07 | 5.66 | 8.84–9.30 | 2,276 |
Note. Each behavior-specific scanned information exposure measure has a range of 0–4. The summary measure has a range of 0–20.
Convergent and Discriminant Validity
Hypothesis 1 (H1) was supported. The mean correlation between the six prevention and screening behaviors (intrascan correlations) was strong (mean r =0.50, 95% CI 0.45–0.54) and significant (all p <0.001; see Table 3). Hypothesis 2 (H2) also was supported. The mean correlation between scanned information exposure measures and general media use was positive (mean r =0.23, 95% CI 0.22–0.25) and significant (all correlations p < 0.05), but the mean intrascan correlation was significantly higher (mean r =0.50 vs. mean r =0.23, no CI overlap).
Table 3.
Mean correlations for scanned information exposure, sought information exposure, and general media use
| Comparison | Mean correlation (r) | Standard deviation of r | 95% CI | n of correlations |
|---|---|---|---|---|
| Intra-scan correlationsa | 0.50 | 0.09 | .45–.55 | 14 |
| Scanned exposure with general media useb | 0.23 | 0.02 | .21–.25 | 6 |
| Scanned exposure with sought exposure across all behaviorsc | 0.25 | 0.06 | .23–.28 | 28 |
| Intra-behavior correlationsd | 0.39 | 0.04 | .34–.44 | 6 |
Note. Sample ns range from 1,159 for PSA-related scanning to 2,422 for variables involving both males and females.
Intra-scan correlations describe pair-wise correlations between scanned exposure measures (e.g., scanned exposure about mammography with scanned exposure about colonoscopy; scanned exposure about colonoscopy with scanned exposure about dieting to lose weight).
Scanned exposure with general media use correlations describe those between each scanned exposure measure and the general media use index.
Scanned exposure with sought exposure across all behaviors refers to correlations between each scanned exposure measure and each sought exposure measure e.g., (scanned exposure about mammography with sought exposure about colonoscopy, etc.).
Intra-behavior correlations describe pair-wise correlations between scanned exposure and sought exposure about the same behavior (e.g., scanned exposure about mammography with sought exposure about mammography, etc.).
Hypothesis 3 (H3) received general support. The mean correlation between scanned information exposure and sought information exposure measures was positive (mean r =0.25, 95% CI 0.23–0.27) and significant (all correlations p < 0.05), but the mean intrascan correlation was significantly higher (mean r =0.50 vs. mean r =0.25, no confidence interval overlap). Evidence for discrimination was significant also when comparing intrascan correlations with intrabehavior correlations (e.g., scanned exposure for mammography with sought exposure for mammography). The level of discrimination between measures was less than for the sought exposure comparison. The mean intrascan correlation (r =0.50) was higher than the mean intrabehavior correlation (mean r =0.39, 95% CI 0.36–0.43, no CI overlap).
Hypothesis 4 (H4) was supported. The overall frequency of scanning was much larger than seeking, with 91% reporting scanned exposure from any of the six behaviors compared with 66% with sought exposure about any of the six behaviors (Wilcoxon nonparametric test =−21.24, p <.001). The pattern was consistent across each behavior, with scanned exposure occurring more frequently than sought exposure (colonoscopy =56% scanned, 18% sought; PSA =36% scanned, 11% sought; mammogram =70% scanned, 22% sought; diet =72% scanned, 44% sought; fruit and vegetable consumption =70% scanned, 34% sought; exercise =75% scanned, 44% sought). Wilcoxon nonparametric tests confirm that all differences were significant at the p <.001 level (z statistics range from −15.41 to −27.54).
Nomological Validity
Hypothesis 5 (H5) received partial support. Overall, weekly news coverage volume about mammography (B =0.09, SE =0.03, p <0.01) and colonoscopy (B =0.13, SE =0.04, p <0.001) were significantly associated with having reported past-week scanned information exposure about these tests. For illustrative purposes, model parameter estimates were used to predict scanned information exposure by mammography (Figure 1) and colonoscopy news coverage (Figure 2). Associations between news coverage volume and scanned information exposure about the PSA test (B =0.07, SE =0.06, p >0.20), dieting to lose weight (B =0.02, SE =0.02, p >0.20), and fruit and vegetable consumption (B =0.02, SE =0.02, p >0.20) were in the right direction but not statistically significant. There was no correspondence between news coverage and scanned exposure about exercise (B=0.00, SE =0.02, p >0.20).
Figure 1.
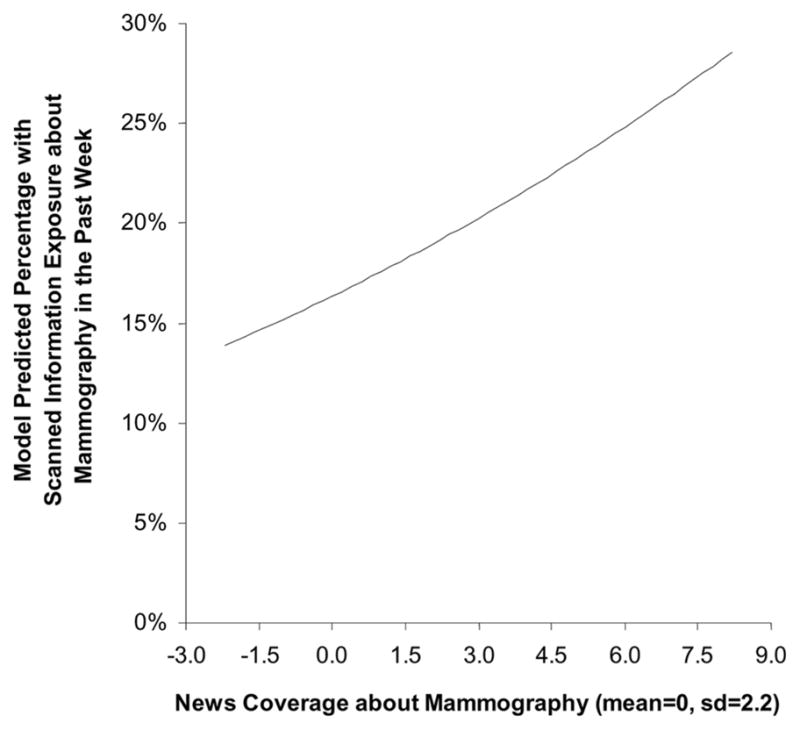
Model predicted relationship between weekly mammography news coverage and weekly scanned information exposure about mammography (n =1,249).
Figure 2.
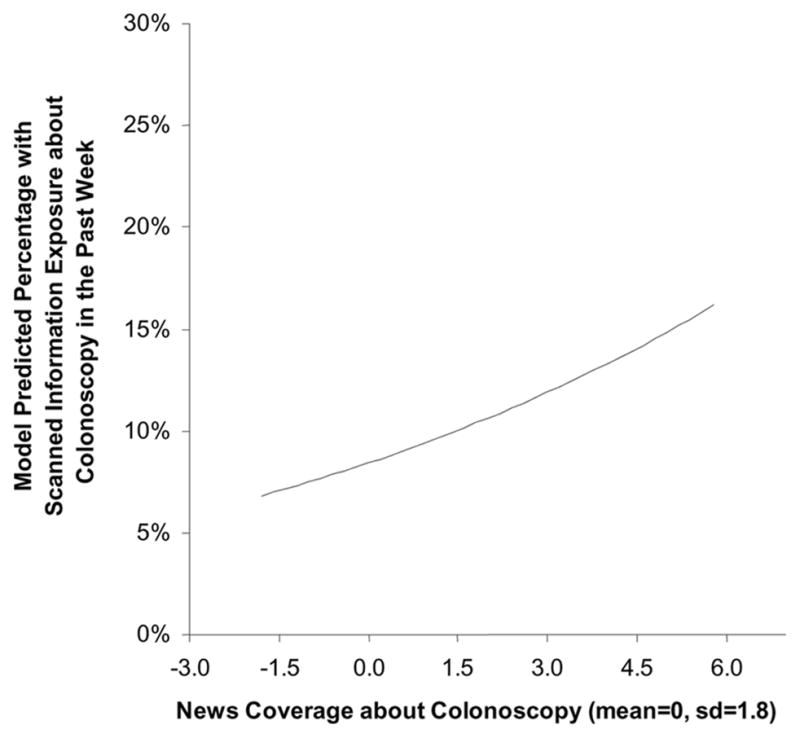
Model predicted relationship between weekly colonoscopy news coverage and weekly scanned information exposure about colonoscopy (n =1,249).
Hypothesis 6 (H6) was largely supported. Scanned exposure was significantly associated with having had a colonoscopy, having had a PSA test, exercising, fruit and vegetable consumption and diet, but not mammogram (see Table 4). The assumption underlying this hypothesis is that the predominant frame for news coverage of these behaviors was positive. We sampled approximately 600 articles following the search procedures outlined above, 100 per behavior. Three hundred twenty of these were both relevant and offered either positive or negative or mixed assessments of the behaviors. Of these, 77% included positive or mixed assessments and 23% negative or mixed assessments. The percentage of positive assessments ranged from 58% to 96% across the six behaviors. We conclude that the predominant frame, when a positive or negative assessment was present, was positive.
Table 4.
Results of logistic regression models predicting behaviors from scanned information exposure specific to that behavior
| Behavior | Odds ratio | 95% CI | B | Cox and Snell R2 | N |
|---|---|---|---|---|---|
| Colonoscopy | 1.69 | 1.37–2.08 | 0.52*** | 0.02 | 1,452 |
| Mammography | 1.18 | .96–1.47 | .17 | 0.00 | 1,237 |
| PSA Test | 2.80 | 2.11–3.72 | 1.03*** | .05 | 1,178 |
| Exercise | 1.37 | 1.22–1.55 | .32*** | .01 | 2,436 |
| Fruits and Vegetables | 2.10 | 1.83–2.40 | .74*** | .05 | 2,412 |
| Dieting | 1.59 | 1.38–1.84 | .47*** | 0.02 | 1,644 |
Note. The colonoscopy analysis is restricted to individuals over the age of 49 and the diet analysis is restricted to those with a BMI of 25 or greater. Mammogram and PSA analyses are each restricted to the relevant gender.
Hypothesis 7 (H7) was supported. Respondents provided moderately consistent responses across the two measurement rounds. The test–retest Pearson correlation taken 1 year apart averaged .42 (sd =.04). The correlations were .35, .44, .43, .38, .44, and .46 for colonoscopy, PSA, mammogram, exercise, fruit and vegetable-consumption and diet scanning, respectively.
Discussion
This article argues that scanned information exposure is a useful concept, offers guidance about its measurement, and provides evidence that these measures are valid indicators of the construct. The proposed measures have good convergent validity–scanners about one behavior also tend to scan about others (supporting H1)–and discriminant validity, distinguishing scanning from both general media use (supporting H2) and seeking exposure in terms of mean correlations and relative frequency (supporting H3, H4). The measures also appear to have reasonable nomological validity, being associated with the volume of media coverage for at least some behaviors (partially supporting H5) and five out of six of the relevant behaviors (partially supporting H6) and showing substantial test–retest association over 1 year (supporting H7). Other evidence establishing scanned exposure as a construct discrete from sought exposure includes findings that it occurs more prevalently. For all of the six behaviors, scanning occurred more often than seeking. This is logical, as scanning does not require the same level of motivation or purpose as does seeking and can occur in the normal course of media use.
Explanations for Partially Supported Hypotheses
Overall weekly news coverage volume was associated with scanned information exposure about only mammography and colonoscopy. Tests of H5 may have been constrained by a lack of weekly variation in news coverage during the observation period. Major spikes in coverage, catalyzed by news events, may be necessary to ensure sufficient weekly variation in coverage. There are two major news events that were associated with large spikes in coverage: Breast Cancer Awareness Month (October) and Colon Cancer Awareness Month (March). Mammography coverage was much higher in October relative to other months (t test p <0.001), while colonoscopy coverage was much higher in March (t test p <0.001). Since variation in the independent variable is a necessary condition for detecting associations with another variable, a lack of weekly variation in news coverage about the other behaviors may have constrained our ability to detect a significant association.
Scanning information was related to having engaged in five of the six behaviors but not mammography. The large majority of women had engaged in this behavior within the last 2 years (71%). This is a behavior that is widely accepted and has good compliance, compared with the others. It may be that the behavior is so institutionalized that scanned information exposure does not have much influence.
Limitations
The scanned exposure measures were limited in quantity. Due to time and space constraints on the survey we were able to ask only about the three screening behaviors (two for males and two for females) and three prevention activities. In addition, we were limited in the number of sources about which we could ask. Family and friends were the only interpersonal source besides the doctor, and they were included in the same question. Future analyses might explore differences between scanning from family members versus friends, as well as others who may be less closely tied to the respondent, such as coworkers or acquaintances.
Recall is always an issue when dealing with self-report of any type of information exposure. Logically, it may be easier to remember a topic about which you actively engaged in a search than one about which you came across information incidentally. The active search was likely predicated by some occurrence or interest in the topic that led to the need or desire for additional information. Such an occurrence may enhance recall.
Conclusions
Despite these limitations, scanned information exposure measures seem to be useful in capturing a form of information acquisition that occurs within the course of daily activity.
Establishing valid measures of scanning is important because, as we found here and other researchers have found previously, this less passive mode of information gathering is much more prevalent than seeking (Niederdeppe et al., 2007; Shim, Kelly, & Hornik, 2006). As a result, it may have consequential—if not a more significant—influence on health behavior, including behavior related to cancer prevention and screening. If health professionals and public health practitioners are to understand what types of information the public is using to make decisions about their health, they need to have the complete picture of information sources and topics that are used. This should include both sources that are purposefully sought after and those encountered in a more incidental fashion. Validating measures of scanning ensures that researchers can include both types of information gathering in future study.
Acknowledgments
This publication was made possible by grant number 5P50CA095856 from the National Cancer Institute. (Center of Excellence in Cancer Communication Research [CECCR], University of Pennsylvania). Its contents are solely the responsibility of the authors and do not necessarily represent the official views of the National Cancer Institute. This publication was also made possible by support from the Robert Wood Johnson Health and Society Scholars Program. The authors also thank Kyung Lee, Anca Romantan, J. Sanford Schwartz, A. Susana Ramírez, Rebekah Nagler, Katrina Armstrong, Angela DeMichele, Martin Fishbein, Dominick Frosch, Stacy Gray, Shawnika Hull, Lela Jacobsohn, Annice Kim, Giang Nguyen, Minsun Shim, Aaron Smith-McLallen, Robin Stevens, and Norman Wong for contributions to the research.
Appendix A. Behavior Measures
Colonoscopy, PSA and Mammogram
Each screening behavior was assessed using a series of yes or no questions, as follows: “Have you ever had a [colonoscopy] (all respondents); [PSA test] (men only); [mammogram] (women only)?” Only respondents who had previously indicated they had heard of colonoscopy and PSA were asked the respective yes or no questions. Respondents who said yes were asked, “When did you have your most recent [colonoscopy; PSA test; mammogram] to check for [colon; prostate; breast] cancer?” Response categories for colonoscopy included, “a year ago or less; more than 1 but not more than 5 years ago; more than 5 but not more than 10 years ago; over 10 years ago” Response categories for PSA and mammography included, “a year ago or less; more than 1 but not more than 2 years ago; more than 2 but not more than 5 years ago; over 5 years ago.”
Questions about each screening test were combined into a single dichotomous measure indicating whether or not an individual had the test within the recommended period of time (colonoscopy within the past 10 years, USPSTF, 2002b; PSA test within the past 2 years, AUA, 2000; Smith, Cokkinides, & Eyre, 2004; mammography within the past two years, USPSTF, 2002a). Seventy-one percent of women answered that they had received a mammogram in the past year; 38% of men reported having had a PSA in the last two years, and 38% of men and women had received a colonoscopy in the last 10 years.
Diet for weight loss
Respondents were asked, “During the past 30 days, have you controlled your diet to lose weight?” (yes, no). Thirty-eight percent of respondents had attempted weight loss in the last 30 days.
Exercise
Respondents were asked, “During an average week are you able to exercise at least once per week?” (yes, no). Those who said yes were asked, “During an average week, how many days do you exercise?” Fifty-two percent of the sample exercised three or more days during an average week.
Fruit and vegetable consumption
Respondents were asked, in separate questions, “In the past week, on average, how many servings of fruit did you eat or drink per day? Please include 100% fruit juice, and fresh, frozen or canned fruits” and “In the past week, on average, how many servings of vegetables did you eat or drink per day, not counting potatoes? Please include green salad, 100% vegetable juice, and fresh, frozen or canned vegetables.” Response categories for both items included, “less than one serving per day; one serving per day; two servings per day; three servings per day; four servings per day; and five or more servings per day. One-third of respondents ate five or more servings of fruits and vegetables per day in the past week.
Appendix B. Matrix of Correlations Between Seeking, Scanning and General Media Use
| Seek | Scan | ||||||||||||
|---|---|---|---|---|---|---|---|---|---|---|---|---|---|
| Colon | Mamm | PSA | Ex | FV | Diet | Colon | Mamm | PSA | Ex | FV | Diet | ||
| Seek | Colon | 1 | |||||||||||
| Mamm | 0.30 | 1 | |||||||||||
| PSA | 0.38 | NA | 1 | ||||||||||
| Ex | 0.24 | 0.21 | 0.25 | 1 | |||||||||
| FV | 0.25 | 0.30 | 0.33 | 0.47 | 1 | ||||||||
| Diet | 0.25 | 0.27 | 0.32 | 0.48 | 0.51 | 1 | |||||||
| Scan | Colon | 0.36 | 0.24 | 0.19 | 0.18 | 0.20 | 0.18 | 1 | |||||
| Mamm | 0.26 | 0.33 | NA | 0.20 | 0.20 | 0.18 | 0.53 | 1 | |||||
| PSA | 0.21 | NA | 0.43 | 0.17 | 0.21 | 0.21 | 0.48 | NA | 1 | ||||
| Ex | 0.30 | 0.31 | 0.28 | 0.40 | 0.34 | 0.38 | 0.43 | 0.53 | 0.38 | 1 | |||
| Fv | 0.28 | 0.34 | 0.31 | 0.32 | 0.47 | 0.34 | 0.44 | 0.54 | 0.45 | 0.62 | 1 | ||
| Diet | 0.25 | 0.31 | 0.21 | 0.31 | 0.37 | 0.44 | 0.40 | 0.50 | 0.39 | 0.62 | 0.64 | 1 | |
| General media | NA | NA | NA | NA | NA | NA | 0.23 | 0.23 | 0.26 | 0.22 | 0.20 | 0.234 | |
All correlations are significant at p<.001
![]()
Footnotes
For colonoscopy and PSA testing, respondents were first asked whether they had heard of the test. Respondents who had never heard of the test skipped to the next prevention or screening behavior. Pretest interviews revealed that nearly all females within the sampled age range had heard of the mammogram. As a result, female respondents were not asked whether they had heard of the mammogram, but were provided with a brief description of the procedure.
One cannot measure the ability of scanned information exposure to predict other variables in its true sense with cross-sectional data, as predictive validity is defined as “the ability of a measure to predict scores on a criterion measured in the future” (Schutt, 2004, p. 114). Since we are not attempting to make causal claims, but merely to show that the scanning measures are associated with measures we would expect them to be, cross-sectional associations are sufficient in this case.
Analyses for colonoscopy were restricted to those aged 50 and over, for whom the behavior is recommended (USPSTF, 2002; n =1,505 or 60% of the sample). The USPSTF task force does not currently make any recommendation that men of a specific age get PSA tests. As there was no specific recommendation at the time, we decided to include all men (40 and over) in the analyses (n =1,216 or 49%). All sampled females were included in analyses regarding mammography (n =1,273 or 51%). Analyses for diet behavior were restricted to those with a body mass index (BMI) of 25 or higher, in accordance with the National Institutes of Health (NIH); and National Heart, Lung, and Blood Institute’s (NHLBI’s) definition of overweight (NIH’s NHLBI, 1998; n =1674 or 67% of the sample).
Contributor Information
BRIDGET J. KELLY, RTI International, Washington, DC, USA
JEFF NIEDERDEPPE, Department of Communication, Cornell University, Ithaca, New York, USA.
ROBERT C. HORNIK, RTI International, Washington, DC, USA
References
- American Urological Association. Prostate-specific antigen best practice policy. Oncology. 2000;14:267–286. Retrieved May 5, 2005, from. http://www.cancernetwork.com/journals/oncology/o0002e.htm. [PubMed]
- Arora NK. Interacting with cancer patients: The significance of physicians’ communication behavior. Social Science & Medicine. 2003;57:791–806. doi: 10.1016/s0277-9536(02)00449-5. [DOI] [PubMed] [Google Scholar]
- Atkin CK. Instrumental utilities und information seeking. In: Clarke P, editor. New models for communication research. Beverly Hills, CA: Sage; 1973. pp. 205–242. [Google Scholar]
- Bader JL, Theofanos MF. Searching for cancer information on the internet: Analyzing natural language search queries. Journal of Medicine and Internet Research. 2003;5:e31. doi: 10.2196/jmir.5.4.e31. [DOI] [PMC free article] [PubMed] [Google Scholar]
- Bakker DA, Fitch MI, Gray R, Reed E, Bennett J. Patient-health care provider communication during chemotherapy treatment: The perspectives of women with breast cancer. Patient Education and Counseling. 2001;43(1):61–71. doi: 10.1016/s0738-3991(00)00147-6. [DOI] [PubMed] [Google Scholar]
- Bandura A. Social foundations of thought and action: A social cognitive theory. Englewood Cliffs, NJ: Prentice-Hall; 1986. [Google Scholar]
- Berger CR. Strategic and nonstrategic information acquisition. Human Communication Research. 2002;28:287–297. [Google Scholar]
- Bornstein RF, Leone DR, Galley DJ. The generalizability of subliminal mere exposure effects: Influence of stimuli perceived without awareness on social behavior. Journal of Personality and Social Psychology. 1987;53:1070–1079. [Google Scholar]
- Brashers DE, Goldsmith DJ, Hsieh E. Information seeking and avoiding in health contexts. Human Communication Research. 2002;28:258–272. [Google Scholar]
- Campbell DT, Fiske D. Convergent and discriminant validation by the multitrait-multimethod matrix. Psychological Bulletin. 1959;56:81–105. [PubMed] [Google Scholar]
- Case DO. Looking for information: A survey of research on information seeking, needs, and behavior. San Diego, CA: Academic Press; 2002. [Google Scholar]
- Casey MK, Allen M, Emmers-Sommer T, Sahlstein E, Degooyer D, Winters AM, et al. When a celebrity contracts a disease: The example of Earvin “Magic” Johnson’s announcement that he was HIV positive. Journal of Health Communication. 2003;8:249–265. doi: 10.1080/10810730305682. [DOI] [PubMed] [Google Scholar]
- Cooper CP, Williams KN, Carey KA, Fowler CS, Frank M, Gelb CA. Advertising campaign on a major internet search engine to promote colorectal cancer screening. British Medical Journal. 2004;328:1179–1180. doi: 10.1136/bmj.328.7449.1179. [DOI] [PMC free article] [PubMed] [Google Scholar]
- Cram P, Fendrick MA, Inadmoi J, Cowen ME, Carpenter D, Vijan S. The impact of a celebrity promotional campaign on the use of colon cancer screening. Archives of Internal Medicine. 2003;163:1601–1605. doi: 10.1001/archinte.163.13.1601. [DOI] [PubMed] [Google Scholar]
- Cronbach LJ, Meehl PE. Construct validity in psychological tests. Psychological Bulletin. 1955;52:281–302. doi: 10.1037/h0040957. [DOI] [PubMed] [Google Scholar]
- Czaja R, Manfredi C, Price J. The determinants and consequences of information seeking among cancer patients. Journal of Health Communication. 2003;8:529–562. doi: 10.1080/716100418. [DOI] [PubMed] [Google Scholar]
- Donohew L, Lorch EP, Palmgreen P. Applications of a theoretic model of information exposure to health interventions. Human Communication Research. 1998;24:454–468. doi: 10.1111/j.1468-2958.1998.tb00425.x. [DOI] [PubMed] [Google Scholar]
- Eveland WP, Dunwoody S. An investigation of elaboration and selective scanning as mediators of learning from the web versus print. Journal of Broadcasting and Electronic Media. 2002;46:34–53. [Google Scholar]
- Eysenbach G, Powell J, Kuss O, Sa ER. Empirical studies assessing the quality of health information for consumers on the world wide web: A systematic review. Journal of the American Medical Association. 2002;287:2691–2700. doi: 10.1001/jama.287.20.2691. [DOI] [PubMed] [Google Scholar]
- Fan DP, Holway WB. Media coverage of cocaine and its impact on usage patterns. International Journal of Public Opinion Research. 1994;6:139–162. [Google Scholar]
- Fishbein M, Ajzen I. Belief, attitude, intention, and behavior. Reading, MA: Addison Wesley; 1975. [Google Scholar]
- Fox S, Ranie L. Vital decisions: How internet users decide what information to trust when they or their loved ones are at risk. Washington, DC: Pew Internet and American Life Project; 2002. [Google Scholar]
- Freimuth VS, Stein JA, Kean TJ. Searching for health information: The cancer information service model. Philadelphia: University of Pennsylvania Press; 1989. [Google Scholar]
- Griffin RJ, Dunwoody S, Neuwirth K. Proposed model of the relationship of risk information seeking and processing to the development of preventive behaviors. Environmental Research. 1999;80:S230–S245. doi: 10.1006/enrs.1998.3940. [DOI] [PubMed] [Google Scholar]
- Johnson JD. Cancer-related information seeking. Cresskill, NJ: Hampton Press; 1997. [Google Scholar]
- Katz ML, James AS, Pignone MP, Hudson MA, Jackson E, Oates V, et al. Colorectal cancer screening among African American church members: A qualitative and quantitative study of patient-provider communication. BMC Public Health. 2004;4:62. doi: 10.1186/1471-2458-4-62. [DOI] [PMC free article] [PubMed] [Google Scholar]
- Koyani S, Mathews J. Cutting to the chase: Delivering usable and useful on-line health information web sites through usability engineering. Health Promotion Practice. 2001;2:130–132. [Google Scholar]
- Krugman HE, Hartley EL. Passive learning from television. The Public Opinion Quarterly. 1970;34(2):184–190. [Google Scholar]
- Leadbeater M. A nurse-led e-mail service for breast cancer information. Nursing Times. 2005;101:36–38. [PubMed] [Google Scholar]
- McCombs ME, Shaw DL. The agenda-setting function of mass media. Public Opinion Quarterly. 1972;36:176–187. [Google Scholar]
- National Institutes of Health (NIH), National Heart, Lung and Blood Institute (NHLBI). HHS, Public Health Service (PHS) Clinical guidelines on the identification, evaluation, and treatment of overweight and obesity in adults: The Evidence Report. Obesity Research. 1998;6(Suppl 2):51S–209S. [PubMed] [Google Scholar]
- Nguyen TT, McPhee SJ. Patient-provider communication in cancer screening. Journal of General Internal Medicine. 2003;18:402–403. doi: 10.1046/j.1525-1497.2003.30346.x. [DOI] [PMC free article] [PubMed] [Google Scholar]
- Niederdeppe J. Assessing the validity of confirmed ad recall measures for public health communication campaigns. Journal of Health Communication. 2005;10:635–650. doi: 10.1080/10810730500267662. [DOI] [PubMed] [Google Scholar]
- Niederdeppe J. Doctoral dissertation. University of Pennsylvania; 2006. Contingent effects of cancer news coverage on sought and scanned information exposure. 2006, Digital Dissertations. [Google Scholar]
- Niederdeppe J, Hornik R, Kelly B, Frosch D, Romantan A, Stevens R, Barg F, Weiner J, Schwarz S. Examining the dimensions of cancer-related information scanning and seeking behavior. Health Communication. 2007;22:153–167. doi: 10.1080/10410230701454189. [DOI] [PubMed] [Google Scholar]
- Pierce JP, Gilpin EA. News media coverage of smoking and health is associated with changes in population rates of smoking cessation but not initiation. Tobacco Control. 2001;10:145–153. doi: 10.1136/tc.10.2.145. [DOI] [PMC free article] [PubMed] [Google Scholar]
- Price V, Czilli EJ. Modeling patterns of news recognition and recall. Journal of Communication. 1996;46(2):55–78. [Google Scholar]
- Price V, Zaller J. Who gets the news? alternative measures of news reception and their implications for research. The Public Opinion Quarterly. 1993;57:133–164. [Google Scholar]
- Rogers EM. Reflections on news event diffusion research. Journalism and Mass Communication Quarterly. 2000;77:561–576. [Google Scholar]
- Romantan A, Hornik R, Price V, Cappella J, Weiner J, Viswanath K. A comparative analysis of the performance of alternative and complementary measures of incidental exposure. Communication Methods and Measures. 2008;2:80–99. [Google Scholar]
- Rosenstock IM. Historical origins of health belief model. Health Education Monographs. 1974;2:328–335. doi: 10.1177/109019817800600406. [DOI] [PubMed] [Google Scholar]
- Salmon CT. Message discrimination and the information environment. Communication Research. 1986;13:363–372. [Google Scholar]
- Satterland MJ, McCaul KD, Sandgren AK. Information gathering over time by breast cancer patients. Journal of Medical Internet Research. 2003;5:e15. doi: 10.2196/jmir.5.3.e15. [DOI] [PMC free article] [PubMed] [Google Scholar]
- Schutt RK. Investigating the social world: The process and practice of research. 4. Thousand Oaks, CA: Pine Forge Press; 2004. [Google Scholar]
- Shadish WR, Cook TD, Campbell DT. Experimental and quasi-experimental designs for generalized causal inference. Boston: Houghton Mifflin Company; 2002. [Google Scholar]
- Shapiro S. When an ad’s influence is beyond our conscious control: Perceptual and conceptual fluency effects caused by incidental ad exposure. Journal of Consumer Research. 1999;26:16–57. [Google Scholar]
- Shapiro S, MacInnis DJ, Heckler SE. The effects of incidental ad exposure on the formation of consideration sets. Journal of Consumer Research. 1997;24:94–104. [Google Scholar]
- Shim M, Kelly B, Hornik R. Cancer-related seeking and scanning behavior is associated with cancer knowledge, lifestyle and screening behaviors. Journal of Health Communication. 2006;11(Suppl 2):157–172. doi: 10.1080/10810730600637475. [DOI] [PubMed] [Google Scholar]
- Slater MD. Persuasion processes across receiver goals and message genres. Communication Theory. 1997;7:125–148. [Google Scholar]
- Smith RA, Cokkinides V, Eyre HJ. American Cancer Society guidelines for the early detection of cancer, 2004. CA: A Cancer Journal for Clinicians. 2004;54:41–52. doi: 10.3322/canjclin.54.1.41. [DOI] [PubMed] [Google Scholar]
- Southwell BG, Barmada CH, Hornik RC, Maklan DM. Can we measure encoded exposure? Evidence from a national campaign. Journal of Health Communication. 2002;7:445–453. doi: 10.1080/10810730290001800. [DOI] [PMC free article] [PubMed] [Google Scholar]
- Stryker JE. Cancer Control Research Grant Number 5R21CA098437. Bethesda, MD: National Cancer Institute; 2003. Mainstream and ethnic/minority news coverage of cancer. [Google Scholar]
- Stryker JE, Wray R, Hornik RC, Yanovitzky I. Validation of database search terms for content analysis: The case of cancer news coverage. Journalism and Mass Communication Quarterly. 2006;83:413–430. [Google Scholar]
- Talosig-Garcia M, Davis SW. Information-seeking behavior of minority breast cancer patients: An exploratory study. Journal of Health Communication. 2005;10:53–64. doi: 10.1080/10810730500263638. [DOI] [PubMed] [Google Scholar]
- Tewksbury D, Weaver AJ, Maddex BD. Accidentally informed: Incidental news exposure on the world wide web. Journalism and Mass Communication Quarterly. 2001;78:533. [Google Scholar]
- Thorne S, Hislop TG, Kuo M, Armstrong EA. Hope and probability: Patient perspectives of the meaning of numerical information in cancer communication. Qualitative Health Research. 2006;16:318–336. doi: 10.1177/1049732305285341. [DOI] [PubMed] [Google Scholar]
- Trochim W. The research methods knowledge base. Cincinnati: Atomic Dog Publishing; 2000. [Google Scholar]
- U.S. Preventive Services Task Force. Screening for breast cancer: Recommendations and rationale. Rockville, MD: Agency for Healthcare Research and Quality; 2002. Feb, Retrieved July 12, 2005 from http://www.ahrq.gov/clinic/uspstf/uspsbrca.htm. [Google Scholar]
- U.S. Preventive Services Task Force. Screening for colorectal cancer:Recommendations and rationale. Rockville, MD: Agency for Healthcare Research and Quality; 2002. Jul, Retrieved May 5, 2005, from http://www.ahrq.gov/clinic/3rduspstf/colorectal/colorr.htm. [Google Scholar]
- Viswanath K. The communications revolution and cancer control. Nature. 2005;5:828–835. doi: 10.1038/nrc1718. [DOI] [PubMed] [Google Scholar]
- Yanovitzky I, Stryker J. Mass media, social norms, and health promotion efforts: A longitudinal study of media effects on youth binge drinking. Communication Research. 2001;28:208–239. [Google Scholar]
- Zukin C, Snyder R. Passive learning: When the media environment is the message. The Public Opinion Quarterly. 1984;48(3):629–638. [Google Scholar]