Abstract
We measured the directionality of the cones using both a psychophysical (Stiles-Crawford I) technique and an optical technique. Both sets of measurements were made in the same subjects using as similar stimuli as possible. Both types of measurements gave similar estimates of the location in the pupil towards which the cones were optimally aligned. However, the two measurements gave very dissimilar estimates of the width of the directional sensitivity. On average optical measurements were half as broad as psychophysical measurements in the fovea, but there were substantial individual differences. At 2 deg retinal eccentricty the difference between techniques was even more marked.
Introduction
The apparent brightness of a light changes as its entry point is moved from one location to another within the pupil of the human eye1. This change in the relative luminous efficiency as a function of pupil location is called the Stiles-Crawford effect of the first kind (SCE-I). The change in entry pupil position for the incident light is associated with a change in the angle of the light at the retina, and thus the luminosity change with pupil entry position is a measure of the angular sensitivity of the cone photoreceptors. The peak location of the luminous efficiency function is interpreted as the location in the pupil towards which the cone photoreceptors are orientated. The luminous efficiency functions is typically modeled as a Gaussian distribution (or equivalently log sensitivity is represented by a parabolic change with pupil location) 2,1. That is:
| (1) |
where S0 is the sensitivity at the location in the pupil with maximal luminous efficiency (located at position x0, y0) , x and y are the test positions within the pupil, and ρ (rho, in inverse millimeters squared) represents a space constant (the larger the rho, the higher the directionality). The SCE-I effect was hypothesized to be retinal in origin by Stiles and Crawford 1, and later work attributed the angular sensitivity to the cone photoreceptors themselves3-8. It is now accepted that the cones act as optical waveguides7, with inner segments accepting light from a limited angular extent and guiding light from the inner segment to the outer segment.
In recent years there has been a renewed interest in measuring cone waveguide properties using optical techniques9-14. In the optical measurement of cone directional sensitivity the retina is illuminated from a localized region of the pupil and the angular distribution of light exiting the eye is measured. This light distribution is composed of two parts. The first is a diffuse component that fills the pupil, and appears as a uniform illumination of the pupil. This diffuse component is approximately independent of entry pupil position. The second component is a spatially localized component that is most evident when the cones are illuminated from a localized region of the pupil. The distribution of light in the plane of the pupil is described as the sum of these two components. That is:
| (2) |
where B is the intensity of the diffuse component, A is the intensity of the guided component and the rest of the second term is identical to equation 1. In general optical measurements produce estimates of rho that are twice those of psychophysical estimates9, 15, 16, 11, 13. That is, the cone directionality is more pronounced for the optical measurements. From the average measurements reported to date in the literature, the factor of two appears to be consistent. This suggested to us that there may be a simple physical relation between the two types of measurements.
In the current paper we directly compare psychophysical and optical measurements of cone directionality obtained using the same apparatus in the same subjects. Our goal was to confirm that both techniques are tapping a common underlying feature of cone directionality by making the measurements of cone directionality under similar experimental conditions. In addition, by making the measurements at high retinal illuminances we could minimize the role of high photopigment optical density in explaining the broader psychophysical data17-23. By making the measurements at both 0 and 2 deg retinal eccentricity we could control the probability that re-absorption of light by neighboring cones24 could contribute to the reported difference between optical and psychophysical measurements. If there were a single physical factor controlling the difference in the optically and psychophysically measured directionality, then we expected that it would be similar across subjects.
METHODS
Apparatus
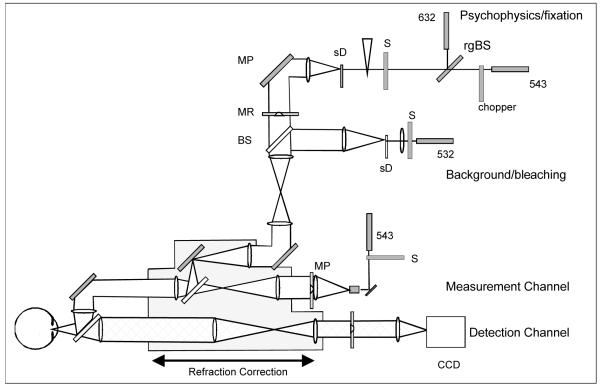
The apparatus is a modification of the reflectometer we have previously used to image the pupillary distribution of light returned from the fundus 16. Figure 1 shows a schematic of the modified Maxwellian view optical system. The current configuration includes the same measurement and detection channels as previously described16,25. However, the fixation channel has been expanded to include a new bleaching channel and a psychophysics/fixation channel. These added channels are combined at a series of beamsplitters prior to combination with the illumination and detection channels.
Figure 1.
A schematic of the optical apparatus used in this study. This was a four channel, Maxwellian view, optical stimulator/imaging system, and a slightly different version has been described in detail elsewhere10. For this study there were four main optical channels. The measurement channel provides the stimulus for the optical measurements. The detection channel, which contained a cooled CCD (Princeton Instruments) is used to record the distribution of light emerging from the plane of the pupil. The bleaching channel produces a large field stimulus that acts to bleach the retina in the optical measurements, and provides a bleaching background field for the psychophysical measurements. The psychophysics channel provides a stimulus that can be positioned both in the pupil and the retina, and was used to generate both fixation and test stimuli (see text).
The measurement channel projects a 1 deg field onto the retina through a pinhole aperture with an 18μm diameter entrance pupil and is illuminated by a 543 nm laser. The pinhole is optically conjugate to the eye’s pupil and its location within the pupil can be moved under computer control. The retinal illuminance was varied by using a series of neutral density filters.
The detection channel contains a cooled, 16-bit CCD camera (Princeton Instruments) which images the light distribution at the pupil, and only the light an aperture in a retinal conjugate plane limits the measurement to light reflected from a 2 deg. retinal area surrounding the stimulus.
The bleaching channel provides an 8 deg. 532 nm illumination field using a 4 mm diameter entry pupil. The bleaching channel was turned off during the 1 second image acquisition period for the optical measurements, and was on continuously, acting as a background, for the psychophysical measurements.
The psychophysics/fixation channel provides either a 543 nm test field (used in the psychophysical measurements presented here) or a 633 test field (used as a fixation stimulus). The location of the pupil entry position of the test field is controlled by computer via two stepper motors. The retinal location of the field is varied using a field stop that can be translated using computer-controlled stepping motors. A neutral density wedge under computer control varies the retinal illuminance of the test stimulus. The test stimulus was square wave modulated using an optical chopper (Stanford Instruments). The speed of the flicker was set to 25 Hz.
For the optical measurements fixation was controlled by varying the angular separation of the measurement and psychophysical channels. A 0.25-deg. 633 nm circular target was placed in the test channel and the subject fixated on the flickering test target. Any differences in the retinal location between the fixation target and the measurement stimulus due to differences in entry pupil position were nullified at the start of each session by requiring the subject to align the two stimuli using a response box. The fixation displacement required for the 2 degree retinal location was then calculated as a displacement from the 0 degree condition.
For the foveal psychophysical measurements the subject fixated the test target, and adjusted the intensity to set the flicker to threshold. For the 2 deg retinal eccentricity measurements an aperture with two holes was used in the psychophysical channel and both the 633 and 543 nm lasers illuminated the spinning diffuser. Wratten filters (Kodak) were placed in front of the two holes such that each passed light from only one of the lasers. The relative intensity of the lasers was set with filters such that the fixation target was above threshold when the flickering test was at threshold. This arrangement allowed us to move the entry pupil location of the fixation target in tandem with the entry pupil location for the test target, minimizing the effect of optical aberrations on the relative locations of the test and fixation stimuli.
Subjects
Six normal subjects aged 26-47 year, 2 females and 4 males, participated in this study. One of the males (JH) had deuteranomalous color vision, while the others were color normal. No reliable difference from normal color vision were found for the deteranomalous observer in the current experimental condition. Three of the subjects (SB, SM, and JH) participated in all conditions. The three additional subjects (AL, DG, and RA) were experienced with psychophysical experiments but due to time constraints we obtained only one(RA) or two (DG, AL) sets of foveal data. All subjects were dilated with 0.5% Mydriacyl after informed consent was obtained.
Optical measurements
Optical measurements were performed in the same way as those reported by Burns et al 16, with the exception that the bleaching channel was used to maintain the retina in a bleached state between measurements. The bleaching light was 5.7 log td. A typical imaging session involved making initial measurements to find the optimal entry pupil location. Once the peak location was found, the distribution of light returning from the retina was measured in the plane of the pupil for 9 pupil entry locations. These locations were centered at 0.5 mm intervals in a 3×3 matrix centered on the initial estimate of the optimal entry location. The optimal location was selected from these images and the results of the parameter fitting for the optimal position are reported. For measurements at 2 deg in the temporal retina the fixation stimulus was illuminated. All other aspects of the measurements are as described previously.
Psychophysical measurements
The flicker threshold for a 25 Hz, square wave modulated, 543 nm light was measured using the method of adjustment. The background was set to 4.3 log td26. Thirty seven entry pupil positions, located at 1 mm intervals in the center of a 7×7 matrix were used. Pupil entry locations were presented in a pseudo-random sequence, and each pupil location was tested twice within each session.
For the three primary subjects 4 experimental sessions were run at both 0 degrees and 2 degrees temporal retinal eccentricity. The first session was used as a practice session, and the data from the final three sessions were analyzed and averaged.
Data Processing
For the psychophysical measurements the subject’s precision at setting the flickering stimulus to threshold is approximately proportional to the threshold for all pupil entry positions. We therefore did not fit equation 1 to the data directly. We first calculated the logarithm of the luminous efficiency for each of the 37 pupil loci. We then fit the log sensitivities to a two dimensional parabolic function (equivalent to the logarithm of equation 1). This approach corresponds to the conventional technique for fitting SCE I data 2, 1. For the optical measurements we used the approach described in detail by Burns et al. 16. Briefly, the distribution of light in the plane of the pupil was treated as consisting of a diffuse component and a guided component, and equation 2 was fit to the data directly. From this fit we obtained the peak location and estimate of rho.
RESULTS
Optical Measurements
Sample images from each of the six subjects are shown in Fig. 2. Each image represents a single intensity distribution at the plane of the pupil, obtained when the retina was illuminated along the axis of the photoreceptors. The location of the peak of the fit of equation 2 to the peak of the measured intensity distributions is taken as the location towards while the cones are oriented (that is, the maximum of the optical Stiles-Crawford effect), and rho as the directionality. In previous studies we have shown that the peak location estimated with this approach is insensitive to the exact choice of pupil entry position25,27.
Figure 2.
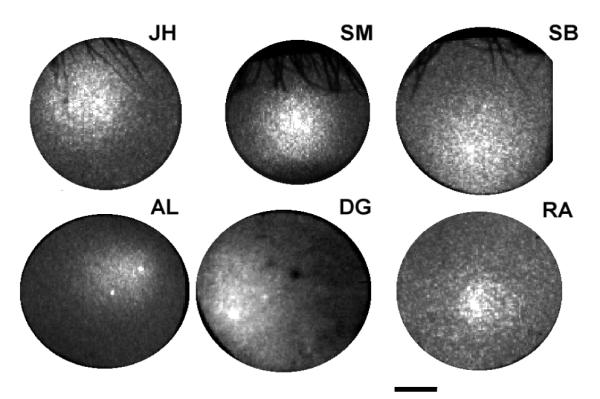
Optical measurements of cone directionality for six subjects. Each image is the intensity distribution measured at the pupil plane of light returning from the retina when a 1 degree retinal area is illuminated near the peak of the directionality reflectivity function. The scale bar indicates 2 mm. Initials correspond to images for each of the subjects.
Psychophysical measurements
Fig. 3 shows contour plots of the log flicker-sensitivity measurements as a function of pupil entry position for the six subjects. Smooth contours have been drawn at 0.2 log sensitivity intervals. All subjects showed a clear pupil location where luminous efficiency was highest. Luminous efficiency decreased smoothly away from this optimum location as expected.
Figure 3.
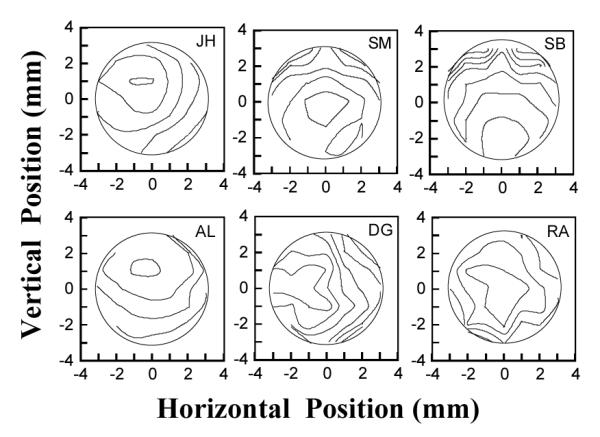
Contour plots of the logarithm of the relative luminous efficiency as a function of pupil location for the same six subjects as figure 2. Contours are plotted at 0.2 log unit intervals.
Comparison of psychophysical and optical estimates of cone directionality
Figure 4 compares the estimated peak location for the psychophysical and optical measurement at both 0 and 2 deg. As in previous studies2 we found large individual variations in the pupillary location of the peak luminous efficiencies between subjects. However, the agreement in the estimation of peak location between the two techniques was good, with a mean distance between techniques of 0.5 ± 0.3 mm. Since the sampling interval for the psychophysical data was 1 mm, the difference between the estimated peaks for the two techniques was less than the sampling interval. In addition, the discrepancies between the two techniques were smallest for the subjects with the most runs, suggesting that the remaining differences may be related to the accuracy of the data.
Figure 4.
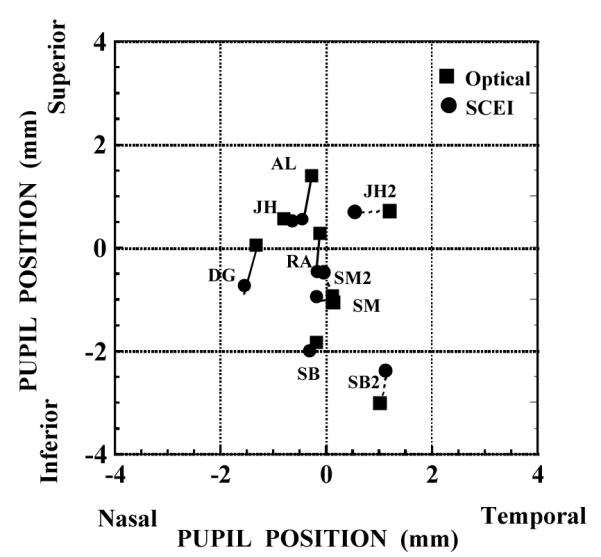
Comparison of the estimates of the location in the pupil of peak cone sensitivity measured psychophysically (open squares) and optically (solid circles). The lines connect the estimates using the different techniques for each subject. Dashed lines and a numeral 2 indicate the comparisons for SM, JH, and SB at 2 deg in the termporal retina.
Fig. 5 compares the estimated rho parameter (the narrowness of the directional tuning) for foveal measurements determined from both techniques for the six subjects. The optical estimates of directional tuning (rho) were higher than the psychophysical estimates for all subjects. However, we also found that a broad psychophysical tuning function for a given subject did not necessarily correspond to a broad optical measurement in that subject. Fig. 6 shows the ratio of the two estimates of the tuning width for the subjects. While the mean value of the ratios for the six subjects is close to 2 as had been previously reported for mean data 9, 10, 13, the individual ratios ranged from 1.3 to 3.3.
Figure 5.
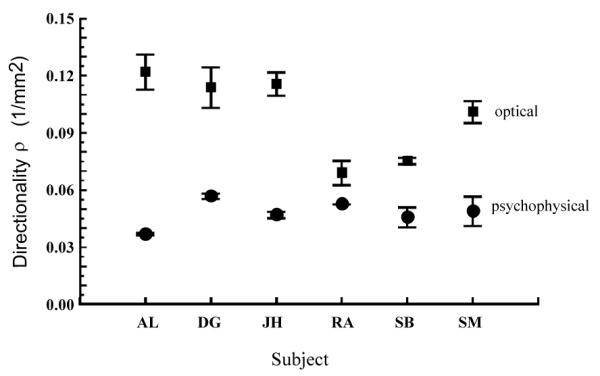
Comparison of cone directionality (rho parameter) measured by both optical (open squares) and psychophysical (squares) techniques for the same six subjects. Error bars represent ∀1 std error of the mean.
Figure 6.
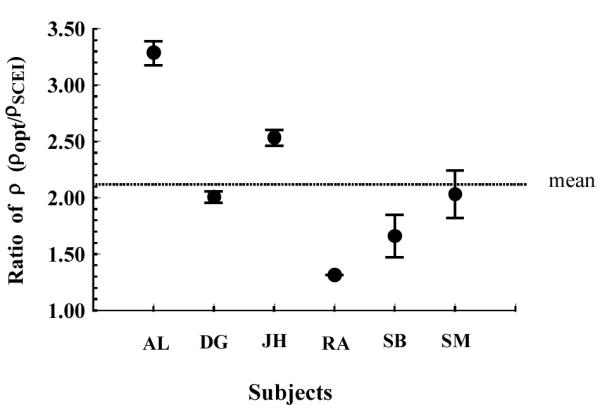
Ratio of the optical and psychophysical estimates of rho for each subject at the fovea. Each solid circle indicates the mean of the ratio for each individual, and the error bar represents ∀1 std error of the mean. The vertical dotted line shows the average across subjects.
Changing the measurement location to 2 deg had a different effect on the two types of measurements. Figure 7 compares the directionality measured at 0 and 2 deg retinal eccentricities for subjects, JH, SM and SB. The foveal data are included from Fig 5 for comparison. The change in directional tuning with retinal location varies from subject to subject. For instance for the psychophysical data rho decreased slightly from 0 to 2 deg for subject SB but increased for subjects JH and SM as has been reported elsewhere28-30. This is in contrast to the optical measurements which narrowed for all subjects25. Overall for these three subjects the ratio of the optical to psychophysical estimates of rho increased from 2.1 in the fovea to 4.6 at 2 degrees.
Figure 7.
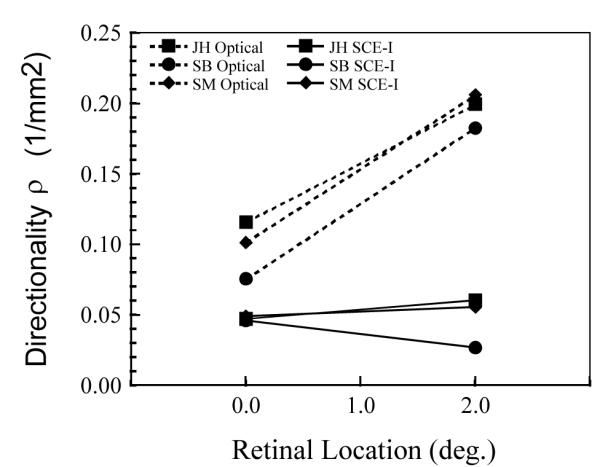
The change in cone directionality with retinal location for three subjects. The optical measurements (dashed lines) and psychophysical measurments (solid lines) change differently with changes in retinal position.
DISCUSSION
The current data confirm that the location of the estimated peak luminous efficiency of the cones is the same for both optical and psychophysical measurements of cone directional sensitivity. This is consistent with previous studies 9, 15, 10 and is strong evidence that both optical and psychophysical techniques are tapping a common underlying process. We also found that when measured in the same individual, under very similar conditions, the psychophysical measurements gave consistently broader estimates of cone directional sensitivity than did optical measurements. This confirms previous studies which made this comparison based on average results 9,10,13. However, the data do not support the idea that there is a simple physical relation between the two types of measurements. The lack of a significant correlation between the psychophysically measured rho and the optically determined rho suggests that either multiple processes contribute to the measured differences, or that the major contributor to the difference between techniques is highly variable across individuals. In the remainder of the discussion we will outline the current understanding of some of the factors in addition to waveguide properties of the cone inner segments which can contribute to the measured photoreceptor directionality.
Ocular Media
Differences in the absorption of the ocular media for light traversing different pupil entry positions can effect measurements of the Stiles-Crawford effect1,31,32. However, for the relatively younger ages, as well as for the longer wavelengths used in the present study, ocular media is unlikely to be a major cause of the measured differences. In addition, the difference between the optical and psychophysical measurements is similar whether the cones are directed towards the center of the pupil or more eccentrically.
Photoreceptor Disarray
If each photoreceptor has a relatively narrow angular sensitivity, but there is significant disarray33-35 in the orientations of groups of photoreceptors within the measurement area, then the angular sensitivity of the eye measured psychophysically will be broader than that measured optically. This is because optical measurements are obtained when the cones are illuminated from a single entry pupil position near the peak of the cone directionality, and psychophysical measurements are obtained by measuring sensitivity for a series of different pupil entry positions. However, both psychophysical34 and optical25 estimates of receptor disarray near the fovea indicate there is only a minimal role for receptor disarray in the healthy fovea, although it may be more important in the periphery and in diseased eyes.
Leakage of light from outer segments
It is generally accepted that some photons that are captured by the inner segment of the cones do not travel the full length of the outer segment, but instead escape the outer segment (cone leakage). Photons captured by the inner segments at a high angle (far from the Stiles-Crawford peak) are more likely to exit the outer segments. The effect of this leakage on directionality measurements differs between the psychophysical and optical measurements. For the SCE-I effect the escaped photon has a chance of being absorbed by adjacent cones24, and thus can still contribute to visual sensitivity. For optical measurements it is unlikely that these photons will be recaptured and guided back towards the pupil, and as a result these photons do not contribute to the optical measurements. At extremely high angles of incidence photons might never be captured by the cones, but rather can pass transversely through the outer segments. Such photons could contribute to visual sensitivity but are not likely to be optically captured upon scattering, and thus probably do not contribute to the optical measurements of directionality.
Leakage of light from the outer segments arises because some waveguide modes which are launched in the inner segment of the cones are not propagated for the full length of the outer segment. This causes a decrease in the average pathlength of light through the outer segment with increasing angles of incidence. This decreased pathlength has consequences for both the reflectometric and the psychophysical measurements. For psychophysics it is a major contributor to both the change in the absorption spectrum of the cone photopigments with angle of incidence (self-screening) and to cone cross-talk, the stimulation of one cone by light that first passes through another. For the optical measurements it means that the modal distribution that is reflected or scattered back towards the pupil may not match the modal distribution available for photopigment absorption.
Self-Screening
Since light entering the cones off-axis has a shorter path-length through the photopigment than light entering the cones on-axis, the cones have a lower effective optical density for off-axis illumination, and this shorter pathlength causes a change in spectral sensitivity as predicted by Beer’s law17,33,36,21. This change in sensitivity is a major cause of the change in the color appearance of a light with pupil entry (the Stiles-Crawford effect of the second type SCE-II) 17-23. The fact that bleaching eliminates much of the SCE-II effect 18,37, confirms that the total pathlength of light through the outer segments changes with the pupil entry position. The variation in the effective optical density of the photopigments with pupil entry position also has an effect on the SCE-I effect when it is measured with the photopigments present at high densities. Self-screening occurs because the distribution of quantal catches along the length of the cones is not constant, that is, the ends of the outer segments have been “screened” by the more proximal portions of the outer segments. The relatively decreased probability of absorbing a photon for light entering the cones along their axis means that the resulting psychophysically determined SCE-1 effect is broader than expected based on its waveguide properties alone18,3,20,22,23. At high retinal illuminances, when the photopigment is bleached, the SCE-I effect narrows. Self-screening is unlikely to explain the discrepancy between the psychophysical and optical estimates of cone directionality measured in the current study since both sets of measurements were made with the cone photopigments bleached.
Cone-to-Cone cross-talk
Chen and Makous24 have shown that the acuity of the eye to interference fringes decreases for high angles of incidence on the cones. They present evidence that this occurs because some of the light that escapes one cone, can be absorbed in adjacent cones, resulting in a loss of contrast for high spatial frequencies. The discrepancy between our psychophysical and optical measurements is unlikely to arise solely from cross-talk, since the psychophysical data collected at 2 degree are also broader than the optical data at 2 deg. Based on a simple model of the angles involved and the relative size and spacing of the cone outer segments, the cross-talk at 2 degrees retinal eccentricity should be reduced by more than a factor of 10 times relative to the fovea. Our results (Fig 7.) show only a slight narrowing of the width of the bleached SCE-I effect and only in two out of three subjects. The increased directionality is very small, and never makes the psychophysically determined width close to the optically determined width. In fact, the ratios between the widths of the two techniques increases from 2.47, 2.06 and 1.65 at the fovea to 3.32, 3.72 and 6.89 at the 2 deg. retinal location for subjects JH, SM and SB respectively. Thus, we do not believe that inter-cone-absorption alone can explain the relative narrowness of the optical measurements.
Coupling of reflected light
While there are different models for how light is reflected or scattered back towards the pupil9,38-40, it is highly likely that once light exits the cone outer segments only a small proportion is recaptured and guided back towards the pupil41. The directional component of the retinal reflectance apparently arises from reflections at either the photoreceptor discs40, from scattering from melanin granules of the retinal pigment epithelium which lie in close proximity to the cone outer segments39 or from the base of the outer segments themselves. If only selected waveguide modes are transmitted as far as the reflecting element, or if the coupling constant differs for different waveguide modes39, then the relative number or proportion of modes that are measured by reflectometry may be smaller than the number which are available for photopigment absorption. Because of this loss of higher order waveguide modes it is reasonable to suspect that optical measurements will be narrower than the waveguide properties of a single receptor. This is a viable explanation for the difference between our optical and psychophysical measurements, though by itself it does not readily explain the large variability in the ratio of the psychophysical and optical estimates of directionality. An additional factor such as a large variability in the outer segment morphology, or the spatial relation between the outer segment tips and the photoreceptors would also be required to explain this variability.
Scattering
We have previously presented both a model and supporting data 27,42 which argue that the interference of light returning from different photoreceptors at slightly different planes alters the distribution of light measured in the plane of the pupil. According to scattering theory, the distribution of light originating from the cone mosaic is affected both by the waveguide properties of the cones and by cone aperture and spacing. As a result the measured rho value is the sum of two terms, one from the waveguides, the other from cone spacing. This causes the measured light distribution to be narrower than the distribution predicted based on the waveguide properties of the cones alone, an effect that is especially prominent at 2 deg retinal eccentricity where the cone spacing is larger. While taking scattering into account decreases some of the variability of the optical measurements, and decreases the discrepancy between optical and psychophysical estimates of directionality, scattering cannot account for the entire difference between the optical and psychophysical measurements.
CONCLUSIONS
The location for the peak sensitivity of the cones estimated either by psychophysical or optical techniques are the same, and this strongly supports the contention that both approaches are dependent on the underlying directional sensitivity of the cones. However, the optical estimates of angular sensitivity are always narrower than the psychophysical estimates and the ratio of the directionality measurements using the two modalities is highly variable. The two most likely causes of the discrepancy between the two measurement techniques are the difference in mode structure between the light captured by the inner segment and that reflected back out of the cones and the spatial effects arising from slight phase differences between the cones. Since this latter effect is dependent on cone spacing, it can account for at least some of the individual variability in the optical measurements 43,44. However, cone spacing alone cannot account for the total effect we have measured in the present study. It is also evident that we cannot use either type of measurement alone as a basis for constructing models of photoreceptor optics.
Acknowledgements
We thank Joel Pokorny for advice on the psychophysical measurements. This work was supported in part by Public Health Service grants EYO4395 (SB), EYO6629 (JH), a Department of Energy Center of Excellence Grant, DE-FG-02-91ER61229, and a Human Frontiers Research Program grant LT542197 (SM).
REFERENCES
- 1.Stiles WS, Crawford BH. The luminous efficiency of rays entering the eye pupil at different points. Proceedings of the Royal Society (London) B. 1933;112:428–450. [Google Scholar]
- 2.Applegate RA, Lakshminarayanan V. Parametric representation of Stiles-Crawford functions: normal variation of peak location and directionality. Journal of the Optical Society of America A. 1993;10:1611–1623. doi: 10.1364/josaa.10.001611. [DOI] [PubMed] [Google Scholar]
- 3.Enoch JM. Visualization of waveguide models in retinal receptors. American Journal of Ophthalmology. 1961;51:1107–1118. doi: 10.1016/0002-9394(61)91800-1. [DOI] [PubMed] [Google Scholar]
- 4.Laties AM, Enoch JM. An analysis of retinal receptor orientation. Investigative Ophthalmology and Visual Science. 1971;10:69–77. [PubMed] [Google Scholar]
- 5.Laties AM, Liebman PA, Campbell CEM. Photoreceptor orientation in the primate eye. Nature, Lond. 1968;218:172–173. doi: 10.1038/218172a0. [DOI] [PubMed] [Google Scholar]
- 6.O’Brien B. The Stiles-Crawford effect in polarized light. Journal of the Optical Society of America. 1947;37:275–278. doi: 10.1364/josa.37.000275. [DOI] [PubMed] [Google Scholar]
- 7.de Francia G. Toraldo. Retina cones as dielectric antennas. Journal of the Optical Society. 1949;39:324. [Google Scholar]
- 8.Wright WD, Nelson JH. The relation between the apparent intensity of a beam of light and the angle at which it strikes the retina. Proceedings of the Royal Society. 1936;48:401–405. [Google Scholar]
- 9.Blokland GJV. Directionality and alignment of the foveal receptors assessed with light scattered from the human fundus in vivo. Vision Research. 1986;26:495–500. doi: 10.1016/0042-6989(86)90192-6. [DOI] [PubMed] [Google Scholar]
- 10.Burns SA, Wu S, Delori FC, Elsner AE. Direct measurement of human cone photoreceptor alignment. Journal of the Optical Society of America A. 1995;12(10):2329–2338. doi: 10.1364/josaa.12.002329. [DOI] [PubMed] [Google Scholar]
- 11.DeLint PJ, Berendschot TTJM, van Norren D. Local photoreceptor alignment measured with a scanning laser ophthalmoscope. Vision Research. 1997;37:243–248. doi: 10.1016/s0042-6989(96)00118-6. [DOI] [PubMed] [Google Scholar]
- 12.Gorrand J-M. Directional effects of the retina appearing in the aerial image. Journal of Optics. 1985;16:279–287. [Google Scholar]
- 13.Gorrand J-M, Delori FC. A reflectometric technique for assessing photoreceptor alignment. Vision Research. 1995;35:999–1010. doi: 10.1016/0042-6989(94)00203-x. [DOI] [PubMed] [Google Scholar]
- 14.Krauskopf J. Some experiments with a photoelectric ophthalmoscope. Excerpta Medica Intl Congress Series. 1965 [Google Scholar]
- 15.Burns SA, Elsner AE, Gorrand J-M, Kreitz MR, Delori FC. Comparison of Reflectometric and Psychophysical Measures of Cone Orientation. Noninvasive Assessment of the Visual System, OSA Technical Digest Series. 1992;1:160–163. [Google Scholar]
- 16.Burns SA, Wu S, Delori FC, Elsner AE. Reflectometric Measurement of Human Cone Photoreceptor Directionality. Washington, D.C.: 1995. (unpublished) [DOI] [PubMed] [Google Scholar]
- 17.Alpern M. Lack of uniformity in colour matching. Journal of Physiology (London) 1979;288:85–105. [PMC free article] [PubMed] [Google Scholar]
- 18.Burns SA, Elsner AE. Color matching at high illuminances: photopigment optical density and pupil entry. Journal of the Optical Society of America A. 1993;10:221–230. doi: 10.1364/josaa.10.000221. [DOI] [PMC free article] [PubMed] [Google Scholar]
- 19.Enoch JM, Stiles WS. The colour change of monochromatic light with retinal angle of incidence. Optica Acta. 1961;8:329–358. doi: 10.1080/713826396. [DOI] [PubMed] [Google Scholar]
- 20.Starr SJ. Ph.D. Dissertation. The University of Chicago; 1977. Effect of luminance and wavelength on the Stiles-Crawford effect in dichromats. [Google Scholar]
- 21.Stiles WS. The luminous efficiency of monochromatic rays entering the eye pupil at different points and a new colour effect. Proceedings of the Royal Society (London) B. 1937;123:90–118. [Google Scholar]
- 22.Walraven PL, Bouman MA. Relation between directional sensitivity and spectral response curves in human cone vision. Journal of the Optical Society of America. 1960;50:786–784. doi: 10.1364/josa.50.000780. [DOI] [PubMed] [Google Scholar]
- 23.Wijngaard W, Bouman MA, Budding F. The Stiles-Crawford Colour Change. Vision Research. 1974;14:951–957. doi: 10.1016/0042-6989(74)90162-x. [DOI] [PubMed] [Google Scholar]
- 24.Chen B, Makous W. Light capture by human cones. Journal of Physiology - London. 1989;414:89–109. doi: 10.1113/jphysiol.1989.sp017678. [DOI] [PMC free article] [PubMed] [Google Scholar]
- 25.Burns SA, Wu S, He J, Elsner AE. Variations in photoreceptor directionality across the central retina. Journal of the Optical Society of America A. 1997;14:2033–2040. doi: 10.1364/josaa.14.002033. [DOI] [PMC free article] [PubMed] [Google Scholar]
- 26.4.3 log td was used to improve accuracy, while this bleaches only about 50% of the visual pigments, pilot experiment at 5.8 log td showed no significant difference in the measured rho value. However, accuracy of the data were worse at this higher illuminance
- 27.Marcos S, Burns S. Cone spacing and waveguide properties from cone directionality measurements. Journal of the Optical Society of America A. 1999;16:995–1004. doi: 10.1364/josaa.16.000995. [DOI] [PMC free article] [PubMed] [Google Scholar]
- 28.Enoch JM, Hope GM. Directional sensitivity of the foveal and parafoveal retina. Investigative Ophthalmology and Visual Science. 1973;12:497–503. [PubMed] [Google Scholar]
- 29.Starr SJ, Fitzke FW, Massof RW. The Stiles-Crawford effect in the central fovea. Investigative Ophthalmology and Visual Science (Supplement) 1979;20:172. [Google Scholar]
- 30.Westheimer G. Dependence of the magnitude of the Stiles-Crawford efect on retinal location. Journal of Physiology (London) 1967;192:309–315. doi: 10.1113/jphysiol.1967.sp008301. [DOI] [PMC free article] [PubMed] [Google Scholar]
- 31.Vos JJ, van Os FL. The effect of lens density on the Stiles-Crawford effect. Vision Res. 1975;15(6):749–751. doi: 10.1016/0042-6989(75)90297-7. [DOI] [PubMed] [Google Scholar]
- 32.Weale RA. On the problem of retinal directional sensitivity. Proc R Soc Lond B Biol Sci. 1981;212(1186):113–130. doi: 10.1098/rspb.1981.0028. [DOI] [PubMed] [Google Scholar]
- 33.Burns SA, Elsner AE. Color matching at high illuminances: the color-match-area-effect and photopigment bleaching. Journal of the Optical Society of America A. 1985;2:698–704. doi: 10.1364/josaa.2.000698. [DOI] [PubMed] [Google Scholar]
- 34.MacLeod DIA. Directionally selective light adaptation a visual consequence of receptor disarray? Vision Research. 1974;14:369–378. doi: 10.1016/0042-6989(74)90235-1. [DOI] [PubMed] [Google Scholar]
- 35.Safir A, Hyams L. Distribution of cone orientations as an explanation of the Stiles-Crawford effect. Journal of the Optical Society of America. 1969;59:757–765. doi: 10.1364/josa.59.000757. [DOI] [PubMed] [Google Scholar]
- 36.Pokorny J, Smith VC. Effect of field size on red-green color mixture equations. Journal of the Optical Society of America. 1976;66:705–708. doi: 10.1364/josa.66.000705. [DOI] [PubMed] [Google Scholar]
- 37.Walraven PL. Recovery of the increase of the Stiles-Crawford effect after bleaching. Nature. 1966;210:311–312. doi: 10.1038/210311a0. [DOI] [PubMed] [Google Scholar]
- 38.Blokland GJV, Norren DV. Intensity and polarization of light scattered at small angles from the human fovea. Vision Research. 1986;26:485–494. doi: 10.1016/0042-6989(86)90191-4. [DOI] [PubMed] [Google Scholar]
- 39.Gorrand J-M, Delori FC. A model for assessment of cone directionality. Journal of Modern Optics. 1997;44:473–491. [Google Scholar]
- 40.van der Kraats J, Berendschot TTJM, Norren DV. The pathways of light measured in fundus reflectometry. Vision Research. 1996;15:2229–2247. doi: 10.1016/0042-6989(96)00001-6. [DOI] [PubMed] [Google Scholar]
- 41.Blokland GJV. The optics of the human eye with respect to polarized light. University of Utrecht; 1986. [Google Scholar]
- 42.Marcos S, Burns SA, He JC. Model for cone directionality reflectometric measurements based on scattering. Journal of the Optical Society of America, A. 1998;15:2012–2022. doi: 10.1364/josaa.15.002012. [DOI] [PubMed] [Google Scholar]
- 43.Curcio CA, Sloan KR, Jr., Kalina RE, Hendrickson AE. Human photoreceptor topography. Journal of Comparative Neurology. 1990;292:497–523. doi: 10.1002/cne.902920402. [DOI] [PubMed] [Google Scholar]
- 44.Marcos S, Navarro R, Artal P. Coherent imaging of the cone mosaic in the living human eye. Journal of the Optical Society of America A. 1996;13(5):897–905. doi: 10.1364/josaa.13.000897. [DOI] [PubMed] [Google Scholar]


