

Abstract
Pathological conditions such as amyotrophic lateral sclerosis or damage to the brainstem can leave patients severely paralyzed but fully aware, in a condition known as “locked-in syndrome.” Communication in this state is often reduced to selecting individual letters or words by arduous residual movements. More intuitive and rapid communication may be restored by directly interfacing with language areas of the cerebral cortex. We used a grid of closely spaced, nonpenetrating micro-electrodes to record local field potentials (LFPs) from the surface of face motor cortex and Wernicke’s area. From these LFPs we were successful in classifying a small set of words on a trial-by-trial basis at levels well above chance. We found that the pattern of electrodes with the highest accuracy changed for each word, which supports the idea that closely spaced micro-electrodes are capable of capturing neural signals from independent neural processing assemblies. These results further support using cortical surface potentials (electrocorticography) in brain-computer interfaces. These results also show that LFPs recorded from the cortical surface (micro-electrocorticography) of language areas can be used to classify speech-related cortical rhythms and potentially restore communication to locked-in patients.
1. Introduction
Amyotrophic lateral sclerosis (ALS) and other pathological conditions can damage the brainstem, leaving patients aware but significantly paralyzed and unable to speak, in a condition known as “locked-in syndrome” [1]. In some cases, patients can continue to communicate using residual movements and selection tasks at a few words per minute [2]. Other patients are unable to perform even limited movements [3, 4]. In these situations, directly interfacing with language centres of the cortex may provide more intuitive communication [5].
Penetrating micro-electrodes are widely used for brain-computer interfaces (BCIs) because of their ability to record single-unit activity (SUA) as well as local field potentials (LFPs). These electrodes have been used to perform rapid decoding of continuous motor movements from neuronal activity in the primary motor area of human neocortex [6]. Because of the risks associated with implantation in language centres, however, few studies have explored their use in speech BCIs. One such study used a glass electrode filled with a neurotrophic growth factor to encourage axonal growth into the electrode [7]. This unique design has been used in BCIs to control a cursor on a computer screen for indirect communication [8], as well as to directly decode the formant frequencies of speech from neuronal activity in the left ventral premotor cortex [9, 10].
In contrast to these more recent penetrating micro-electrodes, the earliest studies of BCIs for communication used noninvasive electroencephalographic (EEG) electrodes to target several types of neural signals, including slow cortical potentials (SCP), sensorimotor rhythms (SMR), and the P300 wave [11–17]. In a study comparing the efficacy of each of these neural signals for EEG BCI, patients received 20 training sessions and then underwent an evaluation of their accuracy. All patients trained to use SMR were able to achieve 70% accuracy or better while about half of patients using the P300 wave and none of the patients using SCP were able to achieve this same threshold [5]. With sufficient additional training, patients using SCPs were able to achieve the same accuracy with better stability. More recently, a two-dimensional movement trajectory decode using SMR was performed to control a cursor in a multi-target selection task, with similar timing, accuracy, and precision as have been previously obtained using depth electrodes [18].
Electrocorticography (ECoG) provides a third option, which balances invasiveness with signal fidelity and has become more common in recent years because of its clinical ubiquity in preparing patients for the surgical treatment of epilepsy. Neural activity recorded from ECoG electrodes has been used in the discrimination of finger movements [19–22] and arm movements [23–26], two-dimensional movement trajectories [27, 28], and other motor tasks [29, 30]. Researchers investigating speech BCIs using ECoG electrodes have shown that cortical surface potentials could be used to discriminate between motor and speech tasks [30] and different phonemes [31]. In particular, event-related gamma synchronization [32], more temporally and spatially discrete than desynchronization in lower oscillatory bands, may provide spatiotemporal features well correlated to the production of speech [33–35].
ECoG-based BCIs exploit the proximity of the intracranial electrodes to the cortical surface to provide higher signal-to-noise ratio and improved spatial resolution than their extracranial EEG counterparts [36, 37]. These properties have allowed more in-depth analysis of high gamma modulations during motor tasks, a neural source that has become a foundational element of modern BCI research. However, many authors have suggested that millimetre-scale electrodes and centimetre-scale inter-electrode spacing are too coarse for neural prosthetic applications [30, 38, 39]. The root of this limitation lies in the size and spacing of clinical ECoG electrodes relative to the underlying cortical structure for information processing. One study of ECoG in human motor-sensory and temporal regions found that correlated gamma modulation was limited to areas covered by only a few (i.e., two) macro-electrodes [39]; similar findings have been noted in at least one other independent study [30]. The local nature of these modulations implies the presence of neuronal assemblies working synchronously to process related types of information needed to generate complex outputs [40–42]. Multiple subpopulations of neurons, possibly engaged in processing distinct stimuli, may contribute to the signal recorded by a single millimetre-scale electrode. Consequently, the rhythmic activity of any one focal area may be obscured in the activity of the several assemblies contributing to the voltage recorded by a single electrode.
Evidence of the spatial discrepancy between macro-electrodes and microscale cortical processing was both unavailable prior to the design of the clinical ECoG electrode and largely irrelevant to the design of electrodes for localizing epileptic foci. However, this knowledge could be used to develop surface electrodes specifically designed to support higher spatial-resolution recording for BCI applications, balancing the need for locally accurate representation of cortical activity with the simultaneous need for limited invasiveness. In this study, we used a recording device consisting of nonpenetrating microwire terminated at regular, millimetre-scale intervals to record cortical surface field potentials. The tight inter-electrode spacing of these micro-electrodes closely approximates the local scale of modulations previously shown to correlate with motor activity [26, 38, 39, 43–46]. This work extends previous studies in which similar micro-electrode arrays have been shown to support high temporal- and spatial-resolution recordings for BCI-like applications [26, 43].
Most studies of speech BCIs using invasive recording techniques, regardless of the neural signals used, have focused on the challenging task of decoding continuous, dynamic speech from the neural representations of formant frequencies [9, 10, 31]. In contrast, we classified only finite sets of words from cortical surface LFPs [47]. Although the potential breadth of decoded language is therefore inherently limited, this approach has the potential to restore functional and rapid communication with greatly reduced complexity.
We designed a set of experiments to investigate the trial-by-trial classification of individually articulated words using LFPs recorded on micro-ECoG grids. We evaluated both the general performance of the classifier, and, to give a sense of the scale of the underlying cortical processing, the ability to distinguish words from the features of individual micro-electrodes. We found that the recorded data supported accuracies well above the level of chance in classifying up to 10 individual words. We also found variation in the classification accuracy of individual micro-electrodes, suggesting local, distributed processing for the generation of complex speech articulations.
2. Methods
2.1 Subject
One male patient who required extraoperative ECoG monitoring for medically refractory epilepsy gave informed consent to participate in an institutional review board-approved study. In addition to the clinical ECoG array, two nonpenetrating micro-electrode arrays (PMT Neurosurgical, Chanhassen, MN), each consisting of 16 channels of 40-μm wire terminating in a 4×4 grid with 1-millimeter spacing (figure 1a), were placed beneath the dura mater, closely approximated to the cortical surface over face motor cortex (FMC) and Wernicke’s area (figure 1b). The in situ location of clinical and research electrodes on a rendered brain were calculated according to the methods described in [48]. Clinical requirements determined placement of the arrays and duration of the implantation.
Figure 1.
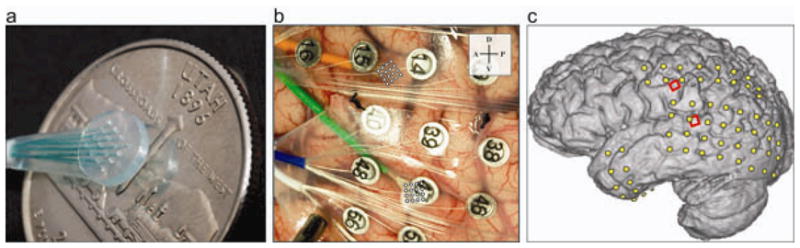
The micro-ECoG grid and surgical placement. a, A single 16-electrode 4×4 micro-ECoG grid shown next to a U.S. quarter-dollar coin. b, Photograph of micro-ECoG surgical placement; the green wire bundle leads to the array over Wernicke’s area; the orange wire bundle leads to the array over face motor cortex. c, Electrode positions in situ; micro-ECoG grids in red and clinical ECoG electrodes in yellow.
2.2 Experimental paradigm
During the experiments, the patient rested sitting or reclining in a hospital bed. Researchers verbally instructed the patient to articulate a word multiple times, with approximately one-second intervals between repetitions. A visual cue indicated when the patient should begin speaking, with a visual reference indicating progress through the repetitions. This process occurred at least once during each session for each of ten words (Table 1), with extra trials processed for the words “yes” and “no” to ensure adequate data for preliminary analysis of the data. Sessions lasted approximately one hour and occurred on four consecutive days. For each word, a subset of 30 adjacent trials (15 for training and 15 for decode) containing stereotypical articulation was selected for further analysis. Trials were determined to be stereotyped judging each one on inflection, pitch, and duration. For some words, e.g. “yes” and “hot”, the pronunciation of words varied enough that more than half of the trials were discarded.
Table 1.
Listing of words used and numbers of recorded and stereotyped trials.
| Word | Trials recorded | Stereotyped repetitions |
|---|---|---|
| Yes | 166 | 81 |
| No | 160 | 96 |
| Hot | 65 | 31 |
| Cold | 65 | 48 |
| Hungry | 67 | 48 |
| Thirsty | 65 | 53 |
| Hello | 69 | 34 |
| Goodbye | 65 | 35 |
| More | 65 | 49 |
| Less | 67 | 52 |
2.3 Data collection and analysis
Audio data from a microphone and 32 channels of neural data from two 16-channel micro-electrode arrays were recorded by a Neuroport system (Blackrock Microsystems, Salt Lake City, UT), with reference tied to the clinical reference lead, during these experiments. The data were amplified, bandpass filtered with cutoff frequencies at 0.3 Hz and 7500 Hz, and digitized at 30,000 samples per second.
Spectrograms were generated using the open-source Chronux package software (chronux.org) with 400-msec windows and 100-msec step size; tapering parameters were set to a time-bandwidth product of 5 and 9 leading tapers. Spectrograms were smoothed using a mean filter over four 0.9-Hz bands and six 100-msec time steps. Time-series data for the spectrograms were selected from portions of the sessions in which patient–researcher verbal interactions were interspersed between the verbal tasks.
The mean power between 70 and 200 Hz was calculated for data recorded over FMC and Wernicke’s area. The raw data were bandpass filtered (70–200 Hz, Chebyshev Type-I bandpass filter), and then the moving average of the instantaneous power was calculated for each channel. The mean and standard error were calculated across these data separately for FMC and Wernicke’s area.
2.4 Feature extraction
Recorded data from each micro-electrode were re-referenced by subtracting the common average of electrodes in the same array. For each spoken word, 0.5 seconds of data aligned to the articulation were extracted from all micro-electrodes and windowed by a Hann window. The power spectra of these data were calculated by applying a fast Fourier transform (FFT), then multiplying by the complex conjugate of the FFT. Data for frequencies above 500 Hz were discarded, and the remaining power spectra were log-normalized across trials for each micro-electrode. At the end of this process, each articulation was represented by 250 frequency-domain features, i.e., the power in 2-Hz bands between 0.3 and 500 Hz, per micro-electrode.
2.5 Classification
Previous studies have used principal component analysis (PCA) [49] to separate frequency-domain features in neural signals [20]. We extended the method of Miller et al. to perform PCA on features from each micro-electrode and trial simultaneously (figure 2). Initially, features collected from all micro-electrodes for a given articulation were concatenated to form a row vector. Row vectors from multiple articulations were stacked vertically to form a two-dimensional matrix of all available features from multiple micro-electrodes and trials. This matrix could be customized by including only features from a subset of micro-electrodes or trials. During the training phase, PCA was performed on a matrix consisting of features collected from 15 “training” trials per word. A centre of mass, or centroid, was calculated for each word as the mean Euclidean coordinates of all relevant trials’ feature-vectors projected into the principal component space. During the decode phase, projected feature-vectors from 15 additional trials were classified according to their proximity to one of the centroids.
Figure 2.

Using frequency-domain structure to decode simultaneously from multiple channels. a, 500-msec windows temporally aligned to spoken words contain frequency-domain structure in a spectrogram of neural data recorded by a single micro-electrode over face motor cortex. Axis labels indicate that data from multiple micro-electrodes and trials will be used. b, Power spectra were calculated for each trial and each micro-electrode. c, For each trial, power spectra from all micro-electrodes were concatenated. Trials were stacked to form a large two-dimensional matrix of micro-electrode and trial information. d, Performing principal component analysis on this matrix generated a cluster for each word that allowed nearest-centroid classification.
2.6 Evaluation
The classification process was performed using features from combinations of two through ten words. In this case, the term combination refers to the selection of k unordered outcomes from n possibilities, i.e., selecting k of the available n words where, for example, n=10 and k ranges between two and ten. When k and n are equal, only one unordered outcome exists and the standard descriptive statistics were not applicable. Otherwise, for each set of outcomes, the mean, median, and standard deviation were computed for the accuracies of the classification results. We also evaluated the performance of the PCA classifier using features from subsets of one, five, 16, and 32 micro-electrodes. Where applicable, these subsets were selected from within a single 16-channel micro-electrode array.
In addition to evaluating the general accuracy of the PCA classifier, the ability of individual micro-electrodes to discriminate individual words was also evaluated. Features were selected from single micro-electrodes for all two-word combinations and processed by the classifier. The accuracies of all classifications involving a given word were averaged to determine the ability of each micro-electrode to discriminate individual words against other possible class assignments.
Classification accuracy was measured against the level of chance for all evaluations. This level was determined by assuming equal likelihood of assignment to any class included in the training process (i.e., the uniform distribution applied to class assignment). For example, if two words were being classified, the level of chance was 0.5 since both potential class assignments were equally likely to be assigned to each trial. Classification accuracies consistently above the level of chance would indicate the detection and exploitation of relevant features from what could otherwise be completely stochastic physiological data.
3. Results
3.1 FMC is active during task, Wernicke’s area during conversation
Initial observations of neural signals recorded over FMC revealed frequency-domain structure aligned to the individual words during the speech task. Conversely, Wernicke’s area was predominantly active during conversation and while receiving verbal rewards after completing an experiment and was less active during the repeated word experiments (figure 3, supplementary figures 1–3). For these figures, we chose data corresponding to times during the experiments in which patients were performing the verbal task as well as interacting with researchers so as to examine differences between FMC and Wernicke’s area during these different paradigms. Variability in the task-correlated power was present between sessions, and may be due to several factors including medication, arousal, or attention, which could result in the patient varying the strength of articulation; or device-related issues such as micro-motion of the electrodes relative to the cortex due to seizure activity.
Figure 3.

Raw data, spectrogram, and mean power during conversation and task. a, Audio waveform of conversation and verbal task in which the patient repeated the word “yes.” b, Normalized spectrogram of neural data recorded from a single electrode over face motor cortex during the same time period shown in (a). c, Normalized spectrogram of neural data recorded from a single electrode over Wernicke’s area during the same time period shown in (a). d, Mean power and standard error between 70 and 200 Hz for the 16 electrodes over FMC and the 16 electrodes over Wernicke’s area.
3.2 Classification better for FMC than Wernicke’s
Classification was performed both separately and jointly for surface LFP data recorded over FMC and over Wernicke’s area. Data from micro-electrodes over FMC offered the best classification performance with 85.0 ± 13.1% (mean ± s.d.) average accuracy over 45 two-word combinations (median performance was 83.3%). Data recorded over Wernicke’s area were less classifiable with 76.2 ± 15.0% average accuracy over the same 45 two-word combinations (median 76.7%) (figure 4). Joint classification did not improve performance over the level achieved by FMC electrodes alone (0.40 ± 0.43 percentage-point difference in the accuracy of two- through ten-word combinations).
Figure 4.

Classification accuracy for combinations of two through ten words. The distribution of classification accuracies from performing each combination of two through ten words is shown. Results are shown using features from all 16 electrodes over FMC; features from all 16 electrodes over Wernicke’s area; and features from the best 5 electrodes over FMC.
3.3 Performance from the best five micro-electrodes
Selecting the five electrodes over FMC with best overall accuracy improved average classification accuracy compared with using all 16 electrodes. This improvement was consistent in all combinations of words and ranged from 4.0 percentage points (89.6 ± 10.8% accuracy, median 90.0, for two-word combinations) up to 20.0 percentage points (48% for the ten-word combination), with 13.5 ± 5.2 percentage points difference on average (figure 4). Classification accuracies were 16.1 ± 2.3 percentage points higher, on average, when using features from the best five micro-electrodes over FMC simultaneously versus using features from these same micro-electrodes independently. In contrast, selecting the five highest-performing electrodes over Wernicke’s area did not substantially improve performance (1.3 ± 0.7 percentage-point increase on average). Using features from the best five electrodes over Wernicke’s area simultaneously resulted in classification accuracies 5.0 ± 0.3 percentage points higher than using features from the same electrodes independently.
To further investigate the importance of time and frequency parameters to the classification process, we performed two additional analyses. Classification accuracy was evaluated using each of the features individually for the two-word classification case. This analysis revealed that at 20 Hz, accuracy began to rise above chance, peaking at 110 Hz and remaining above chance through 500 Hz. Classification accuracy was also evaluated using varying time windows for the two-word classification case. Comparing windows of 0.1, 0.25, 0.5, and 0.75 seconds, we observed median accuracies of 74.0%, 81.2%, 89.6%, and 88.1% respectively using the best five channels.
3.4 Word-by-word analysis
To illustrate general ability to discriminate word pairs, decodability matrices were constructed for micro-electrodes over FMC (figure 5a) and over Wernicke’s area (figure 5b). In these figures, the classification accuracy for a pair of words is indicated at the intersection of the two words’ row and column indices. Data were obtained from classification using features from the best five electrodes over each area. Over FMC, classification accuracy ranged from 53% (“hello” vs. “more”) to 100% accuracy (“yes” vs. “no”, “hot” vs. “hungry”, and others). While a few of these word pairs were not easily distinguished by the classifier, 40 of the 45 possible pairs had 80% classification accuracy or better. Over Wernicke’s area, classification accuracy ranged from 36.7% (“hot” vs. “goodbye”) to 100% (“yes” vs. “hot”, “no” vs. “hot”, and others), and 15 of the 45 word pairs had 80% classification accuracy or better.
Figure 5.

Decodability matrices for FMC and Wernicke’s area. The classification accuracies of all word pairs are shown for FMC (left) and Wernicke’s area (right) using features from the best five electrodes over each area. In each square plot, the intersection of a row and column indicates the classifier’s accuracy for that word pair. The diagonal is marked with black squares indicating the irrelevant case of classifying a word against itself.
3.5 Topography and Scale
Neighbouring electrodes classified different words most accurately. For example, one electrode over FMC classified the word “no” with 89.3% average accuracy (average of all two-word classifications involving the word “no”), while a neighbouring electrode just 1 mm away classified the word “less” with 87.8% average accuracy (figure 6a, middle two electrodes in the top row). Of the 16 electrodes over FMC, 15 had a neighbouring electrode within 1.4 mm (including diagonally situated neighbours) whose most accurately classified word, with at least 75% accuracy, was different. Fourteen of the 16 electrodes over Wernicke’s area met the same criterion (figure 6b for reference).
Figure 6.

Topography of performance by individual electrode and word. a, The topography of classification accuracy is shown for the micro-electrodes resting over FMC. b, The topography of classification accuracy is shown for the micro-electrodes resting over Wernicke’s area.
Conversely, neighbouring electrodes classified the same word differently. For example, one electrode over FMC classified the word “hot” with 84.4% average accuracy while a neighbouring electrode 1 mm away classified the same word with only 56.7% average accuracy (second column, top two electrodes). Eight out of 16 electrodes over FMC and five out of 16 electrodes over Wernicke’s area classified their most accurate word at least 15 percentage points higher than a neighbouring electrode classified the same word.
4. Discussion
4.1 Surface LFPs support fast, accurate BCI
We have demonstrated that classification of articulated words from surface LFPs recorded on micro-electrocorticography grids can be performed both rapidly, i.e., within 500 msec of the start of articulation, and with accuracy well above the level of chance. No patient training preceded the initial experimental session, so that classification was performed on features likely representing intuitive language processes. These results demonstrate the potential of using micro-electrodes designed to match the scale of cortical information processing in BCI applications.
4.2 Scale of information processing
Studies of ECoG signals have shown that gamma band modulation is correlated to motor actuation and occurs in more localized fashion, both temporally and spatially, than is evident in lower oscillatory bands [30, 32, 44, 46, 50, 51]. A common electrophysiological explanation for this behaviour is that gamma oscillations represent the synchronizing (or synchronous) interactions of neuronal assemblies, perhaps cortical columns or macrocolumns, engaged in the parallel processing of common stimuli [38, 41, 52–55]. The coincidence of gamma-band event-related synchronization with motor tasks and the evidence for temporally discrete and topographically consistent modulation suggest this neural source is important to BCI operation. Recording these modulations at the appropriate scale requires grids of micro-electrodes approximated to the underlying spatiotemporal processing scale.
Using micro-electrodes approximated to the scale of cortical processing, we found variation of nearly 30% in the classification accuracies (for the same word) of individual electrodes spaced 1 mm apart. Within a 9-mm2 space over FMC, almost every electrode had a neighbour within 1.4 mm whose most accurately classified word was not the same. This result suggests that in many cases electrodes recorded activity associated with features not as strongly represented in the data recorded by other nearby micro-electrodes. Recoding LFPs at the spatial scale of cortical processing assemblies appears to yield a broad set of relevant, discriminatory features that could serve as the underpinnings of an intuitive and rapid BCI for communication. While optimal parameters of spacing and electrode count are the subject of recent and ongoing studies [56], our findings motivate continued investigation into using micro-ECoG for BCI applications.
4.3 Differences in results from Wernicke’s area and FMC
While the placement of the micro-electrode arrays depended entirely on clinical requirements, specific locations of the grids were chosen to evaluate the potential for deciphering activity from two diverse components of cortical language processing. Classical models of cortical language processing have interpreted aphasic evidence to suggest a conduction path from Wernicke’s area to sensorimotor cortex [57, 58], with more recent studies confirming the correlation between superior temporal and inferior frontal regions of cortex [59].
The FMC is known to be involved in controlling the musculature of speech [60, 61], and gamma-band oscillations have been shown to modulate during speech tasks [33]. The considerable range of muscles involved in speech [62] could mean that similar patterns of such neural activity in FMC correspond to similar articulations. The parallel consequence of this relationship, however, is that vocal dynamics such as pitch or inflection may be the result of dissimilar cortical representation and therefore present a potential confound to the classification process. Regardless, the ability of the PCA classifier to distinguish words particularly well from data recorded over FMC may be due to the wide range of cortical representations needed to control the musculature of speech. The varying accuracies of proximal micro-electrodes for different words suggest that subunits within FMC may process unique features of articulation, which allowed the classifier to differentiate cortical responses between words.
Wernicke’s area has been identified as an important element in high-level cortical language processing [35, 63–65]. Recent studies have shown that distinct subsystems of Wernicke’s region activate separately during reception and processing of speech [35, 66] and that Wernicke’s area is involved in word and sentence repetition [67, 68]. From the Wernicke’s area recordings, we observed substantial broadband spectral power during conversation and while receiving verbal feedback, but less broadband spectral power during word repetitions. However, the Wernicke’s data recorded during word repetitions still supported classification accuracies above the level of chance, albeit with less accuracy than was achieved from FMC. Given that the neural signals used in the classification analysis were recorded during the actual vocalization of words, the usefulness of neural signals from Wernicke’s area in classification may result from the patient comprehending his own voice [69, 70].
There was less variation in classification accuracies achieved using individual micro-electrode over Wernicke’s area compared with FMC. As described earlier, selecting the best five micro-electrodes did not change accuracy significantly compared with using all 16 micro-electrodes, and testing those five micro-electrodes individually also did not change accuracy. This finding was opposite that of micro-electrodes over FMC, which presented a certain amount of variety across the array. These contrasting observations suggest a more concrete mapping of the neural signal onto patterns of speech articulation in the FMC and a more distributed and abstract encoding of speech in Wernicke’s area.
We conclude that neural activity in FMC is a good candidate for interfacing to communication prostheses. The relatively straightforward mapping of neural activity to motor output suggests that other speech motor and pre-motor areas, such as Broca’s area, may also be good candidates for communication BCIs. In the context of our experimental paradigm and classification we found that Wernicke’s area did not perform as well as FMC in the classification task. However, it is likely, given a more cognitive experimental paradigm and different classification schemes, Wernicke’s area would perform as well as or better than FMC.
4.4 Limitations
4.4.1 Epilepsy may have re-arranged language centres
The patient involved in this study suffered from medically refractory epilepsy for many years. While there are many consequences of this condition, one particularly relevant potential outcome is the remapping of language-relevant cortical areas. Insofar as we have been able to determine using evidence from pre- and post-surgical x-rays and photographs, our anatomical labels are correct; however, such re-mapping could affect conclusions about the functional differences in the activity recorded from electrodes believed to rest over FMC and Wernicke’s area.
4.4.2 Learning and memory over multiple sessions
The nature of the experimental paradigm was such that the patient repeated a few words many times over several consecutive days. It is possible that cognitive language processes gave way to memory-based language processes after many repetitions. While difficult to confirm or disprove, such a change in cortical function could affect cortical representations of speech and could be responsible for less accuracy in the classification of words. This line of reasoning may be especially true for neural activity recorded over Wernicke’s area which is involved in more semantic processing. The low cognitive effort required to perform the experimental task likely did not engage Wernicke’s area. Verb generation, picture labelling, and other more cognitive tasks have been shown to elicit cortical processing rhythms which may be useful in speech classification contexts [34].
4.4.3 Rate limitations
Disregarding the limitations of the dictionary size temporarily, the 500 msec delay between cortical processing and classifier output may be too slow to support conversational speech. Other work has demonstrated a fast 30 msec delay from action potential firing from single units to first audible output [9] for a trajectory-based decode system—a different problem than the decision-based algorithm presented in this study. Furthermore, the nature of a real-time decode mandates rapid sensory feedback for online control, whereas such rapid feedback is not as important for discrete word classification.
Using smaller time windows resulted in lower classification accuracies in this study, these results could be significantly improved by replacing the straightforward nearest-centroid clustering method with a more advanced decision algorithm. For example, hidden Markov models (HMM) or support vector machines (SVM) could be trained to discriminate spatiotemporal patterns more efficiently than by simply maximizing variance using PCA. Applying these methods to the data could both improve the accuracy of the classification and decrease the delay from cortical processing to audible output, potentially offering speech rates comparable to those required for conversation. These tools could allow online decode of speech using frequency-domain features, similar to work demonstrated using action potential firing rates [9].
4.5 Future work
The results of the current study were obtained without any significant patient training. With some preparation, patients could adapt their neural processes to the performance of the classifier and learn to stereotype word articulation. More sophisticated classification algorithms could take advantage of stereotyped articulation to adapt to subtle differences in the cortical representations of different words. More sophisticated feature selection could improve performance as well.
The highest-performing classifications in these results were obtained from cases where classification discriminated between just two words. Although more advanced methods could likely improve accuracy when more words are present, a system performing binary classification could employ straightforward algorithms and require minimal patient training. For example, a method of hierarchical selection, e.g. [11], could provide simple patient control. Investigation into increasing accuracy for larger dictionaries could also provide sufficiently enhanced patient experience to justify the extra effort.
The invasiveness of the micro-electrode grids could be further reduced with epidural placement, as has been shown for similar recording devices [56, 71]. Furthermore, a wireless implementation of the system might be practical given the relatively low bandwidth required to capture cortical surface LFPs. A wireless system able to record high-resolution cortical surface potentials could provide a reasonable balance of invasiveness and performance and improve the quality of life for locked-in patients and others unable to communicate on their own.
The tight inter-electrode spacing and small number of electrodes limited the spatial coverage of the micro-electrode grid. An optimized grid design with more electrodes would likely cover a larger number of relevant neural signals and allow better decoding accuracy. Optimal inter-electrode spacing and coverage is an important area for future research that will have wide implications in feature selection and classification algorithms.
5. Conclusion
In sum, we have demonstrated the capabilities of cortical surface LFPs recorded on micro-ECoG grids in classifying spoken words. Having micro-ECoG grids designed to approximate the columnar scale of cortical information processing is a key element in acquiring a rich set of features upon which a communications BCI can operate. The classification of speech using micro-ECoG appears to be a viable approach to restoring limited but useful communication to those suffering from locked-in syndrome.
Supplementary Material
Raw data, spectrogram, and mean power during conversation and task on day 2. a, Audio waveform of conversation and verbal task. b, Normalized spectrogram of neural data recorded from a single electrode over face motor cortex during the same time period shown in (a). c, Normalized spectrogram of neural data recorded from a single electrode over Wernicke’s area during the same time period shown in (a). d, Mean power and standard error between 70 and 200 Hz for the 16 electrodes over FMC and the 16 electrodes over Wernicke’s area.
Raw data, spectrogram, and mean power during conversation and task on day 3. a, Audio waveform of conversation and verbal task. b, Normalized spectrogram of neural data recorded from a single electrode over face motor cortex during the same time period shown in (a). c, Normalized spectrogram of neural data recorded from a single electrode over Wernicke’s area during the same time period shown in (a). d, Mean power and standard error between 70 and 200 Hz for the 16 electrodes over FMC and the 16 electrodes over Wernicke’s area.
Raw data, spectrogram, and mean power during conversation and task on day 4. a, Audio waveform of conversation and verbal task. b, Normalized spectrogram of neural data recorded from a single electrode over face motor cortex during the same time period shown in (a). c, Normalized spectrogram of neural data recorded from a single electrode over Wernicke’s area during the same time period shown in (a). d, Mean power and standard error between 70 and 200 Hz for the 16 electrodes over FMC and the 16 electrodes over Wernicke’s area.
Acknowledgments
This work was supported in part by a Utah Research Foundation grant, DARPA RP2009 funding, and NIH R01EY019363 (B.G.), and the Engineering Research Centers Program of the National Science Foundation under Award Number EEC-9986866 (R.B.). The authors thank Kristin Kraus for her editorial assistance, the EEG staff for assistance in conducting the study, and the patient who agreed to participate in the study.
References
- 1.Smith E, Delargy M. Locked-in syndrome. BMJ. 2005 Feb 19;330(7488):406–9. doi: 10.1136/bmj.330.7488.406. [DOI] [PMC free article] [PubMed] [Google Scholar]
- 2.Majaranta P, Räihä K-J. Proceedings of the 2002 symposium on Eye tracking research & applications. New Orleans, Louisiana: ACM; 2002. Twenty years of eye typing: systems and design issues; pp. 15–22. 507076. [Google Scholar]
- 3.Bauer G, Gerstenbrand F, Rumpl E. Varieties of the locked-in syndrome. J Neurol. 1979 Aug;221(2):77–91. doi: 10.1007/BF00313105. [DOI] [PubMed] [Google Scholar]
- 4.Leon-Carrion J, van Eeckhout P, Dominguez-Morales Mdel R, Perez-Santamaria FJ. The locked-in syndrome: a syndrome looking for a therapy. Brain Inj. 2002 Jul;16(7):571–82. doi: 10.1080/02699050110119781. [DOI] [PubMed] [Google Scholar]
- 5.Birbaumer N. Breaking the silence: brain-computer interfaces (BCI) for communication and motor control. Psychophysiology. 2006 Nov;43(6):517–32. doi: 10.1111/j.1469-8986.2006.00456.x. [DOI] [PubMed] [Google Scholar]
- 6.Hochberg LR, Serruya MD, Friehs GM, Mukand JA, Saleh M, Caplan AH, et al. Neuronal ensemble control of prosthetic devices by a human with tetraplegia. Nature. 2006 Jul 13;442(7099):164–71. doi: 10.1038/nature04970. [DOI] [PubMed] [Google Scholar]
- 7.Bartels J, Andreasen D, Ehirim P, Mao H, Seibert S, Wright EJ, et al. Neurotrophic electrode: method of assembly and implantation into human motor speech cortex. Journal of Neuroscience Methods. 2008;174:168–76. doi: 10.1016/j.jneumeth.2008.06.030. [DOI] [PMC free article] [PubMed] [Google Scholar]
- 8.Kennedy PR, Bakay RA, Moore MM, Adams K, Goldwaithe J. Direct control of a computer from the human central nervous system. IEEE transactions on rehabilitation engineering: a publication of the IEEE Engineering in Medicine and Biology Society. 2000;8:198–202. doi: 10.1109/86.847815. [DOI] [PubMed] [Google Scholar]
- 9.Guenther FH, Brumberg JS, Wright EJ, Nieto-Castanon A, Tourville JA, Panko M, et al. A wireless brain-machine interface for real-time speech synthesis. PloS one. 2009;4:e8218. doi: 10.1371/journal.pone.0008218. [DOI] [PMC free article] [PubMed] [Google Scholar]
- 10.Guenther FH, Ghosh SS, Tourville JA. Neural modeling and imaging of the cortical interactions underlying syllable production. Brain and language. 2006;96:280–301. doi: 10.1016/j.bandl.2005.06.001. [DOI] [PMC free article] [PubMed] [Google Scholar]
- 11.Birbaumer N, Ghanayim N, Hinterberger T, Iversen I, Kotchoubey B, Kübler A, et al. A spelling device for the paralysed. Nature. 1999;398:297–8. doi: 10.1038/18581. [DOI] [PubMed] [Google Scholar]
- 12.Daly JJ, Wolpaw JR. Brain-computer interfaces in neurological rehabilitation. Lancet Neurol. 2008 Nov;7(11):1032–43. doi: 10.1016/S1474-4422(08)70223-0. [DOI] [PubMed] [Google Scholar]
- 13.Donchin E, Spencer KM, Wijesinghe R. The mental prosthesis: assessing the speed of a P300-based brain-computer interface. IEEE Trans Rehabil Eng. 2000 Jun;8(2):174–9. doi: 10.1109/86.847808. [DOI] [PubMed] [Google Scholar]
- 14.Farwell LA, Donchin E. Talking off the top of your head: toward a mental prosthesis utilizing event-related brain potentials. Electroencephalogr Clin Neurophysiol. 1988 Dec;70(6):510–23. doi: 10.1016/0013-4694(88)90149-6. [DOI] [PubMed] [Google Scholar]
- 15.Kübler A, Kotchoubey B, Hinterberger T, Ghanayim N, Perelmouter J, Schauer M, et al. The thought translation device: a neurophysiological approach to communication in total motor paralysis. Experimental Brain Research. 1999;124:223–32. doi: 10.1007/s002210050617. [DOI] [PubMed] [Google Scholar]
- 16.Nijboer F, Sellers EW, Mellinger J, Jordan MA, Matuz T, Furdea A, et al. A P300-based brain-computer interface for people with amyotrophic lateral sclerosis. Clin Neurophysiol. 2008 Aug;119(8):1909–16. doi: 10.1016/j.clinph.2008.03.034. [DOI] [PMC free article] [PubMed] [Google Scholar]
- 17.Wolpaw JR, McFarland DJ. Multichannel EEG-based brain-computer communication. Electroencephalogr Clin Neurophysiol. 1994 Jun;90(6):444–9. doi: 10.1016/0013-4694(94)90135-x. [DOI] [PubMed] [Google Scholar]
- 18.McFarland DJ, Krusienski DJ, Sarnacki WA, Wolpaw JR. Emulation of computer mouse control with a noninvasive brain-computer interface. J Neural Eng. 2008 Jun;5(2):101–10. doi: 10.1088/1741-2560/5/2/001. [DOI] [PMC free article] [PubMed] [Google Scholar]
- 19.Zanos S, Miller KJ, Ojemann JG. Electrocorticographic spectral changes associated with ipsilateral individual finger and whole hand movement. Conf Proc IEEE Eng Med Biol Soc. 2008;2008:5939–42. doi: 10.1109/IEMBS.2008.4650569. [DOI] [PubMed] [Google Scholar]
- 20.Miller KJ, Zanos S, Fetz EE, den Nijs M, Ojemann JG. Decoupling the cortical power spectrum reveals real-time representation of individual finger movements in humans. The Journal of Neuroscience. 2009;29:3132–7. doi: 10.1523/JNEUROSCI.5506-08.2009. [DOI] [PMC free article] [PubMed] [Google Scholar]
- 21.Scherer R, Zanos SP, Miller KJ, Rao RPN, Ojemann JG. Classification of contralateral and ipsilateral finger movements for electrocorticographic brain-computer interfaces. Neurosurgical Focus. 2009;27:E12. doi: 10.3171/2009.4.FOCUS0981. [DOI] [PubMed] [Google Scholar]
- 22.Bougrain L, Liang N. Band-specific features improve Finger Flexion Prediction from ECoG. Jornadas Argentinas sobre Interfaces Cerebro Computadora. 2009;2009:1–4. [Google Scholar]
- 23.Pistohl T, Ball T, Schulze-Bonhage A, Aertsen A, Mehring C. Prediction of arm movement trajectories from ECoG-recordings in humans. Journal of Neuroscience Methods. 2008;167:105–14. doi: 10.1016/j.jneumeth.2007.10.001. [DOI] [PubMed] [Google Scholar]
- 24.Yanagisawa T, Hirata M, Saitoh Y, Kato A, Shibuya D, Kamitani Y, et al. Neural decoding using gyral and intrasulcal electrocorticograms. Neuroimage. 2009 May 1;45(4):1099–106. doi: 10.1016/j.neuroimage.2008.12.069. [DOI] [PubMed] [Google Scholar]
- 25.Sanchez JC, Gunduz A, Carney PR, Principe JC. Extraction and Localization of Mesoscopic Motor Control Signals for Human ECoG Neuroprosthetics. Journal of Neuroscience Methods. 2008;167:63–81. doi: 10.1016/j.jneumeth.2007.04.019. [DOI] [PubMed] [Google Scholar]
- 26.Kellis SS, House PA, Thomson KE, Brown R, Greger B. Human neocortical electrical activity recorded on nonpenetrating microwire arrays: applicability for neuroprostheses. Neurosurgical focus. 2009;27:E9. doi: 10.3171/2009.4.FOCUS0974. [DOI] [PMC free article] [PubMed] [Google Scholar]
- 27.Schalk G, Kubanek J, Miller KJ, Anderson NR, Leuthardt EC, Ojemann JG, et al. Decoding two-dimensional movement trajectories using electrocorticographic signals in humans. J Neural Eng. 2007 Sep;4(3):264–75. doi: 10.1088/1741-2560/4/3/012. [DOI] [PubMed] [Google Scholar]
- 28.Schalk G, Miller KJ, Anderson NR, Wilson JA, Smyth MD, Ojemann JG, et al. Two-dimensional movement control using electrocorticographic signals in humans. J Neural Eng. 2008 Mar;5(1):75–84. doi: 10.1088/1741-2560/5/1/008. [DOI] [PMC free article] [PubMed] [Google Scholar]
- 29.Lal TN, Hinterberger T, Widman G, Schroeder M, Hill J, Rosenstiel W, et al. Methods Towards Invasive Human Brain Computer Interfaces. 2005. [Google Scholar]
- 30.Leuthardt EC, Schalk G, Wolpaw JR, Ojemann JG, Moran DW. A brain-computer interface using electrocorticographic signals in humans. Journal of Neural Engineering. 2004;1:63–71. doi: 10.1088/1741-2560/1/2/001. [DOI] [PubMed] [Google Scholar]
- 31.Blakely T, Miller KJ, Rao RP, Holmes MD, Ojemann JG. Localization and classification of phonemes using high spatial resolution electrocorticography (ECoG) grids. Conf Proc IEEE Eng Med Biol Soc. 2008;2008:4964–7. doi: 10.1109/IEMBS.2008.4650328. [DOI] [PubMed] [Google Scholar]
- 32.Crone N, Miglioretti D, Gordon B, Lesser R. Functional mapping of human sensorimotor cortex with electrocorticographic spectral analysis. II. Event-related synchronization in the gamma band. Brain. 1998;121:2301–15. doi: 10.1093/brain/121.12.2301. [DOI] [PubMed] [Google Scholar]
- 33.Crone NE, Hao L, Hart J, Jr, Boatman D, Lesser RP, Irizarry R, et al. Electrocorticographic gamma activity during word production in spoken and sign language. Neurology. 2001 Dec 11;57(11):2045–53. doi: 10.1212/wnl.57.11.2045. [DOI] [PubMed] [Google Scholar]
- 34.Edwards E, Nagarajan SS, Dalal SS, Canolty RT, Kirsch HE, Barbaro NM, et al. Spatiotemporal imaging of cortical activation during verb generation and picture naming. Neuroimage. 2010 Mar;50(1):291–301. doi: 10.1016/j.neuroimage.2009.12.035. [DOI] [PMC free article] [PubMed] [Google Scholar]
- 35.Towle VL, Yoon H-A, Castelle M, Edgar JC, Biassou NM, Frim DM, et al. ECoG gamma activity during a language task: differentiating expressive and receptive speech areas. Brain. 2008;131:2013–27. doi: 10.1093/brain/awn147. [DOI] [PMC free article] [PubMed] [Google Scholar]
- 36.Cooper R, Winter AL, Crow HJ, Walter WG. Comparison of Subcortical, Cortical and Scalp Activity Using Chronically Indwelling Electrodes in Man. Electroencephalogr Clin Neurophysiol. 1965 Feb;18:217–28. doi: 10.1016/0013-4694(65)90088-x. [DOI] [PubMed] [Google Scholar]
- 37.Pfurtscheller G, Cooper R. Frequency dependence of the transmission of the EEG from cortex to scalp. Electroencephalogr Clin Neurophysiol. 1975 Jan;38(1):93–6. doi: 10.1016/0013-4694(75)90215-1. [DOI] [PubMed] [Google Scholar]
- 38.Crone NE, Sinai A, Korzeniewska A. Event-Related Dynamics of Brain Oscillations. Elsevier; 2006. [Google Scholar]
- 39.Menon V, Freeman WJ, Cutillo BA, Desmond JE, Ward MF, Bressler SL, et al. Spatio-temporal correlations in human gamma band electrocorticograms. Electroencephalography and Clinical Neurophysiology. 1996;98:89–102. doi: 10.1016/0013-4694(95)00206-5. [DOI] [PubMed] [Google Scholar]
- 40.Buzsaki G, Chrobak JJ. Temporal structure in spatially organized neuronal ensembles: a role for interneuronal networks. Curr Opin Neurobiol. 1995 Aug;5(4):504–10. doi: 10.1016/0959-4388(95)80012-3. [DOI] [PubMed] [Google Scholar]
- 41.Singer W. Synchronization of cortical activity and its putative role in information processing and learning. Annu Rev Physiol. 1993;55:349–74. doi: 10.1146/annurev.ph.55.030193.002025. [DOI] [PubMed] [Google Scholar]
- 42.Womelsdorf T, Schoffelen JM, Oostenveld R, Singer W, Desimone R, Engel AK, et al. Modulation of neuronal interactions through neuronal synchronization. Science. 2007 Jun 15;316(5831):1609–12. doi: 10.1126/science.1139597. [DOI] [PubMed] [Google Scholar]
- 43.Leuthardt EC, Freudenberg Z, Bundy D, Roland J. Microscale recording from human motor cortex: implications for minimally invasive electrocorticographic brain-computer interfaces. Neurosurgical focus. 2009;27:E10. doi: 10.3171/2009.4.FOCUS0980. [DOI] [PMC free article] [PubMed] [Google Scholar]
- 44.Miller KJ, Leuthardt EC, Schalk G, Rao RPN, Anderson NR, Moran DW, et al. Spectral changes in cortical surface potentials during motor movement. The Journal of neuroscience: the official journal of the Society for Neuroscience. 2007;27:2424–32. doi: 10.1523/JNEUROSCI.3886-06.2007. [DOI] [PMC free article] [PubMed] [Google Scholar]
- 45.Ohara S, Ikeda A, Kunieda T, Yazawa S, Baba K, Nagamine T, et al. Movement-related change of electrocorticographic activity in human supplementary motor area proper. Brain. 2000 Jun;123( Pt 6):1203–15. doi: 10.1093/brain/123.6.1203. [DOI] [PubMed] [Google Scholar]
- 46.Pfurtscheller G, Graimann B, Huggins JE, Levine SP, Schuh LA. Spatiotemporal patterns of beta desynchronization and gamma synchronization in corticographic data during self-paced movement. Clinical Neurophysiology. 2003;114:1226–36. doi: 10.1016/s1388-2457(03)00067-1. [DOI] [PubMed] [Google Scholar]
- 47.Kellis S, Miller K, Thomson K, Brown R, House P, Greger B. Classification of spoken words using surface local field potentials. 32nd Annual International Conference of the IEEE Engineering in Medicine and Biology Society (EMBC); Buenos Aires, Argentina: IEEE; 2010. [DOI] [PubMed] [Google Scholar]
- 48.Hermes D, Miller KJ, Noordmans HJ, Vansteensel MJ, Ramsey NF. Automated electrocorticographic electrode localization on individually rendered brain surfaces. J Neurosci Methods. 2010 Jan 15;185(2):293–8. doi: 10.1016/j.jneumeth.2009.10.005. [DOI] [PubMed] [Google Scholar]
- 49.Jolliffe IT. Principal Component Analysis. 2. New York: Springer; 2002. [Google Scholar]
- 50.Canolty RT, Edwards E, Dalal SS, Soltani M, Nagarajan SS, Kirsch HE, et al. High gamma power is phase-locked to theta oscillations in human neocortex. Science. 2006 Sep 15;313(5793):1626–8. doi: 10.1126/science.1128115. [DOI] [PMC free article] [PubMed] [Google Scholar]
- 51.Crone N, Miglioretti D, Gordon B, Sieracki J, Wilson M, Uematsu S, et al. Functional mapping of human sensorimotor cortex with electrocorticographic spectral analysis. I. Alpha and beta event- related desynchronization. Brain. 1998;121:2271–99. doi: 10.1093/brain/121.12.2271. [DOI] [PubMed] [Google Scholar]
- 52.Mountcastle VB. Modality and topographic properties of single neurons of cat’s somatic sensory cortex. J Neurophysiol. 1957 Jul;20(4):408–34. doi: 10.1152/jn.1957.20.4.408. [DOI] [PubMed] [Google Scholar]
- 53.Mountcastle VB. Brain mechanisms for directed attention. J R Soc Med. 1978 Jan;71(1):14–28. doi: 10.1177/014107687807100105. [DOI] [PMC free article] [PubMed] [Google Scholar]
- 54.Singer W, Gray CM. Visual feature integration and the temporal correlation hypothesis. Annu Rev Neurosci. 1995;18:555–86. doi: 10.1146/annurev.ne.18.030195.003011. [DOI] [PubMed] [Google Scholar]
- 55.von der Malsburg C. Binding in models of perception and brain function. Curr Opin Neurobiol. 1995 Aug;5(4):520–6. doi: 10.1016/0959-4388(95)80014-x. [DOI] [PubMed] [Google Scholar]
- 56.Slutzky MW, Jordan LR, Krieg T, Chen M, Mogul DJ, Miller LE. Optimal spacing of surface electrode arrays for brain-machine interface applications. J Neural Eng. 2010 Apr;7(2):26004. doi: 10.1088/1741-2560/7/2/026004. [DOI] [PMC free article] [PubMed] [Google Scholar]
- 57.Lichtheim L. On Aphasia. Brain. 1885;7:433–84. [Google Scholar]
- 58.Wernicke C. Der aphasische Symptomenkomplex. Breslau: Cohn und Weigert; 1874. [Google Scholar]
- 59.Karbe H, Herholz K, Weber-Luxenburger G, Ghaemi M, Heiss WD. Cerebral networks and functional brain asymmetry: evidence from regional metabolic changes during word repetition. Brain Lang. 1998 Jun 1;63(1):108–21. doi: 10.1006/brln.1997.1937. [DOI] [PubMed] [Google Scholar]
- 60.Murphy K, Corfield DR, Guz A, Fink GR, Wise RJ, Harrison J, et al. Cerebral areas associated with motor control of speech in humans. Journal of Applied Physiology. 1997;83:1438–47. doi: 10.1152/jappl.1997.83.5.1438. [DOI] [PubMed] [Google Scholar]
- 61.Penfield W, Boldrey E. Somatic motor and sensory representation in the cerebral cortex of man as studied by electrical stimulation. Brain. 1937;60:389–443. [Google Scholar]
- 62.Smith A. Speech motor development: Integrating muscles, movements, and linguistic units. J Commun Disord. 2006 Sep-Oct;39(5):331–49. doi: 10.1016/j.jcomdis.2006.06.017. [DOI] [PubMed] [Google Scholar]
- 63.Bogen JE, Bogen GM. Wernicke’s Region--Where Is It? Annals of the New York Academy of Sciences. 1976;280:834–43. doi: 10.1111/j.1749-6632.1976.tb25546.x. [DOI] [PubMed] [Google Scholar]
- 64.Sahin NT, Pinker S, Cash SS, Schomer D, Halgren E. Sequential processing of lexical, grammatical, and phonological information within Broca’s area. Science. 2009 Oct 16;326(5951):445–9. doi: 10.1126/science.1174481. [DOI] [PMC free article] [PubMed] [Google Scholar]
- 65.Ojemann GA. Cortical organization of language. The Journal of Neuroscience. 1991;11:2281–7. doi: 10.1523/JNEUROSCI.11-08-02281.1991. [DOI] [PMC free article] [PubMed] [Google Scholar]
- 66.Wise RJS. Separate neural subsystems within `Wernicke’s area’. Brain. 2001;124:83–95. doi: 10.1093/brain/124.1.83. [DOI] [PubMed] [Google Scholar]
- 67.Selnes OA, Knopman DS, Niccum N, Rubens AB. The critical role of Wernicke’s area in sentence repetition. Ann Neurol. 1985 Jun;17(6):549–57. doi: 10.1002/ana.410170604. [DOI] [PubMed] [Google Scholar]
- 68.Naeser MA, Gaddie A, Palumbo CL, Stiassny-Eder D. Late recovery of auditory comprehension in global aphasia. Improved recovery observed with subcortical temporal isthmus lesion vs Wernicke’s cortical area lesion. Arch Neurol. 1990 Apr;47(4):425–32. doi: 10.1001/archneur.1990.00530040073021. [DOI] [PubMed] [Google Scholar]
- 69.Hirano S, Kojima H, Naito Y, Honjo I, Kamoto Y, Okazawa H, et al. Cortical processing mechanism for vocalization with auditory verbal feedback. Neuroreport. 1997 Jul 7;8(9–10):2379–82. doi: 10.1097/00001756-199707070-00055. [DOI] [PubMed] [Google Scholar]
- 70.McGuire PK, Silbersweig DA, Frith CD. Functional neuroanatomy of verbal self-monitoring. Brain. 1996 Jun;119( Pt 3):907–17. doi: 10.1093/brain/119.3.907. [DOI] [PubMed] [Google Scholar]
- 71.Leuthardt EC, Miller KJ, Schalk G, Rao RP, Ojemann JG. Electrocorticography-based brain computer interface--the Seattle experience. IEEE Trans Neural Syst Rehabil Eng. 2006 Jun;14(2):194–8. doi: 10.1109/TNSRE.2006.875536. [DOI] [PubMed] [Google Scholar]
Associated Data
This section collects any data citations, data availability statements, or supplementary materials included in this article.
Supplementary Materials
Raw data, spectrogram, and mean power during conversation and task on day 2. a, Audio waveform of conversation and verbal task. b, Normalized spectrogram of neural data recorded from a single electrode over face motor cortex during the same time period shown in (a). c, Normalized spectrogram of neural data recorded from a single electrode over Wernicke’s area during the same time period shown in (a). d, Mean power and standard error between 70 and 200 Hz for the 16 electrodes over FMC and the 16 electrodes over Wernicke’s area.
Raw data, spectrogram, and mean power during conversation and task on day 3. a, Audio waveform of conversation and verbal task. b, Normalized spectrogram of neural data recorded from a single electrode over face motor cortex during the same time period shown in (a). c, Normalized spectrogram of neural data recorded from a single electrode over Wernicke’s area during the same time period shown in (a). d, Mean power and standard error between 70 and 200 Hz for the 16 electrodes over FMC and the 16 electrodes over Wernicke’s area.
Raw data, spectrogram, and mean power during conversation and task on day 4. a, Audio waveform of conversation and verbal task. b, Normalized spectrogram of neural data recorded from a single electrode over face motor cortex during the same time period shown in (a). c, Normalized spectrogram of neural data recorded from a single electrode over Wernicke’s area during the same time period shown in (a). d, Mean power and standard error between 70 and 200 Hz for the 16 electrodes over FMC and the 16 electrodes over Wernicke’s area.