

Abstract
Genetic variation of the α-synuclein gene (SNCA) is known to cause familial parkinsonism, however the role of SNCA variants in sporadic Parkinson’s disease (PD) remains elusive. The present study identifies an association of common SNCA polymorphisms with disease susceptibility in a series of Irish PD patients. There is evidence for association with alternate regions, of protection and risk which may act independently/synergistically, within the promoter region (Rep1; OR: 0.59, 95% CI: 0.37 – 0.84) and the 3′UTR of the gene (rs356165; OR: 1.67, 95% CI: 1.08 – 2.58). Given previous reports of association a collaborative effort is required which may exploit global linkage disequilibrium patterns for SNCA and standardise polymorphic markers used in each population. It is now crucial to identify the susceptibility allele and elucidate its functionality which may generate a therapeutic target for PD.
Keywords: α-Synuclein, polymorphism, Parkinson’s disease
Introduction
Genomic variations at the α-synuclein locus (SNCA) are observed to cause familial forms of parkinsonism (Chartier-Harlin et al., 2004; Ibanez et al., 2004; Nishioka et al., 2006; Singleton et al., 2003). Monoallelic triplication of SNCA (four copies) was first described in one kindred with fulminant manifestation of early-onset parkinsonism with dementia (Muenter et al., 1998). Subsequently SNCA duplication patients (three copies) were identified who present with a less severe disease that is more reminiscent of typical Parkinson’s disease (PD) (Chartier-Harlin et al., 2004; Ibanez et al., 2004). The symptoms appear to correlate with SNCA gene expression and the level of α-synuclein protein (Farrer et al., 2004). Familial forms of disease are rare and only a handful of SNCA multiplication kindreds have been reported, however the identification of familial genes has provided great insight into parkinsonism pathogenesis and generated mechanistic hypothesises for PD (Farrer, 2006).
PD is one of the most prevalent age-related neurodegenerative disorders, with approximately ~2% of the population older than sixty-five years being affected. Neither SNCA multiplication nor the three identified pathogenic substitutions (A30P, E46K and A53T) are a cause of typical late-onset sporadic PD (Farrer, 2006). However a modest over-expression of SNCA over the lifetime of an individual may increase risk of developing PD. This hypothesis is promoted by association of common polymorphic variants within the SNCA locus that may effect a differential transcriptional expression in vitro (Chiba-Falek and Nussbaum, 2001; Kobayashi et al., 2006; Maraganore et al., 2006; Mizuta et al., 2006; Mueller et al., 2005; Pals et al., 2004).
Herein we describe a study examining the association of a set of 14 polymorphic markers spanning the haplotypic structure of the SNCA locus within a group of Irish PD patients and healthy subjects.
Subjects and Methods
Blood samples were obtained from 186 unrelated clinically diagnosed Irish PD patients (61% female, 39% male with mean age of 61 ± 12 SD years). The mean age at onset was 50 ± 11 years in the 139 (75%) patients for whom this information was available. Each patient was matched based on gender, age (+/− 4 years) and ethnicity to an unrelated control without evidence of neurological disease (n=186). All patients were examined and observed longitudinally by a movement disorders neurologist (JMG and TL) and diagnosed with PD according to published criteria (Gelb et al., 1999). Patients with atypical symptoms or poor response upon dopaminergic treatment were excluded. All subjects had been followed up in a movement disorders clinic for at least five years. Ethics Committee approval was obtained and written consent given by all subjects.
DNA was obtained from blood for all subjects, using standard protocols. Fourteen polymorphic markers traversing the SNCA locus, including the 5′ and 3′ regions, were selected for analysis. SNP genotyping was performed using TaqMan chemistry on an ABI7900 genetic analyzer and the microsatellite Rep1 (D4S3481) was examined using fluorescent-labeled primer PCR reaction with electrophoresis performed on an ABI3730 with Genemapper software for analysis (Applied Biosystems Inc.). In patients where genotype data was only available for one sample of a matched pair the other subject was retained in the analysis. For the controls in each population, c2 tests of Hardy-Weinberg equilibrium (HWE) were implemented using Haploview (Barrett et al., 2005).
Haplotype analysis was performed in S-Plus score tests for association as described previously (Schaid et al., 2002), with adjustments made for age and sex. P-values were obtained from the asymptotic chi-square distribution of the score statistic. Haplotypes with an overall frequency of less than 1% were not considered. Individual associations between PD and each marker were measured by odds ratios (OR’s) and corresponding 95% confidence intervals (CI’s) obtained from logistic regression models adjusted for age and sex.
In PD cases, linear regression models adjusted for sex were used to examine individual associations between age-at-onset and each marker. Linkage disequilibrium (LD) between markers in study controls was assessed using r-squared (r2) values. In the case of the microsatellite Rep1 the genotype was considered binary based upon the presence or absence of the ‘259’ allele. The ‘259’ allele was chosen as it is postulated to be functionally protective and has a relatively high frequency compared to the ‘263 risk’ allele. Statistical significance was determined at the 5% level. Multiple testing was adjusted for by using permutation analyses to find the threshold P-value that controls the family-wise error rate at 5%.
Results and Discussion
A total of fourteen polymorphic markers (one microsatellite and 13 SNPs) were examined in an Irish patient-control series (n=372). The markers where selected on the basis of previous association data and the haplotype structure of the SNCA locus as ascertained from Haploview to ‘tag’ the LD blocks observed. Single marker analysis showed a number of statistically significant associations before correcting for multiple testing. Five SNPs as well as the microsatellite Rep1 displayed P-values <0.05 prior to correction, with two estimated OR’s >1.4 and three <0.6 (OR’s correspond to presence of the minor allele; Table 1, and presence of the “259” allele; Table 2). Following correction a marginal protective association of Rep1 allele 259 remained (Table 2). These data were then analysed using an inferred haplotype 3-SNP sliding window. P-values of <0.05 were observed for two haplotypes and three further displayed suggestive P-values of <0.07, although they did not remain statistically significant after correction (Table 3). There were no significant associations (P>0.05) with age-at-onset in cases in single marker analysis (data not shown).
Table 1.
Genotype and allele frequency of the SNPs throughout the SNCA locus
| SNCA SNP | Genotype n (%) | Allele n | Estimated OR (95% CI) | P-value | |||
|---|---|---|---|---|---|---|---|
| rs2583988
Controls Patients |
CC
103 (55.7) 96 (52.5) |
CT
64 (34.6) 69 (37.7) |
TT
18 (9.7) 18 (9.8) |
C
270 261 |
T
100 105 |
1.14 (0.76 – 1.72) | 0.53 |
| rs2619364
Controls Patients |
AA
103 (55.7) 96 (51.9) |
AG
64 (34.6) 71 (38.4) |
GG
18 (9.7) 18 (9.7) |
A
270 263 |
G
100 107 |
1.18 (0.78 – 1.78) | 0.43 |
| rs2619363
Controls Patients |
GG
102 (55.7) 95 (51.9) |
GT
63 (34.4) 70 (38.3) |
TT
18 (9.8) 18 (9.8) |
G
267 260 |
T
99 106 |
1.17 (0.77 – 1.76) | 0.46 |
| rs2301134
Controls Patients |
AA
60 (32.8) 45 (24.7) |
AG
80 (43.7) 90 (49.5) |
GG
43 (23.5) 47 (25.8) |
A
200 180 |
G
163 184 |
1.49 (0.94 – 2.37) | 0.089 |
| rs2737020
Controls Patients |
CC
86 (47.8) 113 (61.4) |
CT
84 (46.7) 63 (34.2) |
TT
10 (5.5) 8 (4.3) |
C
256 289 |
T
104 79 |
0.57 (0.37 – 0.87) | 0.009 |
| rs6848726
Controls Patients |
CC
80 (44.4) 71 (40.6) |
CT
75 (41.7) 76 (43.4) |
TT
25 (13.9) 28 (16.0) |
C
235 218 |
T
125 132 |
1.18 (0.77 – 1.80) | 0.45 |
| rs356186
Controls Patients |
GG
97 (53.3) 123 (67.2) |
GA
79 (43.4) 52 (28.4) |
AA
6 (3.3) 8 (4.4) |
G
273 298 |
A
91 68 |
0.55 (0.36 – 0.84) | 0.007 |
| rs356164
Controls Patients |
GG
110 (60.8) 134 (72.4) |
GC
66 (36.5) 46 (24.9) |
CC
5 (2.8) 5 (2.7) |
G
286 314 |
C
76 56 |
0.59 (0.38 – 0.91) | 0.019 |
| rs10516845
Controls Patients |
AA
165 (90.2) 158 (87.3) |
AG
16 (8.7) 21 (11.6) |
GG
2 (1.1) 2 (1.1) |
A
346 337 |
G
20 25 |
1.34 (0.70 – 2.60) | 0.38 |
| rs356165
Controls Patients |
AA
74 (40.9) 53 (29.4) |
AG
77 (42.5) 86 (47.8) |
GG
30 (16.6) 41 (22.8) |
A
225 192 |
G
137 168 |
1.67 (1.08 – 2.58) | 0.023 |
| rs356221
Controls Patients |
TT
53 (29.1) 45 (24.5) |
TA
89 (48.9) 84 (45.7) |
AA
40 (22.0) 55 (29.9) |
T
195 174 |
A
169 194 |
1.27 (0.80 – 2.02) | 0.32 |
| rs11931074
Controls Patients |
GG
165 (90.2) 154 (83.2) |
GT
16 (8.7) 30 (16.2) |
TT
2 (1.1) 1 (0.5) |
G
346 338 |
T
20 32 |
1.85 (1.00 – 3.49) | 0.054 |
| rs181489
Controls Patients |
CC
93 (50.5) 73 (40.1) |
CT
68 (37.0) 81 (44.5) |
TT
23 (12.5) 28 (15.4) |
C
254 227 |
T
114 137 |
1.52 (1.01 – 2.31) | 0.047 |
- Odds ratios correspond to presence of the minor allele. P-values result from tests of association in logistic regression models adjusted for age and sex. P-values ≤ 0.006 are considered statistically significant after using permutation analysis to control the family-wise error rate at 5%.
Table 2.
Genotype and allele frequency of the Rep1 microsatellite in the promoter of SNCA
| SNCA Rep1 | Controls n=185 | Patients n=184 |
|---|---|---|
| Genotype | n (%) | n (%) |
| 259 | 19 (10.3) | 11 (6.0) |
| 259/261 | 84 (45.4) | 59 (32.1) |
| 259/263 | 3 (1.6) | 9 (4.9) |
| 261 | 64 (34.6) | 86 (46.7) |
| 261/263 | 13 (7.0) | 18 (9.8) |
| 263 | 2 (1.1) | 1 (0.5) |
|
| ||
| Allele | n (%) | n (%) |
| 259 | 125 (33.8) | 90 (24.5) |
| 261 | 225 (60.8) | 249 (67.7) |
| 263 | 20 (5.4) | 29 (7.9) |
- A logistic regression model considering Rep1 as binary (presence of the 259 alelle or not) and also adjusted for age and sex yielded a P-value of 0.006 (OR: 0.59: 95% CI: 0.37 – 0.84). P-values ≤ 0.006 are considered statistically significant after using permutation analysis to control the family-wise error rate at 5%.
Table 3.
Inferred 3-SNP haplotype analysis
| Markers in haplotype | P-value |
|---|---|
| rs181489, rs11931074, rs356221 | 0.046 |
| rs11931074, rs356221, rs356165 | 0.069 |
| rs356221, rs356165, rs10516845 | 0.10 |
| rs356165, rs10516845, rs356164 | 0.039 |
| rs10516845, rs356164, rs356186 | 0.18 |
| rs356164, rs356186, rs6848726 | 0.19 |
| rs356186, rs6848726, rs2737020 | 0.24 |
| rs6848726, rs2737020, rs2301134 | 0.24 |
| rs2737020, rs2301134, rs2619363 | 0.11 |
| rs2301134, rs2619363, rs2619364 | 0.069 |
| rs2619363, rs2619364, rs2583988 | 0.51 |
| rs2619364, rs2583988, Rep1 | 0.068 |
- After using permutation analysis to control the family-wise error rate at 5%, P-values ≤ 0.0087 are considered statistically significant.
Measurements of LD between the individual markers were calculated and a number of the markers dispersed across SNCA show high LD scores (Figure 1). Three promoter SNPs (rs2583988, rs2619364 & rs2619363) appear to be in almost complete LD (r2= 0.99; D’=1.00). Pals et al. (2004) reported a significant association with these three SNPs and Rep1 in a specific SNCA promoter haplotype in Belgian PD patients (261-T-G-T), and although this result was not observed in this Irish series our Rep1 data does demonstrate promoter association. The three promoter SNPs are also in LD with a SNCA 3′UTR SNP rs356165 (r2= 0.44; D’=0.85). The SNP rs356165 has the highest estimated OR (1.67, 95% CI: 1.08–2.58) in the SNCA gene transcript, is the only SNP located in the 3′UTR and has been observed to associate with disease in the previous studies (Mizuta et al., 2006; Mueller et al., 2005). This finding demonstrates how multiple regions of the SNCA gene in LD can associate with disease.
Figure 1.
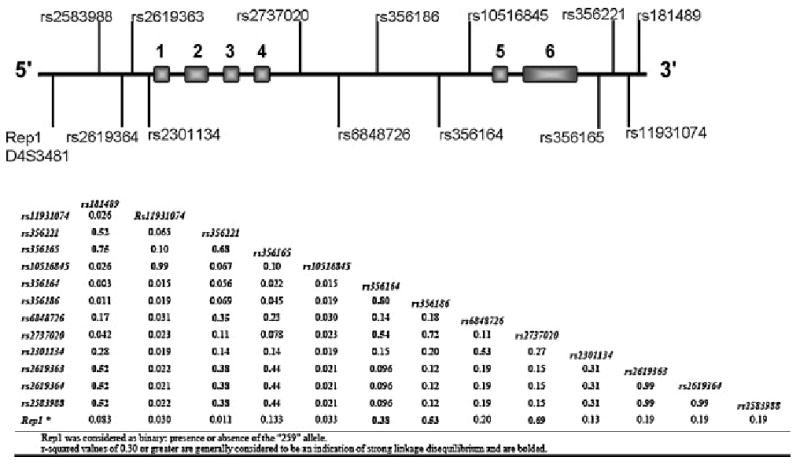
Diagrammatic representation of the SNCA locus (Chr.4 90.87--90.98 Mb). r-squared values measuring LD between markers calculated from control individuals. Marker positions are available from http://www.ncbi.nlm.nih.gov/SNP (Rep1 is referenced as D4S3481).
Pals et al. also observed a noteworthy less significant association further along the gene in the large intron 4 (~90Kb). These findings were supported by a large study in German PD patients that observed significant associations at the 5′ promoter, intron 4 and 3′UTR regions (Mueller et al., 2005). A third study in Japanese patients also identified multiple regions of SNCA (5′, intron 4 and 3′) which may affect susceptibility to PD (Mizuta et al., 2006). The present study observed a protective association in intron 4 with SNPs rs2737020 (OR 0.57, 95% CI: 0.37–0.87) and rs356186 (OR 0.55, 95% CI: 0.36–0.84; r2= 0.72 between these two SNPs). This is in contrast to previous studies that have shown a ‘risk’ association in intron 4 and although not significant our SNP rs6848726 does show a ‘risk’ trend (OR 1.18, 95% CI: 0.77–1.80). These alternate observations may be due in part to the smaller sample size of this study and the use of different markers, no intron 4 markers match Mizuta et al. and only one marker, rs356186, is examined in Mueller et al. and does not show association in their study (Mueller et al., 2005).
Our findings confirm previous reports of association of common polymorphism in SNCA and susceptibility to PD. This study observes a protective association with the Rep1 microsatellite repeat in the promoter region of the SNCA and also a ‘risk’ region towards the 3′-end of the gene. It is postulated that the length of the Rep1 repeat allele i.e. 263>261>259 is correlated to an increased expression level of the SNCA transcript (Chiba-Falek and Nussbaum, 2001). A recent collaborative analysis of the Rep1 promoter microsatellite suggests that the ‘259 allele’ is protective and ‘263’ is a risk allele in Caucasian populations (Maraganore et al., 2006). However, Maraganore et al. 2006 do not observe any Rep1 association with age-at-onset as would be expected if the mechanism of disease is via simple, constitutive overexpression of the gene, the authors suggest there must be an alternate mechanism of disease susceptibility. The Rep1 association with susceptibility may reflect a scenario whereby the increased expression reaches a threshold that increases risk but is not of a magnitude to effect differential age-at-onset.
Regulation of gene expression can occur via a number of different mechanisms. Pre-transcriptional modifications such as methylation of GC-rich regions can affect expression. The SNCA locus may also encode self-regulatory elements such as siRNAs or natural antisense transcripts (NATs) (Guo et al., 2006). Other mechanisms include dysregulated mRNA/protein degradation and polymorphic variants which disrupt/create transcription factor binding sites (TFBS) that effect a higher/lower expression profile resulting in the risky/protective alleles. A number of bioinformatics databases are available to search for regulatory sequences (e.g. http://www.gene-regulation.com/pub/databases.html) using the PROMO search engine (TRANSFAC Ver. 8.3) we did not predict 3′UTR SNP rs356165 to alter a TFBS (Farré et al., 2003). However alternative regulation strategies may support the hypothesis that variants in LD with Rep1 although not located in the promoter, such as 3′UTR rs356165, may still be responsible for the genetic association and postulated increase in α-synuclein expression.
SNCA multiplication families, and SNCA polymorphic association with PD, have now been observed in both Caucasian and Asian populations. There is a relatively high level of LD within the SNCA locus which makes it difficult to fine-map the true region of association. Interestingly, the SNCA locus appears to have a different LD structure in the Caucasian, African and Asian populations employed for The HapMap project (2003). The Asian SNCA map demonstrates a lack of LD between the promoter region and the -3′ of the gene (Figure 2). The study of Mizuta and colleagues (2006) in Japanese samples notably observed the strongest association at the -3′ end of SNCA with a less significant association at the promoter region which may indicate the position of a functional variant proximal to the 3′-end of SNCA.
Figure 2.
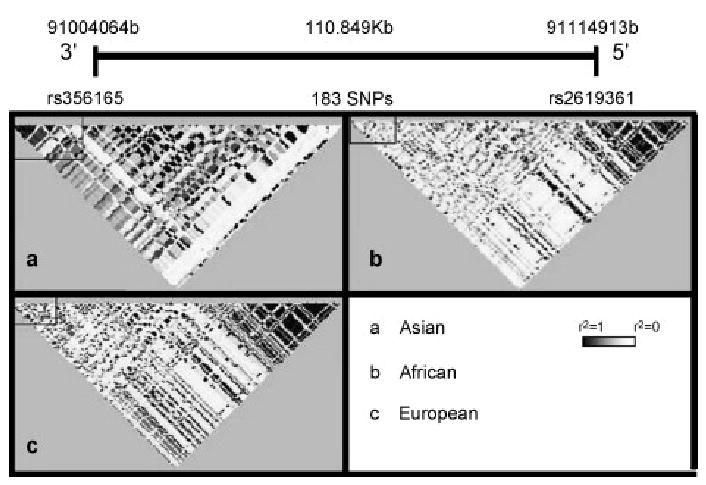
Hapmap representation of the LD structure of the SNCA locus in three diverse ethnicities (r2 values are used to generate the LD plots, black squares represent r2=1 and white r2=0 between markers). The SNCA locus appears to show a different pattern of LD in (a) Asian samples (unrelated Japanese individuals from the Tokyo area and unrelated Chinese individuals from Beijing) when compared to both (b) African (Yoruba people of Ibadan, Nigeria) and also (c) European (Thirty U.S. trios with northern and western European ancestry collected by the Centre d’Etude du Polymorphisme Humain). Interestingly the African and European LD structure appears similar. Hapmap data for the SNCA locus was downloaded from http://www.hapmap.org/index.html (Project data) and visualized using Haploview software (Barrett et al., 2005).
Our results also indicate that there may be multiple independent/additive associations throughout the SNCA locus. To fully resolve the ‘population-risk’ variant/s for sporadic PD at the SNCA locus it is necessary to establish a collaborative effort, across ethnically diverse populations, employing identical, dense marker sets and standardized clinical assessments of motor and memory disorder in patients with parkinsonism.
Acknowledgments
We are grateful to the following organizations for their support of this work: The R&D Office of the Health and Personal Social Services and the Department of Employment and Learning (Northern Ireland). The Republic of Ireland research consortium was supported by a Programme for Research in Third-Level Institutions (PRTLI) neurosciences award. We would like to thank Minnie Schreiber for laboratory support, our research nurse Paula Woods of the Neurology department in the City Hospital, Belfast. Mayo Clinic Jacksonville is a Morris K. Udall Parkinson’s Disease Research Center of Excellence (NINDS P50 #NS40256). We would like to thank all those who have contributed to our research, particularly the patients and their families.
Footnotes
Publisher's Disclaimer: This is a PDF file of an unedited manuscript that has been accepted for publication. As a service to our customers we are providing this early version of the manuscript. The manuscript will undergo copyediting, typesetting, and review of the resulting proof before it is published in its final citable form. Please note that during the production process errors may be discovered which could affect the content, and all legal disclaimers that apply to the journal pertain.
References
- Barrett JC, Fry B, Maller J, Daly MJ. Haploview: analysis and visualization of LD and haplotype maps. Bioinformatics. 2005;21:263–5. doi: 10.1093/bioinformatics/bth457. [DOI] [PubMed] [Google Scholar]
- Chartier-Harlin MC, Kachergus J, Roumier C, Mouroux V, Douay X, Lincoln S, Levecque C, Larvor L, Andrieux J, Hulihan M, Waucquier N, Defebvre L, Amouyel P, Farrer M, Destee A. Alpha-synuclein locus duplication as a cause of familial Parkinson’s disease. Lancet. 2004;364:1167–9. doi: 10.1016/S0140-6736(04)17103-1. [DOI] [PubMed] [Google Scholar]
- Chiba-Falek O, Nussbaum RL. Effect of allelic variation at the NACP-Rep1 repeat upstream of the alpha-synuclein gene (SNCA) on transcription in a cell culture luciferase reporter system. Hum Mol Genet. 2001;10:3101–9. doi: 10.1093/hmg/10.26.3101. [DOI] [PubMed] [Google Scholar]
- Farré D, Roset R, Huerta M, Adsuara JE, Roselló L, Albà MM, Messeguer X. Identification of patterns in biological sequences at the ALGGEN server: PROMO and MALGEN. Nucleic Acids Res. 2003;31:3651–3653. doi: 10.1093/nar/gkg605. [DOI] [PMC free article] [PubMed] [Google Scholar]
- Farrer M, Kachergus J, Forno L, Lincoln S, Wang DS, Hulihan M, Maraganore D, Gwinn-Hardy K, Wszolek Z, Dickson D, Langston JW. Comparison of kindreds with parkinsonism and alpha-synuclein genomic multiplications. Ann Neurol. 2004;55:174–9. doi: 10.1002/ana.10846. [DOI] [PubMed] [Google Scholar]
- Farrer MJ. Genetics of Parkinson disease: paradigm shifts and future prospects. Nat Rev Genet. 2006;7:306–18. doi: 10.1038/nrg1831. [DOI] [PubMed] [Google Scholar]
- Gelb DJ, Oliver E, Gilman S. Diagnostic criteria for Parkinson disease. Arch Neurol. 1999;56:33–9. doi: 10.1001/archneur.56.1.33. [DOI] [PubMed] [Google Scholar]
- Guo JH, Cheng HP, Yu L, Zhao S. Natural antisense transcripts of Alzheimer’s disease associated genes. DNA Seq. 2006;17:170–3. doi: 10.1080/10425170600609165. [DOI] [PubMed] [Google Scholar]
- Ibanez P, Bonnet AM, Debarges B, Lohmann E, Tison F, Pollak P, Agid Y, Durr A, Brice A. Causal relation between alpha-synuclein gene duplication and familial Parkinson’s disease. Lancet. 2004;364:1169–71. doi: 10.1016/S0140-6736(04)17104-3. [DOI] [PubMed] [Google Scholar]
- Kobayashi H, Ujike H, Hasegawa J, Yamamoto M, Kanzaki A, Sora I. Identification of a risk haplotype of the alpha-synuclein gene in Japanese with sporadic Parkinson’s disease. Mov Disord. 2006;21:2157–64. doi: 10.1002/mds.21142. [DOI] [PubMed] [Google Scholar]
- Maraganore DM, de Andrade M, Elbaz A, Farrer MJ, Ioannidis JP, Kruger R, Rocca WA, Schneider NK, Lesnick TG, Lincoln SJ, Hulihan MM, Aasly JO, Ashizawa T, Chartier-Harlin MC, Checkoway H, Ferrarese C, Hadjigeorgiou G, Hattori N, Kawakami H, Lambert JC, Lynch T, Mellick GD, Papapetropoulos S, Parsian A, Quattrone A, Riess O, Tan EK, Van Broeckhoven C. Collaborative analysis of alpha-synuclein gene promoter variability and Parkinson disease. JAMA. 2006;296:661–70. doi: 10.1001/jama.296.6.661. [DOI] [PubMed] [Google Scholar]
- Mizuta I, Satake W, Nakabayashi Y, Ito C, Suzuki S, Momose Y, Nagai Y, Oka A, Inoko H, Fukae J, Saito Y, Sawabe M, Murayama S, Yamamoto M, Hattori N, Murata M, Toda T. Multiple candidate gene analysis identifies alpha-synuclein as a susceptibility gene for sporadic Parkinson’s disease. Hum Mol Genet. 2006;15:1151–8. doi: 10.1093/hmg/ddl030. [DOI] [PubMed] [Google Scholar]
- Mueller JC, Fuchs J, Hofer A, Zimprich A, Lichtner P, Illig T, Berg D, Wullner U, Meitinger T, Gasser T. Multiple regions of alpha-synuclein are associated with Parkinson’s disease. Ann Neurol. 2005;57:535–41. doi: 10.1002/ana.20438. [DOI] [PubMed] [Google Scholar]
- Muenter MD, Forno LS, Hornykiewicz O, Kish SJ, Maraganore DM, Caselli RJ, Okazaki H, Howard FM, Jr, Snow BJ, Calne DB. Hereditary form of parkinsonism--dementia. Ann Neurol. 1998;43:768–81. doi: 10.1002/ana.410430612. [DOI] [PubMed] [Google Scholar]
- Nishioka K, Hayashi S, Farrer MJ, Singleton AB, Yoshino H, Imai H, Kitami T, Sato K, Kuroda R, Tomiyama H, Mizoguchi K, Murata M, Toda T, Imoto I, Inazawa J, Mizuno Y, Hattori N. Clinical heterogeneity of alpha-synuclein gene duplication in Parkinson’s disease. Ann Neurol. 2006;59:298–309. doi: 10.1002/ana.20753. [DOI] [PubMed] [Google Scholar]
- Pals P, Lincoln S, Manning J, Heckman M, Skipper L, Hulihan M, Van den Broeck M, De Pooter T, Cras P, Crook J, Van Broeckhoven C, Farrer MJ. alpha-Synuclein promoter confers susceptibility to Parkinson’s disease. Ann Neurol. 2004;56:591–5. doi: 10.1002/ana.20268. [DOI] [PubMed] [Google Scholar]
- Schaid DJ, Rowland CM, Tines DE, Jacobson RM, Poland GA. Score tests for association between traits and haplotypes when linkage phase is ambiguous. Am J Hum Genet. 2002;70:425–34. doi: 10.1086/338688. [DOI] [PMC free article] [PubMed] [Google Scholar]
- Singleton AB, Farrer M, Johnson J, Singleton A, Hague S, Kachergus J, Hulihan M, Peuralinna T, Dutra A, Nussbaum R, Lincoln S, Crawley A, Hanson M, Maraganore D, Adler C, Cookson MR, Muenter M, Baptista M, Miller D, Blancato J, Hardy J, Gwinn-Hardy K. alpha-Synuclein locus triplication causes Parkinson’s disease. Science. 2003;302:841. doi: 10.1126/science.1090278. [DOI] [PubMed] [Google Scholar]
- The International HapMap Consortium. The International HapMap Project. Nature. 2003;426:789–96. doi: 10.1038/nature02168. [DOI] [PubMed] [Google Scholar]