

Abstract
In skeletal muscle and many other cell types, mitochondria exist as an elaborate and dynamic network in which “individual” mitochondria exist only transiently even under non-stimulated conditions. The balance of continuous mitochondrial fission and fusion defines the morphology of the mitochondrial reticulum. Environmental stimuli, such as oxidative stress, can influence fusion and fission rates, resulting in a transformation of the network's connectivity. Using confocal laser scanning microscopy of C2C12 mouse myocytes, we show that acute exposure to the reactive oxygen species (ROS) hydrogen peroxide (H2O2) induces a slow fragmentation of the mitochondrial reticulum that is reversible over 24 hours. Although H2O2 decomposes rapidly in culture medium, the full extent of fragmentation occurs 5-6 hours post-treatment, suggesting that H2O2 affects mitochondrial morphology by modulating cellular physiology. Supraphysiological (>1 mM) concentrations of H2O2 are cytotoxic, but lower concentrations (250 μM) sufficient to induce transient fragmentation do not lower cell viability. H2O2-induced mitochondrial fragmentation is preceded by decreases in inner mitochondrial membrane potential and maximal respiratory rate, suggesting a possible mechanism. Because H2O2 is produced in contracting muscle, our results raise the possibility that ROS generation may contribute to exercise-induced changes in mitochondrial morphology in vivo.
Keywords: Mitochondria, mitochondrial network, mitochondrial reticulum, skeletal muscle, oxidative stress, hydrogen peroxide, mitochondrial dynamics, mitochondrial membrane potential, exercise
Introduction
In a variety of models ranging from yeast to mammalian [1, 2] and human skeletal muscle [3], mitochondria form interconnected networks that undergo continuous morphological rearrangements [4-6]. Each “mitochondrion” exists only transiently before fusing into the network (reticulum) or dividing into smaller organelles (Fig. S1). A suite of conserved dynamin-like GTPases and their interacting partners regulate mitochondrial morphology. Of these, dynamin-related protein 1 (Drp1) is the mediator of mitochondrial fission. Numerous published micrographs show the tangled, web-like mitochondrial networks that result from Drp1 knockdown [7-12]. Shaping the network's morphology in opposition to Drp1 are mitofusin-1 and mitofusin-2 (Mfn1/2). Present as transmembrane proteins in the mitochondrial outer membrane, the mitofusins form homotypic and heterotypic complexes in trans across the apposed outer membranes of the mitochondria that are to fuse, and mediate outer membrane fusion [13]. Another GTPase, optic atrophy 1 (OPA1), is thought to mediate inner membrane fusion. Homozygous loss-of-function of Mfn1, Mfn2, or OPA1 is embryonic lethal in mice [14, 15]; mutations in humans lead to neurological diseases.
Although the phenomenon of mitochondrial dynamics appears to be ubiquitous in mammalian tissues, skeletal muscle fibers present an especially interesting environment in which the dynamic nature of mitochondria remains to be understood. From previous work done in our laboratory as well as in others, mitochondria have been shown to exist as a network in skeletal muscle [1-3]. The specialization of muscle for force production would appear to impose geometric and bioenergetic constraints upon the mitochondrial network and cast doubt on the importance of mitochondrial dynamics in this tissue. However, Cribbs and Strack showed increased Drp1 phosphorylation in rat cardiac muscle after a 15-minute forced swim, suggesting altered mitochondrial dynamics in striated muscle during exercise in vivo [12]. Chen et al. showed that skeletal-muscle-specific deletion of both mitofusins in a conditional knockout mouse leads to muscle atrophy, altered fiber type composition, mitochondrial dysfunction, mtDNA copy loss, and increased accumulation of mtDNA mutations [16]. Clearly mitochondrial dynamics play a critical role in the normal function of muscle.
Reactive oxygen species (ROS) have been shown to induce changes in mitochondrial network morphology in endothelial cells and neurons [17, 18]. Because contracting skeletal muscle is known to release ROS including hydrogen peroxide [19-22], we sought to determine whether H2O2 could also alter mitochondrial dynamics in a C2C12 mouse myocyte model. We found that an acute, non-cytotoxic dose of H2O2 causes a delayed fragmentation of the mitochondrial reticulum in myocytes, and that this is preceded by depression of the mitochondrial membrane potential and maximal respiratory rate. Striated muscle mitochondria are known to undergo morphological changes as the result of chronic exercise [23-25]. As well, acute exercise has been observed to affect muscle mitochondrial morphology [26]. Now we propose that oxidative stress may be a key link connecting exercise to these changes.
Experimental procedures
Materials
High-glucose (25 mM) Dulbecco's Modified Eagle's Medium (DMEM; with or without phenol red), penicillin-streptomycin, fetal bovine serum (FBS), horse serum, L-glutamine, and phosphate-buffered saline (PBS) were purchased from Invitrogen/GIBCO (Carlsbad, CA).
Low-density culture of C2C12 skeletal myocytes
C2C12 mouse myoblasts were grown at 37°C and 5% CO2 in DMEM with 10% FBS, 5 mM L-glutamine, 100 U/mL penicillin, and 100 μg/mL streptomycin. Myoblasts were seeded in 35-mm dishes at 3000 cells per dish. The medium was replaced with “medium II” (DMEM with 2% horse serum, 5 mM L-glutamine, 100 U/mL penicillin, and 100 μg/mL streptomycin) after 2 days, and experiments were performed 5 days after the switch to medium II. By the day of the experiment, low-density-seeded C2C12 cells had usually proliferated to 70-80% confluence.
H2O2 treatment and staining of mitochondria with MitoTracker Deep Red 633
C2C12 cells were treated with H2O2 (Acros Organics, Fair Lawn, NJ) diluted to the desired concentration in medium II. After treatment, the cells were washed with PBS and incubated in 300 nM MitoTracker Deep Red 633 (Invitrogen/Molecular Probes, Eugene, OR) in medium II without phenol red at 37°C for 30 minutes. The cells were then washed and fresh medium II without phenol red was replaced for live cell imaging.
Live cell imaging using confocal laser scanning microscopy (CLSM)
Single images, typically corresponding to optical sections <1.8 μm thick, were taken of live MitoTracker-stained cells using a Zeiss LSM 510 META confocal scan head mounted on an upright Axioplan 2 microscope with Achroplan IR 63×/0.90 NA or Achroplan 40×/0.80 NA water dipping objectives. Movies of mitochondrial dynamics were made by taking serial images, with a delay of 5 s between scans.
Manual scoring of mitochondrial morphology
3-5 images of random fields of view were taken. All in-focus cells captured in those fields were manually classified as “fragmented” (>50% of mitochondrial area consisting of punctiform mitochondria), “intermediate” (10-50% punctiform), or “reticular” (<10% punctiform). Any myotubes or dead cells present were not scored.
Peroxide assay
The culture supernatant was aspirated off cells grown in 35-mm dishes and replaced with fresh medium II without phenol red, with or without 250 μM H2O2. 100 μL of supernatant was removed 0, 5, 10, 15, 30, and 60 minutes after addition of H2O2 and immediately added to the assay reagents (QuantiChrom Peroxide Assay Kit; BioAssay Systems, Hayward, CA) in a 96-well plate. Plates were incubated for 30 minutes and read on a SpectraMax 340PC384 microplate spectrophotometer at 585 nm. A standard curve using known concentrations of H2O2 was processed at the same time and used to back-calculate the concentrations of H2O2 at different time points. The experiment was repeated for 250 μM H2O2 in medium II in the absence of cells.
WST-8 cell viability assay
Myocytes were seeded in 96-well plates at low density and grown as usual. After incubation in 0, 125, 250, 500, 1000, or 2000 μM H2O2 in medium II for 6 hours, the wells were washed and fresh medium II without phenol red was replaced. WST-8 (Cell Counting Kit-8, Dojindo Labs, Gaithersburg, MD) was added to each well, incubated for 1 hour, and read on the spectrophotometer at 440 nm; the measured absorbance is proportional to the number of viable cells. A second plate was allowed to recover in medium II for 24 hours, after which viability was determined.
Qualitative flow cytometry assay for mitochondrial depolarization
5,5′,6,6′-tetrachloro-1,1′,3,3′-tetraethylbenzimidazolylcarbocyanine iodide (JC-1, Sigma-Aldrich) is a cationic, lipophilic dye that accumulates in mitochondria and exhibits green (525 nm) fluorescence in its monomeric state. In energized mitochondria, JC-1 monomers form orange (575 nm) “J-aggregates” [27]. JC-1 was dissolved in DMSO and medium II for a final concentration of 2 μM (0.4% DMSO), which was found to be the minimal concentration at which the majority of cells showed positive 575 nm fluorescence by flow cytometry (Fig. S2). After 30 minutes of incubation at 37°C, cells were washed and trypsinized. Following resuspension in fresh medium II without phenol red, 25,000 events were collected from each sample using a Beckman Coulter EPICS XL flow cytometer. Fluorescence compensation was done such that cells stained with 2 μM JC-1 were positive for both 525 and 575 nm fluorescence, and treatment with 10 μM CCCP increased 525 nm fluorescence while decreasing 575 nm fluorescence. Data was analyzed using FlowJo software (TreeStar). Similar plots using the same JC-1 concentration have been published by Cassart et al. [28].
Polarographic measurement of oxygen consumption
Oxygen consumption rates of intact C2C12 myocytes were measured using a Clark-type electrode with a digital controller (Rank Brothers), connected to a computer running LabVIEW software (National Instruments). At the start of each trial, 4 mL of medium II was allowed to equilibrate in the sample chamber (maintained at 37°C) until the trace reached a flat line, which was defined as 100% O2 saturation. C2C12 myocytes grown in 10-cm dishes were trypsinized, washed, and resuspended in 1 mL of equilibrated medium. One 10-cm dish of cells was used for each trial. After the cells were added to the chamber, the chamber was stoppered and endogenous respiration was recorded for 15 minutes. Then, CCCP (final concentration 10 μM) was injected, and uncoupled respiration was recorded for an additional 10 minutes. After the experiment was stopped, the cells were counted by hemacytometer. The linear least squares method was used to calculate endogenous and uncoupled slopes.
Image processing
Microscope and gel images have been linearly contrast-enhanced in ImageJ (Wayne Rasband, NIH).
Statistical analysis
Experiments were typically done with 3-6 replicates. When applicable, Student's t-test was used to test for significant differences between groups at P < 0.05.
Results
Low-density seeding of C2C12 cells permits observation of mitochondrial dynamics
Because our interest is to study mitochondrial dynamics in mammalian skeletal muscle fibers, we initially seeded C2C12 myoblasts at high density, permitting the cells to fuse into multinucleate, elongated myotubes (Fig. S3C). However, we found the MitoTracker-stained mitochondria of such myotubes to be too dense to resolve satisfactorily. Undifferentiated myoblasts (Fig. S3A) were also deemed to be an unsuitable model: MitoTracker staining was diffuse and revealed a mitochondrial “network” that, if not a staining artifact, appeared to be already fragmented before any treatment. Accordingly, others have shown that myoblasts express less mitofusin-2 than do myotubes [29]. Therefore, we studied low-density-seeded C2C12 myocytes (Fig. S3B), which were delayed but not blocked in myotube formation. Mitochondria from such cells showed a baseline configuration that more closely approximated that which exists in skeletal muscle of human and rodent models [1-3]. While low-density-seeded myocytes retain the cellular morphology of myoblasts, their expression of several mitochondrial and metabolic protein markers was found to resemble that of myotubes (Fig. S4). In contrast, myoblasts showed much lower expression of voltage-dependent anion channel (VDAC). Following these preliminary findings, all subsequent experiments were conducted using low-density-seeded C2C12 myocytes.
250 μM H2O2 induces a reversible fragmentation of the mitochondrial network
We found that 250 μM H2O2 induced the mitochondrial network to fragment into punctiform mitochondrial vesicles in cells observed 6 hours post-treatment (Fig. 1). Quantification was independently verified by skeletonization analysis (Fig. S5). For cells incubated for 3 hours in various concentrations of H2O2, the extent of fragmentation was dose-dependent (Fig. 2A). However, because mitochondrial fission is a key step in apoptosis [30], and severe oxidative stress may induce apoptosis, we also examined cells 24 and 48 hours after an initial 6-hour treatment. We observed that while nearly all cells showed the fragmented phenotype after 6 hours, only a small fraction showed signs of punctiform mitochondria after 24 or 48 hours (Fig. 1). Mock treatment with medium lacking H2O2 did not result in any observable change. Furthermore, cytotoxicity was negligible with 250 μM H2O2 (Fig. 2B), but 1000 and 2000 μM H2O2 did reduce viability, which was confirmed by CLSM (not shown).
Figure 1. H2O2-induced mitochondrial network fragmentation is reversible.

C2C12 cells were treated with 250 μM H2O2 or 0 μM H2O2 (control) for 6 hours, then stained with MitoTracker Deep Red 633 for 30 minutes and visualized by CLSM immediately, or after a 24- or 48-hour incubation. For each image taken, the total number of cells and the number of cells displaying a reticular mitochondrial network were counted. A, representative images for each of the conditions. B, the percentage (mean ± SEM) of total imaged cells displaying a reticular mitochondrial network under each condition. An average of 235 cells was scored per condition. *Significantly different from all other bars, P < 0.001. Six-hour treatment with 250 μM H2O2 significantly decreased the percentage of cells having a reticular mitochondrial network, but the cells recovered within 24 hours.
Figure 2. Dose-dependence, cytotoxicity assessment, and time-dependence of H2O2-induced mitochondrial network fragmentation.

A, C2C12 cells were treated with 0, 62.5, 125, 250, and 500 μM H2O2 for 3 hours, stained with MitoTracker Deep Red, visualized by CLSM, and categorized by network morphology. The percent of cells in the “fragmented” category is shown for each condition. Mock-treated (0 μM H2O2) myocytes showed a predominantly reticular network morphology, which became increasingly fragmented as H2O2 dose was increased. An average of 52 cells was scored per condition. Data are presented as percents of the total number of cells scored in each treatment group. Data from 2 independent experiments are shown. B, myocytes were treated with 0, 125, 250, 500, 1000, or 2000 μM H2O2 for 6 hours and assayed for cell viability with WST-8 immediately (triangles), or washed and returned to H2O2-free medium, and assayed 24 hours later (squares). Data are presented as means ± SD of 5-6 replicates. Notably, the H2O2 concentration used in subsequent experiments (250 μM) did not significantly lower cell viability. Student's t-test was used to test for statistically significant differences between each condition and the respective 0 μM H2O2 control. NS, not significantly different from mock-treated (0 μM H2O2); *P < 0.05; **P = 0.001; ***P < 10-7. C, cells were incubated in medium II initially containing 250 μM H2O2 for 5 minutes or 1 to 6 hours, then stained with MitoTracker for 30 minutes and visualized by CLSM. The percent of cells in the “fragmented” category is shown for each time point. The occurrence of fragmented mitochondria appears to peak at 5.5 hours. An average of 51 cells was scored per time point. Data from 2 independent experiments are shown.
Fragmentation peaks 5.5 hours after the addition of 250 μM H2O2
Because our initial observation of H2O2-induced fragmentation was made following a 6-hour treatment, we sought to better characterize the time course of mitochondrial fragmentation. By visualizing cells with CLSM after 250 μM H2O2 pre-treatments of different durations (from 5 minutes to 6 hours), we found that fragmentation proceeded slowly, peaking at 5.5 hours with 250 μM H2O2 (Fig. 2C). In consideration of previous findings of rapid fragmentation caused by various stimuli in other cell types [7, 9, 31-33], we sought to determine whether there could be “fast” fragmentation in C2C12 myocytes. We found that while 100 nM of the respiratory uncoupler CCCP had no effect even after 15 minutes, 10 μM CCCP induced cytosolic MitoTracker leakage and the appearance of numerous punctiform mitochondria within 3 minutes of its addition to live cells (Fig. S6).
250 μM H2O2 in medium II at 37°C decomposes within 1 hour
To monitor extracellular H2O2 concentration over time, we periodically withdrew supernatant from H2O2-incubated cells and assayed its H2O2 content via a colorimetric assay. We found that [H2O2] declined rapidly, falling to the limit of detection after 1 hour (Fig. 3). This decomposition followed first-order kinetics, with apparent half-lives of 6.3 and 9 minutes in 37°C medium II with and without myocytes, respectively (Fig. 3, inset). Although H2O2 itself did not persist long extracellularly, we were concerned that H2O2 could react with components of the medium to generate other ROS that mediate fragmentation. Ruling out this possibility, we found that the extent of fragmentation was similar whether H2O2-treated cells were washed (and replaced in H2O2-free medium) 1, 2, or 5 hours post-treatment (not shown). Thus, fission toward the fragmented state proceeded in the absence of continuing extracellular stimulation.
Figure 3. Mean hydrogen peroxide concentration in cell culture supernatant as a function of time.

At time zero, 250 μM H2O2 was added to dishes with (solid diamond) or without (open triangle) C2C12 cells seeded. In a mock experiment (open square), H2O2-free medium was added to a dish of cells. Data are presented as means ± SD of 3 replicate dishes. Inset, the same data is plotted, but with the natural logarithm of [H2O2] on the ordinate axis. The disappearance of H2O2 followed first-order kinetics (t1/2 = 6.3 min in the presence of C2C12 cells; 9.0 min in their absence).
250 μM H2O2-treated cells take up less JC-1, suggesting a diminished ΔΨm
The morphology of the mitochondrial network is determined by the relative rates of fusion and fission. In the simplest case, the demonstrated H2O2-induced fragmentation can be explained by the promotion of fission, or the inhibition of fusion. Using quantitative RT-PCR, we did not detect any significant changes in the mRNA levels of Mfn1, Mfn2, OPA1, Fis1, Drp1, or cytochrome c in C2C12 cells treated for 6 hours with 250 μM H2O2 (Supplementary Table 1, primers given in Supplementary Table 2). Drp1 is known to translocate from the cytoplasm to mitochondria upon activation [31]. However, we also did not detect any significant change in Drp1 protein levels (normalized to VDAC) in the mitochondrial fraction of C2C12 cells after the same H2O2 treatment (Fig. S7). The slow kinetics of H2O2-induced fragmentation are consistent with the gradual accumulation of punctiform mitochondria due to continued fission in the absence or reduction of fusion. Several investigators have shown that ΔΨm is required for fusion [34-38] and we confirmed that CCCP causes rapid fragmentation. We hypothesized that 250 μM H2O2 decreases, but does not completely abolish ΔΨm and reduces mitochondrial fusion. Using flow cytometry to measure the loading of JC-1 in trypsinized H2O2-pretreated C2C12 cells (Fig. 4), we confirmed a diminished ΔΨm both 1 and 5 hours post-treatment (Fig. 4C). Specifically, the median fluorescence intensity at 575 nm, corresponding to “J-aggregates,” was significantly lower in 1-hour H2O2-pretreated cells that were then stained with JC-1 (Fig. 4B). To be sure that JC-1 staining was responsive to ΔΨm, JC-1-stained cells were treated with 10 μM CCCP, which dramatically decreased 575 nm fluorescence and increased 525 nm fluorescence (Fig. 4B).
Figure 4. 250 μM H2O2 pretreatment decreases JC-1 loading.
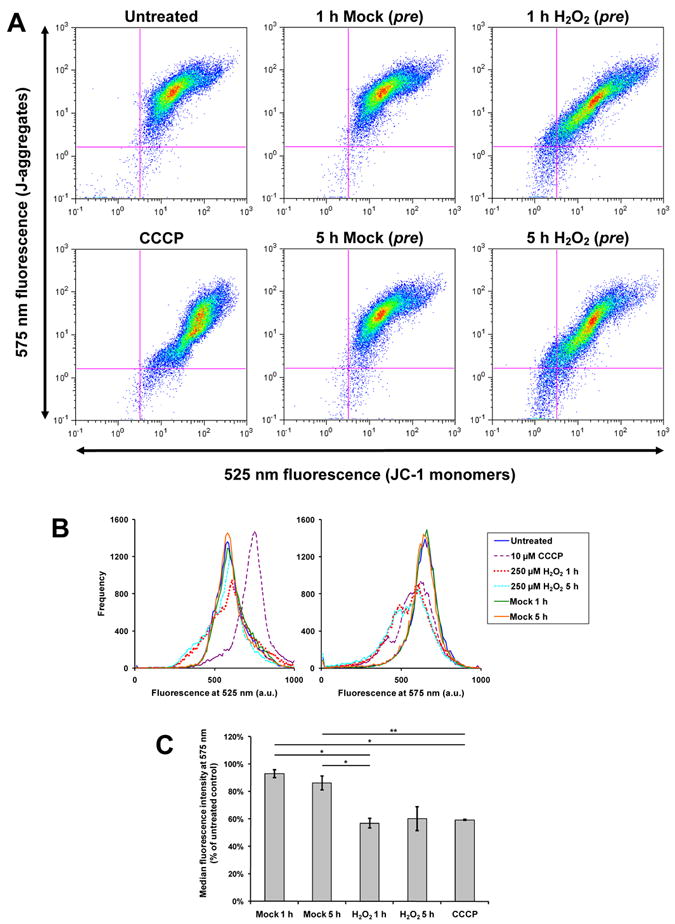
C2C12 cells were pretreated with 250 μM H2O2 or 0 μM H2O2 (“mock”) for 1 or 5 hours, or were not pretreated (“untreated”). Subsequently, cells were stained in 2 μM JC-1 for 30 minutes, trypsinized, and analyzed by flow cytometry. Some “untreated” cells were treated with 10 μM CCCP before flow cytometry (denoted “CCCP”). A, two-parameter (log scale) pseudo-colored dot plots for fluorescence detected at 525 nm and 575 nm. B, the data from A shown as superimposed single-channel histograms. Notably, H2O2 pretreatment (whether for 1 hour or 5 hours) causes a marked shift toward lower 575 nm fluorescence. In A and B, data from 1 representative experiment of 3 are shown. C, quantification of JC-1 fluorescence at 575 nm (J-aggregates). The median fluorescence intensity of each single-channel histogram was expressed as a percentage of the “untreated” control of that experiment. Mean percentages ± SEM of 3 independent experiments are shown. *P < 0.01; **P < 0.05. One- and five-hour pretreatments with 250 μM H2O2 appear to have similar effects in decreasing median 575 nm fluorescence intensity.
250 μM H2O2 alters cellular respiration
Because a high ΔΨm normally checks further pumping of protons into the mitochondrial intermembrane space, a decrease in ΔΨm would be expected to exert an uncoupling effect and accelerate oxygen consumption; this is indeed the case when CCCP is used to dissipate ΔΨm (Fig. 5). We used a Clark-type electrode to measure dissolved O2 in the medium incubating trypsinized H2O2- or mock-pretreated cells (Fig. 5), or H2O2-pretreated cells 24 hours after the end of the treatment period (i.e., 25 hours after H2O2 addition). We did not observe a statistically significant difference in endogenous respiration normalized to cell number, between any groups (Fig. S8A), although cells pretreated with H2O2 for 1 or 5 hours exhibited higher endogenous respiration on average. However, the rate of uncoupled (maximal) respiration was significantly lower in cells that had been pretreated with H2O2 for 1 or 5 hours (Fig. S8B). Because normalizing respiration rates by cell number compounds their respective measurement errors, a more precise metric is the ratio between uncoupled and endogenous respiration. This ratio is the multiplicative factor by which the endogenous respiration rate increases when 10 μM CCCP is added. When this is considered (Fig. 5, inset), untreated cells and cells that have been mock-treated with medium show no significant differences from each other. However, cells 1, 5, or 25 h post-H2O2-addition had significantly lower maximal-to-endogenous respiration ratios compared to any of the controls. Furthermore, 25 h post-H2O2 cells had significantly elevated ratios than 5 h post-H2O2 cells, suggesting recovery.
Figure 5. H2O2-treated cells show depressed uncoupled-to-endogenous respiration ratios 1, 5, or 25 hours post-treatment.

Representative respiration traces of intact C2C12 myocytes, measured using a Clark-type oxygen electrode, are shown. Untreated, mock-pretreated, or H2O2-pretreated cells were trypsinized and added (triangle) to temperature-equilibrated medium, and endogenous respiration was recorded for 15 minutes. Then, CCCP (final concentration 10 μM) was added (diamond) and uncoupled respiration was recorded for at least 10 minutes. The values of the slopes of the endogenous and uncoupled respiration traces are shown. Inset, the uncoupled respiration slope of each trace was divided by the endogenous respiration slope of that trace. Data are shown as means ± SEM of at least 6 independent experiments each. *P ≤ 0.01. The partial recovery seen 25 hours post-treatment suggests that the H2O2-induced depression was transient.
Discussion
In an established model of skeletal muscle, we confirm the existence of a myocyte mitochondrial reticulum and show that it responds reversibly to H2O2-induced oxidative stress. Given the enormous metabolic demand of skeletal muscle during exercise and the ROS released from contracting muscle, the phenomenon we describe may model mitochondrial changes that occur during exercise in vivo (e.g., [26]).
Our microscopy results confirm the findings of Jendrach et al., who studied the effects of H2O2 on the mitochondrial network in human endothelial cells [17]. Notably, these authors also described a “slow” fragmentation (i.e., on the order of hours). However, they used much higher doses of H2O2 for shorter durations. The ability of endothelial cells to tolerate these high doses of H2O2 may be cell-type-specific, or due to particular culture conditions. They also report significant recovery of the reticular morphology 24 hours post-treatment. Slow fragmentation was also observed in neurons treated with nitric oxide [18].
The H2O2-induced slow fragmentation we describe is kinetically inconsistent with previous reports of Ca++-dependent fission activation [8, 31-33], most often found to be mediated by increased Drp1 activity. Instead, our observations suggest a reduction in fusion and the gradual development of fragmentation due to continuing fission. Importantly, fragmentation developed in the absence of H2O2 itself (Fig. 3) or H2O2-treated medium. We surveyed the major proteins known to be involved in mitochondrial dynamics (Mfn1, Mfn2, OPA1, Drp1, Fis1), but did not find any of them to be regulated transcriptionally after a 6-hour treatment with 250 μM H2O2 (Supplementary Table 1). Likewise, we did not observe any significant change in Drp1 protein levels in the mitochondrial fraction (Fig. S7). These findings indicate that H2O2 does not modulate mitochondrial dynamics at the level of transcription, nor does it activate mitochondrial fission through signaling.
We confirm in myocytes that depolarization of ΔΨm using CCCP causes rapid fragmentation of the mitochondrial reticulum [34-38]. This has been interpreted to mean that mitofusin activity depends on ΔΨm. It is therefore possible that H2O2 inhibits mitochondrial fusion by decreasing ΔΨm. Using flow cytometry, we observed that cells pretreated with 250 μM H2O2 for 1 hour showed reduced 575 nm median fluorescence (Fig. 4B). This finding suggests decreased loading of JC-1 into cells and decreased J-aggregate formation as a result of decreased ΔΨm. Salvioli et al. have shown that plasma membrane depolarization does not significantly affect JC-1 staining, while ΔΨm depolarization has a strong effect [27], so our results specifically indicate decreased ΔΨm. At the concentration of JC-1 used (2 μM), 525 nm fluorescence is saturated (Fig. S2), consistent with our observation that H2O2 pretreatment decreases 575 nm but not 525 nm fluorescence.
Overall, our findings in C2C12 cells agree with previous reports of the interplay between H2O2 and ΔΨm. Takeyama et al. showed that 500 μM H2O2 decreased ΔΨm in L929 fibroblasts by opening the mitochondrial permeability transition pore [39]. Chinopoulos et al. observed that H2O2 decreased ΔΨm, α-ketoglutarate dehydrogenase activity, and NAD(P)H levels in synaptosomes [40]. Nulton-Persson and Szweda showed that H2O2 inhibits succinate dehydrogenase and aconitase as well [41]. Because 250 μM H2O2 does not decrease viability in our cells, the hypothesis that H2O2 inhibits certain Krebs cycle enzymes, leading to decreased substrate input for oxidative phosphorylation and decreased ΔΨm, seems to be most plausible.
If ΔΨm decreases, we would predict consequent changes in respiration that can be measured using a Clark-type electrode. CCCP accelerates the rate of oxygen consumption by 400% within minutes (Fig. 5) but when H2O2 was added directly to cells, endogenous respiration did not increase in the following 15 minutes (not shown). Cells that had been pretreated with H2O2 for 1 or 5 hours showed higher endogenous respiration rates on average, but the difference was not statistically significant (Fig. S8A). However, H2O2 did decrease the CCCP-uncoupled (maximal) respiration rate (Fig. S8B). That is, H2O2-treated cells had lower reserve capacities for respiration (Fig. 5), a finding similar to that observed by Chen et al. [42] when both mitofusins were knocked down. Thus, the respiration of H2O2-treated cells resembles that of Mfn1/2-knockout cells, consistent with an abrogation of fusion.
With our flow cytometry and respiration measurements, we observed that H2O2-induced changes occurred within one hour (before any observable fragmentation) and persisted through the fifth hour post-treatment (contemporaneous with the full extent of fragmentation). The timing of these changes is therefore consistent with the hypothesis that decreased ΔΨm leads to fragmentation, rather than occurring as a consequence of fragmentation. However, other than through the use of CCCP, we were not able to directly manipulate ΔΨm to show that decreased ΔΨm is necessary and sufficient for mitochondrial network fragmentation. Because CCCP is a powerful, non-physiological stimulus, it is conceivable that it and H2O2 affect ΔΨm and/or mitochondrial morphology in fundamentally different ways. Further experiments would need to functionally assay for a fusion deficiency in H2O2-treated cells, perhaps using the PEG cell fusion assay described by Chen et al. [14, 42].
Before closing, it is appropriate to address the existence of a dynamic mitochondrial network in muscle and the possible role of H2O2 in modulating its dynamics in vivo. Despite the complicated internal structure of muscle, several studies have demonstrated the morphological plasticity of muscle mitochondria. Using electron microscopy, Green and colleagues (e.g., [43]) showed conformational changes in mitochondrial morphology in response to energy state. It is also known that the mass of the muscle mitochondrial network increases twofold in response to chronic exercise [24, 25]. We propose that ROS released from contracting muscle may be a stimulus to induce these changes. More recently, Chen et al. showed that the abolishment of mitochondrial fusion in skeletal muscle led to muscle atrophy and mtDNA instability— strong evidence for the functional significance of mitochondrial dynamics in muscle under normal conditions [16]. Additionally, mitochondrial dynamics may play an important role in the pathology of diseases involving oxidative stress, like type II diabetes [44]. It has been shown that obese and type II diabetic human subjects [45] and obese rats [29] display smaller skeletal muscle mitochondria than their lean counterparts. These authors show concomitant downregulation of Mfn2 gene expression [29, 46], but modulation of the mitochondrial network by ROS may also contribute. Now, in our report, we link H2O2 to transitory mitochondrial fragmentation in a muscle cell system in which mechanical forces are not an issue. This fragmentation is dose- and time-dependent, reversible, non-cytotoxic, and temporally offset from the H2O2 challenge. Additionally, we found that H2O2-induced decreases in mitochondrial membrane potential and maximal respiration rate precede mitochondrial fragmentation. We suggest that the observed changes mimic transitory changes that occur in response to exercise in vivo and provide one mechanism by which the aforementioned exercise-induced mitochondrial plasticity may occur.
Supplementary Material
Acknowledgments
We thank Holly Aaron, Steven Ruzin, and Tina Xu for assistance in microscopy; Kelly Dorgan, Raymond Chen, and Stacia Rodenbusch for setting up our oxygen electrode; and Hector Nolla for assistance in flow cytometry. Images were taken at the Molecular Imaging Center and flow cytometry was done at the Flow Cytometry Facility, both facilities of the Cancer Research Laboratory at UC Berkeley. This work was supported by NIH AR050459 and a grant from the UCB Undergraduate Research Apprentice Program.
List of abbreviations
- H2O2
Hydrogen peroxide
- ROS
reactive oxygen species
- CLSM
confocal laser scanning microscopy
- ΔΨm
inner mitochondrial membrane potential
- Drp1
dynamin-related protein 1
- Mfn1/2
mitofusin 1 and mitofusin 2
- OPA1
optic atrophy 1
- CCCP
carbonyl cyanide m-chlorophenyl hydrazone
- JC-1
5,5′,6,6′-tetrachloro-1,1′,3,3′-tetraethylbenzimidazolylcarbocyanine iodide
Footnotes
Publisher's Disclaimer: This is a PDF file of an unedited manuscript that has been accepted for publication. As a service to our customers we are providing this early version of the manuscript. The manuscript will undergo copyediting, typesetting, and review of the resulting proof before it is published in its final citable form. Please note that during the production process errors may be discovered which could affect the content, and all legal disclaimers that apply to the journal pertain.
Works Cited
- 1.Bakeeva LE, Chentsov YuS, Skulachev VP. Mitochondrial framework (reticulum mitochondriale) in rat diaphragm muscle. Biochim Biophys Acta. 1978;501:349–369. doi: 10.1016/0005-2728(78)90104-4. [DOI] [PubMed] [Google Scholar]
- 2.Kirkwood SP, Munn EA, Brooks GA. Mitochondrial reticulum in limb skeletal muscle. Am J Physiol Cell Physiol. 1986;251:C395–C402. doi: 10.1152/ajpcell.1986.251.3.C395. [DOI] [PubMed] [Google Scholar]
- 3.Ogata T, Yamasaki Y. Ultra-high-resolution scanning electron microscopy of mitochondria and sarcoplasmic reticulum arrangement in human red, white, and intermediate muscle fibers. Anat Rec. 1997;248:214–223. doi: 10.1002/(SICI)1097-0185(199706)248:2<214::AID-AR8>3.0.CO;2-S. [DOI] [PubMed] [Google Scholar]
- 4.Bereiter-Hahn J, Voth M. Dynamics of mitochondria in living cells: shape changes, dislocations, fusion, and fission of mitochondria. Microsc Res Tech. 1994;27:198–219. doi: 10.1002/jemt.1070270303. [DOI] [PubMed] [Google Scholar]
- 5.Chan DC. Mitochondrial fusion and fission in mammals. Annu Rev Cell Dev Biol. 2006;22:79–99. doi: 10.1146/annurev.cellbio.22.010305.104638. [DOI] [PubMed] [Google Scholar]
- 6.Hoppins S, Lackner L, Nunnari J. The machines that divide and fuse mitochondria. Annu Rev Biochem. 2007;76:751–780. doi: 10.1146/annurev.biochem.76.071905.090048. [DOI] [PubMed] [Google Scholar]
- 7.Labrousse AM, Zappaterra MD, Rube DA, van der Bliek AM. C. elegans dynamin-related protein DRP-1 controls severing of the mitochondrial outer membrane. Mol Cell. 1999;4:815–826. doi: 10.1016/s1097-2765(00)80391-3. [DOI] [PubMed] [Google Scholar]
- 8.Hom JR, Gewandter JS, Michael L, Sheu S, Yoon Y. Thapsigargin induces biphasic fragmentation of mitochondria through calcium-mediated mitochondrial fission and apoptosis. J Cell Physiol. 2007;212:498–508. doi: 10.1002/jcp.21051. [DOI] [PubMed] [Google Scholar]
- 9.Chang CR, Blackstone C. Cyclic AMP-dependent protein kinase phosphorylation of Drp1 regulates its GTPase activity and mitochondrial morphology. J Biol Chem. 2007;282:21583–21587. doi: 10.1074/jbc.C700083200. [DOI] [PubMed] [Google Scholar]
- 10.Yu T, Robotham JL, Yoon Y. Increased production of reactive oxygen species in hyperglycemic conditions requires dynamic change of mitochondrial morphology. Proc Natl Acad Sci USA. 2006;103:2653–2658. doi: 10.1073/pnas.0511154103. [DOI] [PMC free article] [PubMed] [Google Scholar]
- 11.Benard G, Bellance N, James D, Parrone P, Fernandez H, Letellier T, Rossignol R. Mitochondrial bioenergetics and structural network organization. J Cell Sci. 2007;120:838–848. doi: 10.1242/jcs.03381. [DOI] [PubMed] [Google Scholar]
- 12.Cribbs JT, Strack S. Reversible phosphorylation of Drp1 by cyclic AMP-dependent protein kinase and calcineurin regulates mitochondrial fission and cell death. EMBO Rep. 2007;8:939–944. doi: 10.1038/sj.embor.7401062. [DOI] [PMC free article] [PubMed] [Google Scholar]
- 13.Koshiba T, Detmer SA, Kaiser JT, Chen H, McCaffery JM, Chan DC. Structural basis of mitochondrial tethering by mitofusin complexes. Science. 2004;305:858–862. doi: 10.1126/science.1099793. [DOI] [PubMed] [Google Scholar]
- 14.Chen H, Detmer SA, Ewald AJ, Griffin EE, Fraser SE, Chan DC. Mitofusins Mfn1 and Mfn2 coordinately regulate mitochondrial fusion and are essential for embryonic development. J Cell Biol. 2003;160:189–200. doi: 10.1083/jcb.200211046. [DOI] [PMC free article] [PubMed] [Google Scholar]
- 15.Davies VJ, Hollins AJ, Piechota MJ, Yip W, Davies JR, White KE, Nicols PP, Boulton ME, Votruba M. Opa1 deficiency in a mouse model of autosomal dominant optic atrophy impairs mitochondrial morphology, optic nerve structure and visual function. Hum Mol Gen. 2007;16:1307–1318. doi: 10.1093/hmg/ddm079. [DOI] [PubMed] [Google Scholar]
- 16.Chen H, Vermulst M, Wang YE, Chomyn A, Prolla TA, McCaffery JM, Chan DC. Mitochondrial fusion is required for mtDNA stability in skeletal muscle and tolerance of mtDNA mutations. Cell. 2010;141:280–289. doi: 10.1016/j.cell.2010.02.026. [DOI] [PMC free article] [PubMed] [Google Scholar]
- 17.Jendrach M, Mai S, Pohl S, Voth M, Bereiter-Hahn J. Short-and long-term alterations of mitochondrial morphology, dynamics and mtDNA after transient oxidative stress. Mitochondrion. 2008;8:293–304. doi: 10.1016/j.mito.2008.06.001. [DOI] [PubMed] [Google Scholar]
- 18.Barsoum MJ, Yuan H, Gerencser AA, Liot G, Kushnareva Y, Graber S, Kovacs I, Lee WD, Waggoner J, Cui J, White AD, Bossy B, Martinou JC, Youle RJ, Lipton SA, Ellisman MH, Perkins GA, Bossy-Wetzel E. Nitric oxide-induced mitochondrial fission is regulated by dynamin-related GTPases in neurons. EMBO J. 2006;25:3900–3911. doi: 10.1038/sj.emboj.7601253. [DOI] [PMC free article] [PubMed] [Google Scholar]
- 19.Davies KJ, Quintanilha AT, Brooks GA, Packer L. Free radicals and tissue damage produced by exercise. Biochem Biophys Res Commun. 1982;107:1198–1205. doi: 10.1016/s0006-291x(82)80124-1. [DOI] [PubMed] [Google Scholar]
- 20.Jackson MJ, Edwards RH, Symons MC. Electron spin resonance studies of intact mammalian skeletal muscle. Biochim Biophys Acta. 1985;847:185–90. doi: 10.1016/0167-4889(85)90019-9. [DOI] [PubMed] [Google Scholar]
- 21.Pattwell DM, McArdle A, Morgan JE, Patridge TA, Jackson MJ. Release of reactive oxygen and nitrogen species from contracting skeletal muscle cells. Free Radic Biol Med. 2004;37:1064–1072. doi: 10.1016/j.freeradbiomed.2004.06.026. [DOI] [PubMed] [Google Scholar]
- 22.Silveira LR, Pereira-da-Silva L, Juel C, Hellsten Y. Formation of hydrogen peroxide and nitric oxide in rat skeletal muscle cells during contractions. Free Radic Biol Med. 2003;35:455–464. doi: 10.1016/s0891-5849(03)00271-5. [DOI] [PubMed] [Google Scholar]
- 23.Davies KJ, Packer L, Brooks GA. Biochemical adaptation of mitochondria, muscle, and whole-animal respiration to endurance training. Arch Biochem Biophys. 1981;209:539–554. doi: 10.1016/0003-9861(81)90312-x. [DOI] [PubMed] [Google Scholar]
- 24.Holloszy JO. Biochemical adaptations in muscle. Effects of exercise on mitochondrial oxygen uptake and respiratory enzyme activity in skeletal muscle. J Biol Chem. 1967;242:2278–2282. [PubMed] [Google Scholar]
- 25.Kirkwood SP, Packer L, Brooks GA. Effects of endurance training on a mitochondrial reticulum in limb skeletal muscle. Arch Biochem Biophys. 1987;255:80–88. doi: 10.1016/0003-9861(87)90296-7. [DOI] [PubMed] [Google Scholar]
- 26.King DW, Gollnick PD. Ultrastructure of rat heart and liver after exhaustive exercise. Am J Physiol. 1970;218:1150–1155. doi: 10.1152/ajplegacy.1970.218.4.1150. [DOI] [PubMed] [Google Scholar]
- 27.Salvioli S, Ardizzoni A, Franceschi C, Cossarizza A. JC-1, but not DiOC6(3) or rhodamine 123, is a reliable fluorescent probe to assess ΔΨ changes in intact cells: implications for studies on mitochondrial functionality during apoptosis. FEBS Lett. 1997;411:77–82. doi: 10.1016/s0014-5793(97)00669-8. [DOI] [PubMed] [Google Scholar]
- 28.Cassart D, Fett T, Sarlet M, Baise E, Coignoul F, Desmecht D. Flow cytometric probing of mitochondrial function in equine peripheral blood mononuclear cells. BMC Vet Res. 2007;3 doi: 10.1186/1746-6148-3-25. [DOI] [PMC free article] [PubMed] [Google Scholar]
- 29.Bach D, Pich S, Soriano FX, Vega N, Baumgartner B, Oriola J, Daugaard JR, Lloberas J, Camps M, Zierath JR, Rabasa-Lhoret R, Wallberg-Henriksson H, Laville M, Palacin M, Vidal H, Rivera F, Brand M, Zorzano A. Mitofusin-2 determines mitochondrial network architecture and mitochondrial metabolism. A novel regulatory mechanism altered in obesity. J Biol Chem. 2003;278:17190–17197. doi: 10.1074/jbc.M212754200. [DOI] [PubMed] [Google Scholar]
- 30.Suen DF, Norris KL, Youle RJ. Mitochondrial dynamics and apoptosis. Genes & Dev. 2008;22:1577–1590. doi: 10.1101/gad.1658508. [DOI] [PMC free article] [PubMed] [Google Scholar]
- 31.Cereghetti GM, Stangherlin A, Martins de Brito O, Chang CR, Blackstone C, Bernardi P, Scorrano L. Dephosphorylation by calcineurin regulates translocation of Drp1 to mitochondria. Proc Natl Acad Sci USA. 2008;103:15803–15808. doi: 10.1073/pnas.0808249105. [DOI] [PMC free article] [PubMed] [Google Scholar]
- 32.Han XJ, Lu YF, Li SA, Tomizawa K, Takei K, Matsushita M, Matsui H. Involvement of calcineurin in glutamate-induced mitochondrial dynamics in neurons. Neurosci Res. 2008;60:114–119. doi: 10.1016/j.neures.2007.09.012. [DOI] [PubMed] [Google Scholar]
- 33.Han XJ, Lu YF, Li SA, Kaitsuka T, Sato Y, Tomizawa K, Nairn AC, Takei K, Matsui H, Matsushita M. CaM kinase lα-induced phosphorylation of Drp1 regulates mitochondrial morphology. J Cell Biol. 2008;182:573–585. doi: 10.1083/jcb.200802164. [DOI] [PMC free article] [PubMed] [Google Scholar]
- 34.Legros F, Lombes A, Frachon P, Rojo M. Mitochondrial fusion in human cells is efficient, requires the inner membrane potential, and is mediated by mitofusins. Mol Biol Cell. 2002;13:4343–4354. doi: 10.1091/mbc.E02-06-0330. [DOI] [PMC free article] [PubMed] [Google Scholar]
- 35.Ishihara N, Jofuku A, Eura Y, Mihara K. Regulation of mitochondrial morphology by membrane potential, and DRP1-dependent division and FZO1-dependent fusion reaction in mammalian cells. Biochem Biophys Res Commun. 2003;301:891–898. doi: 10.1016/s0006-291x(03)00050-0. [DOI] [PubMed] [Google Scholar]
- 36.Mattenberger Y, James DI, Martinou JC. Fusion of mitochondria in mammalian cells is dependent on the mitochondrial inner membrane potential and independent of microtubules or actin. FEBS Lett. 2003;538:53–59. doi: 10.1016/s0014-5793(03)00124-8. [DOI] [PubMed] [Google Scholar]
- 37.Meeusen S, McCaffery MJ, Nunnari J. Mitochondrial fusion intermediates revealed in vitro. Science. 2004;305:1747–1752. doi: 10.1126/science.1100612. [DOI] [PubMed] [Google Scholar]
- 38.Malka F, Guillery O, Cifuentes-Diaz C, Guillou E, Belenguer P, Lombes A, Rojo M. Separate fusion of outer and inner mitochondrial membranes. EMBO Rep. 2005;6:853–859. doi: 10.1038/sj.embor.7400488. [DOI] [PMC free article] [PubMed] [Google Scholar]
- 39.Takeyama N, Miki S, Hirakawa A, Tanaka T. Role of the mitochondrial permeability transition and cytochrome C release in hydrogen peroxide-induced apoptosis. Exp Cell Res. 2002;274:16–24. doi: 10.1006/excr.2001.5447. [DOI] [PubMed] [Google Scholar]
- 40.Chinopoulos C, Tretter L, Adam-Vizi V. Depolarization of in situ mitochondria due to hydrogen peroxide-induced oxidative stress in nerve terminals: inhibition of alpha-ketoglutarate dehydrogenase. J Neurochem. 1999;73:220–228. doi: 10.1046/j.1471-4159.1999.0730220.x. [DOI] [PubMed] [Google Scholar]
- 41.Nulton-Persson AC, Szweda LI. Modulation of mitochondrial function by hydrogen peroxide. J Biol Chem. 2001;276:23357–23361. doi: 10.1074/jbc.M100320200. [DOI] [PubMed] [Google Scholar]
- 42.Chen H, Chomyn A, Chan DC. Disruption of fusion results in mitochondrial heterogeneity and dysfunction. J Biol Chem. 2005;280:26185–26192. doi: 10.1074/jbc.M503062200. [DOI] [PubMed] [Google Scholar]
- 43.Green DE, Ji S. Transductional and structural principles of the mitochondrial transducing unit. Proc Natl Acad Sci USA. 1973;70:904–908. doi: 10.1073/pnas.70.3.904. [DOI] [PMC free article] [PubMed] [Google Scholar]
- 44.Brownlee M. Biochemistry and molecular cell biology of diabetic complications. Nature. 2001;414:813–820. doi: 10.1038/414813a. [DOI] [PubMed] [Google Scholar]
- 45.Kelley DE, He J, Menshikova EV, Ritov VB. Dysfunction of mitochondria in human skeletal muscle in type 2 diabetes. Diabetes. 2002;51:2944–50. doi: 10.2337/diabetes.51.10.2944. [DOI] [PubMed] [Google Scholar]
- 46.Bach D, Naon D, Pich S, Soriano FX, Vega N, Rieusset J, Laville M, Guillet C, Boirie Y, Wallberg-Henriksson H, Manco M, Calvani M, Castagneto M, Palacin M, Mingrone G, Zierath JR, Vidal H, Zorzano A. Expression of Mfn2, the Charcot-Marie-Tooth neuropathy type 2A gene, in human skeletal muscle: effects of type 2 diabetes, obesity, weight loss, and the regulatory role of tumor necrosis factor alpha and interleukin-6. Diabetes. 2005;54:2685–93. doi: 10.2337/diabetes.54.9.2685. [DOI] [PubMed] [Google Scholar]
Associated Data
This section collects any data citations, data availability statements, or supplementary materials included in this article.