

Abstract
Background
Alternans of intracellular Ca2+ (Cai) underlies T-wave alternans, a predictor of cardiac arrhythmias. A related phenomenon, T-Wave Lability (TWL), precedes Torsade de Pointes (TdP) in patients and animal models with impaired repolarization. However, the role of Cai in TWL remains unexplored.
Methods
Action potentials (APs) and Cai transients, (CaTs) were mapped optically from paced Langendorff female rabbit hearts (n=8) at 1.2s cycle length, after AV node ablation. Hearts were perfused with normal Tyrode's solution then with dofetilide (0.5 μM) and reduced [K+] (2 mM) and [Mg2+] (0.5 mM) to elicit long QT type 2 (LQT2). Lability of EKG, voltage and Cai signals were evaluated during regular paced rhythm, before and after dofetilide perfusion.
Results
In LQT2, lability of Cai, voltage and EKG signals increased during paced rhythm, before the appearance of early afterdepolarizations (EADs). LQT2 resulted in AP prolongation and multiple (1-3) additional Cai upstrokes, while APs remained monophasic. When EADs appeared, Cai rose before voltage upstrokes at the origins of propagating EADs. Interventions (i.e. ryanodine and thapsigargin, n=3 or low [Ca]o and nifedipine, n=4) that suppressed Cai oscillations also abolished EADs.
Conclusions
In LQT2, Cai oscillations (CaiO) precede EADs by minutes, indicating that they result from spontaneous sarcoplasmic reticulum Ca2+ release rather than spontaneous ICaL reactivation. CaiO likely produce oscillations of Na/Ca exchange current, INCX. Depolarizing INCX during the AP plateau contributes to the generation of EADs by re-activating Ca2+-channels that have recovered from inactivation. TWL reflects CaTs and APs lability that occur before EADs and TdP.
Key Words and Abbreviations: Electrophysiology; Calcium Oscillations; Long QT syndrome, (LQTS); T-Wave Lability, TWL; Simultaneous optical mapping of voltage and calcium; impaired repolarization
Introduction
The prolongation of ventricular action potential duration (APD) and QT interval often leads to life-threatening polymorphic ventricular tachycardia (VT) that exhibit a characteristic EKG appearance known as Torsade de Pointes (TdP). Acquired long QT (LQT) is of critical importance because of its prevalence in the clinical setting. Several factors (e.g. medications, electrolyte abnormalities and heart failure) impair ventricular repolarization and may lead to lethal arrhythmias. LQTS is also of conceptual importance, because the congenital form represents a “pure global repolarization disease”,1 which demonstrates a direct link between repolarization delay and sudden cardiac death (SCD).2 Although the molecular defects leading to prolonged APDs in congenital LQTS have been elucidated in remarkable detail,3 the mechanism by which impaired repolarization causes VT on the tissue level remains less clear.4-6 Two hypotheses, which are not mutually exclusive, have been proposed. First, prolonged APDs result in triggered activity in the form of early afterdepolarizations (EADs).2 Second, spatially heterogeneous APD prolongation leads to increased dispersion of refractoriness and may form a substrate for functional reentry.3, 4
Clinically, prolonged APD is reflected on the surface EKG as QT interval prolongation. Several forms of temporal repolarization instability, such as microvolt T wave alternans (mTWA)7,8 and increased QT interval variability9-11 (QTV), have been linked to SCD in clinical and experimental settings. Multiple lines of evidence suggest that Cai alternans leads to APD alternans and mTWA.12-14 However, arrhythmias during impaired repolarization are classically associated with bradycardia or pauses, whereas mTWA is usually a tachycardia-induced phenomenon. Microvolt TWA is not frequently observed in LQT,15,16 and may not be necessary for induction of LQT-related arrhythmias. On the other hand, non-alternans T wave lability (TWL) precedes TdP in LQTS patients17,18 as well as in animal models of prolonged repolarization.19,20 TWL refers to beat-to-beat changes in T wave morphology, which do not follow an alternans (i.e. ABAB…) pattern. It appears to be a better predictor of arrhythmia than the absolute degree of repolarization delay.
The mechanisms underlying non-alternans repolarization lability are a matter of speculation and the possible role of abnormal Ca2+ handling in this phenomenon remains unexplored. It is possible that TWL is caused by the same process that drives EADs, but generates depolarizations of insufficient amplitude to trigger propagating waves.
EADs have been classically attributed to the spontaneous reactivation of the L-type Ca2+ current, ICaL, during the abnormally long APD and slow AP downstroke.21,22 Alternatively, spontaneous Ca2+ release from the sarcoplasmic reticulum (SR) during phase 2 or phase 3 of the AP can further depolarize the plateau potential through the activation of the electrogenic Na/Ca exchanger (NCX).5 A similar mechanism has been documented as the trigger of delayed afterdepolarizations (DADs), but its role for EADs remains controversial. In cryoablated rabbit hearts, simultaneous mapping of transmembrane voltage (Vm) and cytoplasmic free Ca2+ (Cai) in drug-induced LQT2 showed that a rapid increase in Cai precedes the rise of Vm at the first sites that fire EADs on the epicardium.23 The dynamic relationship between Cai and Vm during an EAD supports the notion that SR Ca2+ overload and spontaneous SR Ca2+ release activate an inward NCX current (INCX) which triggers ICa,L to produce EADs. However, EADs initiated by oxidative stress (with hydrogen peroxide, H2O2 0.2-1 mM) were attributed to Ca2+/Calmodulin kinase (CaMKII) activation which increased ICaL, impaired inactivation of ICa,L and of voltage-gated Na+ current (INa).24 Still, SR Ca2+ release should not be excluded as the trigger of EADs because H2O2 acts at numerous targets, including ryanodine receptor, NCX and SR Ca2+ pump.
In this report, we investigated the role of Cai dynamics on TWL in a non-cryoablated rabbit model of LQT2 using simultaneous measurements of Cai transient (CaT), AP and EKG during paced rhythms and focused on events that precede ventricular ectopy.
Methods
Heart preparations
New Zealand White rabbits (female, 60-120 days old) were anesthetized with pentobarbital (35 mg / kg I.V.) and anti-coagulated with heparin (200 U/ kg I.V.). The heart was perfused with Tyrode's solution (mM): 130 NaCl, 24 NaHCO3, 1.0 MgCl2, 4 KCl, 1.2 NaH2PO4, 50 dextrose, 1.25 CaCl2, gassed with 95% O2–5 % CO2. The atrioventricular node was destroyed with electrocautery to control heart rate. To minimize motion artifact, blebbistatin (5-10 μM for ∼ 15 min) was added to the perfusate. The heart was immobilized in a chamber and stained with a voltage-sensitive dye (RH 237: 200 μl of 1 mg/ml dimethyl sulfoxide, DMSO) and loaded with a Ca2+ indicator (Rhod-2 AM, 200 μl of 1 mg/ml DMSO). Epicardial bipolar pseudo-EKG was continuously monitored. Epicardial pacing with a unipolar electrode on the right ventricle was performed at cycle length 1.2 s (50 bpm; bradycardia for rabbit hearts). After baseline recordings, LQT2 was imposed by perfusing with Tyrode's containing dofetilide (250-500 nM, Pfizer), a selective IKr blocker and lowering K+ and Mg2+ concentrations by 50 %.25 This investigation conformed to the current Guide for Care and Use of Laboratory Animals published by the National Institutes of Health.
Optical apparatus
The optical apparatus based on two photodiode arrays has been described previously.26 The anterior surface of the heart was illuminated with a 520 ± 30 nm excitation beam and the fluorescence was passed through a dichroic mirror (660 nm) to focus the Rhod-2 and RH 237 fluorescence images on two 16 × 16 photodiode arrays (Hamamatsu Corp. C4675–103). Outputs from the arrays were amplified, digitized at 1 kHz frequency and stored in computer memory, along with surface EKG.
Data analysis
Automatic measurement of APD and CaT duration (CaTD) from all pixels was used to calculate APD and CaTD dispersion, defined as the standard deviation of APD /CaTD values. Activation time at each site was calculated from (dFv/dt)max of the local AP upstroke, and APD (CaTD) at each site was the interval from (dFv/dt)max to the recovery of Vm (Cai) to 10% of baseline (APD90 or CaTD90). Isochronal maps of APD and CaT duration were generated as previously described.26
In addition, custom-software was created in C++ (Microsoft Visual Studio 6.0, Micorsoft Corp., Redmond, WA) for data analysis. Signals were digitally low-pass filtered (3-pole Bessel filter, 20Hz) and baseline fluctuations were subtracted with a smooth cubic spline. Optical signals were evaluated from 5 pixels (2-8, 8-2, 8-8, 15-8, 8-15; the numbers stand for the x-y pixel coordinates of the 16×16 array). Simultaneous EKG, Vm and Cai signals were displayed and durations were measured with electronic calipers. During each scan (typically lasting 32 s), the interval from pacing stimulus to end of the T wave (the “QT interval” equivalent) and the local duration of Vm and Cai signals were measured in 2 beats and averaged. The number of Cai peaks per AP was determined visually and were averaged over 2 beats from 5 pixels in each of the 32 s scans. Except for the dispersions of APD and CaTD, the average value taken over these 5 pixels were used for subsequent analysis.
The lability of T waves, Vm and Cai signals was calculated as previously reported.16 Briefly, the EKG, Vm or Cai signals from each beat (unless excluded due to poor signal quality or subsequent PVC) were superimposed using the stimulation artifact, and the root-mean-square of the beat-to-beat differences in signal amplitude measured at corresponding time points of the repolarization segment (150 ms to 900 ms after the stimulus) were calculated. The maximal root-mean-square value (corresponding to the most labile time point) was normalized to the amplitude of the signal-averaged QRS complex (defined as the maximum minus the minimum value, evaluated 10-900 ms after stimulation artifact, thus including the QRS complex). The reported T wave, Vm and Cai lability values are taken as a natural logarithm of the normalized root-mean-square values (Table 1).
Table 1.
Summary of EKG, Vm and Cai parameters under control and LQT2 conditions The asterix indicates that Cai lability was calculated from 2 beats preceding EAD onset, at the site of EAD origin.
| Parameter | Baseline | Dofetilide, before Ectopy | p |
|---|---|---|---|
| APD (ms) | 415±118 | 678±235 | p<0.01 |
| CaTD (ms) | 474±144 | 702±227 | p<0.005 |
| QT (ms) | 481±105 | 603±172 | p<0.05 |
| # of Cai peaks | 1.332±0.387 | 2.120±0.469 | p<0.002 |
| T wave lability | -4.061±0.944 | -2.894±0.950 | p<0.002 |
| AP lability | -3.436±0.492 | -2.994±0.779 | p<0.05 |
| Cai lability | -3.338± 0.372 | -2.970±0.647 | p=0.084 |
| Cai lability* | -4.049±0.685 | -3.356±1.033 | p<0.05 |
| Vm × Cai correlation | 0.9593±0.0231 | 0.8967±0.0644 | p<0.02 |
The correlation coefficient between Vm and Cai signal values during the repolarization segment of the last paced beat not followed by EAD were calculated from 5 pixels as described above and averaged. Again, these values were compared to the corresponding values prior to dofetilide perfusion. Unless described otherwise, two-tailed paired Student t-test (Excel, Microsoft Corp., Redmond, WA) was used to compare signal values obtained from baseline data segments with data segments after dofetilide perfusion, but before the onset of ventricular ectopy. P-values of <0.05 were considered statistically significant.
Results
TdP was induced by dofetilide perfusion in all hearts (n=8) in < 10 minutes and was preceded by short-coupled premature ventricular beats (PVBs). PVBs on the EKG corresponded to EADs on optical Vm tracings. In all cases, the onset of EADs was preceded by prolongation of APD (415±118 vs. 678±235 ms; p<0.01) and of CaT duration (474±144 vs. 702±227 ms; p<0.005) as compared to controls. The QT interval determined from epicardial EKG also prolonged markedly (481±105 vs. 603±172 ms; p<0.02). Occasionally, ectopic ventricular beats with late coupling and Vm tracing suggestive of DADs were observed.
Beat-to-beat lability of repolarization, AP and CaT
TWL increased in all experiments prior to the onset of arrhythmia (-4.061±0.944 vs. -2.894±0.950; n = 8, p<0.002). TWL corresponded to discernible changes of T wave morphology during regular rhythms preceding ventricular arrhythmias (Fig. 1). In contrast, macrovolt T wave alternans was never observed before the onset of ventricular ectopy (n=8). Similarly, the beat-to-beat lability of optical Vm signals increased prior to VT onset (-3.436±0.492 vs. -2.994±0.779; p<0.05). There was a trend towards an increase in CaT lability prior to VT onset which did not reach statistical significance (-3.338± 0.372 vs. -2.970±0.647; p=0.084). However, at sites of EAD origin, CaT lability was significantly higher compared to baseline for the 2 consecutive beats preceding the onset of EADs (-4.049±0.685 vs.-3.356±1.033; p<0.05). Table 1 summarizes these EKG, Vm and Cai parameters before and after the induction of LQT2 but before the onset of ectopic beats.
Figure 1.
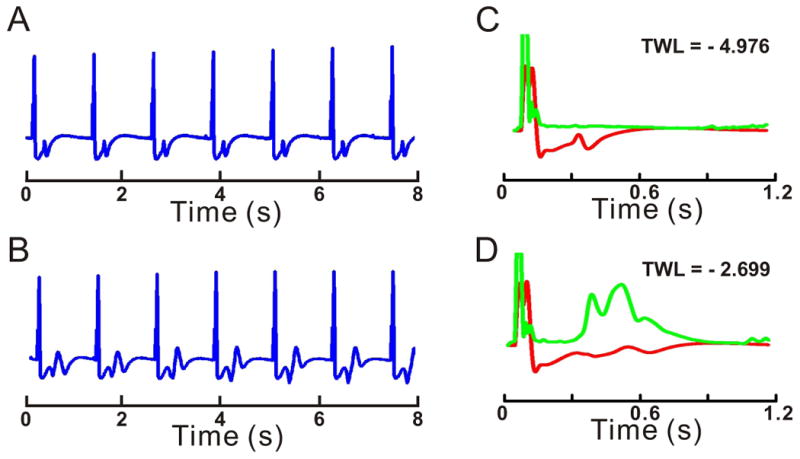
Prolonged repolarization induces TWL
Examples of EKG recordings during pacing at 50 beats per min: (A) Control and (B) LQT2. T-wave morphology is constant in A, but changes on a beat-to-beat basis in B. EKG lability (green traces) is plotted before (C) and during LQT2 (D) and is superimposed on signal-averaged EKG (red traces). The Y-axis for lability is expanded 10-fold with respect to signal-averaged EKG. TWL is calculated as the logarithm of maximum EKG lability measured during the repolarization phase and normalized with respect to the amplitude of signal-averaged QRS. TWL is essentially absent in C and highly pronounced in D. Maximum lability occurs at ∼470 ms after the pacing stimulus in this case.
CaT oscillations
Besides beat-to-beat lability, CaT exhibited other forms of instability. Normal CaTs were monophasic (a single Cai peak followed by a recovery to baseline) with Cai rising ∼10 ms after the rise of Vm. Occasionally, a small secondary rise in Cai appeared during phase 3 of the AP at a few sites. Perfusion with dofetilide increased the complexity of CaT kinetics in all hearts, with the appearance of multiple Cai peaks (Fig. 2 and 3). The average number of CaT peaks occurring during a single AP increased significantly prior to the onset of EADs (1.332±0.387 vs. 2.120±0.469; p<0.002). Interestingly, up to 4 distinct Cai peaks could be seen in some experiments, while the corresponding local AP remained monophasic, with a smooth downstroke during phase 2 and 3 (Fig. 2B). Cai oscillations (CaiO) preceded the onset of EADs in all experiments.
Figure 2.

CaiO precede EADs
Simultaneous recordings of Vm (blue) and Cai (red) before (A) and during LQT2 (B,C).
A: Vm and Cai are shown at slow (top) and fast (bottom) sweep speeds and both exhibit monophasic time-courses.
B: Vm and Cai are shown at slow (top) and fast (bottom) sweep speeds. In the first 2 APs, LQT2 condition prolonged APD and elicited Cai oscillations during the paced beats with no Vm instabilities. The 3rd AP exhibited multiple Cai peaks which were occasionally coincident with EADs.
C: An example of TdP onset following the 5th paced beat. The EKG (top trace) and the optical traces of Vm and Cai (bottom traces) were recorded simultaneously. The CaiO precede the first EADs at this site.
Figure 3.

Time-dependent oscillations of Cai and the evolution of EADs
Vm (blue) and Cai (red) measurements (left) during pacing (A, B) and ventricular escape rhythms (C, D) and the corresponding phase-plots (right).
A. In control, Vm and Cai are monophasic and similar in shape. B: LQT2 for 3 min, a 2nd rise of Cai appears during the AP plateau while Vm remains free of EADs. C: LQT2 for 6 min promotes more complex CaiO that are associated with a single EAD. In this pixel, the Cai upstroke precedes the Vm upstroke. D: LQT2 for 9 min, 2 consecutive EADs follow each AP upstroke. Prominent Cai upstrokes precede EAD upstrokes.
Figure 4A illustrates a marked spatial heterogeneity of Vm and Cai signals during dofetilide perfusion, but before the onset of EADs. An isochronal map of APD90 shows a marked APD prolongation (pixel 1) that decreased anisotropically. Before the onset of EADs, the correlation between Vm and Cai signals during repolarization decreased in all experiments (0.9593±0.0231 vs. 0.8967±0.0644; p<0.02, 2-tailed sign test), representing an increasing dissociation between the oscillatory Cai signal and the monophasic shape and time-course of APs. In paced beats immediately preceding appearance of EADs, the spatial dispersion of CaT duration (CaTD90) exceeded the dispersion of APD90 (65±29 vs. 52±35 ms; p<0.02).
Figure 4.

Spatial and temporal heterogeneity of CaT and APs during LQT2
A: Isochronal Map of APD90 (A (a), top left) from the anterior surface in LQT2; the field-of-view of the array is shown (see inset d) and isochronal lines are 50 ms apart (see color scale). Cai signals recorded at each site are depicted in the symbolic map of the photodiode array (b). Simultaneous Vm and Cai from a single-beat are superimposed for pixels labeled 1, 2 and 3 on the maps and are shown at fast sweep speed (c). Marked spatial heterogeneities of CaiO appear; with the highest number of CaiO found at sites with the longest APDs and decrease in going to sites with shorter APDs.
B: EKG, Vm and Cai recordings from pixel (1) for 30 s show a gradual APD prolongation associated with an increasing number of CaiO and a rise of diastolic Cai. The right panel shows a shorter segment of the signals (in green box on left) with better time resolution.
During a normal AP, CaTs are tightly controlled by Vm and AP upstrokes preceded the rise of Cai with a delay of 10±2 ms.23 With the appearance of premature ventricular beats, EAD upstrokes often coincided with a secondary CaT peak. In 3 out of 8 experiments, the 1st EAD occurred outside of the field-of-view of the optical maps. In 2 out of 5 experiments where the 1rst EAD fell in the field-of-view of the array, the 2nd rise of Cai preceded the 2nd Vm upstroke by 3-5 ms, and this temporal relationship reversed gradually as the EAD propagated away from its origin (Fig. 5). In 3 out of 8 experiments, EAD upstrokes preceded Cai upstrokes but with shorter Vm- Cai delays of 5-7 ms compared to delays during normal APs. CaiO preceding EAD upstrokes (Fig. 2B, 3C and 3D) were routinely observed during complex ectopy, such as bigeminy and trigeminy and VT runs.
Figure 5.

Propagation of Vm and Cai upstrokes during an EAD
A: Isochronal activation map of an ectopic beat (EAD) occurring during an escape rhythm. The origin of the EAD is at site 1. Isochronal lines are 3 ms apart. Note that another independent wavefront emanates from the base of the heart.
B: Vm and Cai tracings from sites: 1 and 3 in (A). The 1rst AP and CaT are monophasic at site 1; during the 2nd AP, there is a distinct 2nd Cai peak without an EAD (arrow). On the 3rd beat, an EAD appears with sufficient magnitude to propagate, as in A.
C: The temporal relationship between Cai and Vm signals are shown at higher resolution at sites 1-3 as labeled in A. At the site of EAD origin (1), Cai upstroke precedes Vm upstroke (8 ms); at site 2, Vm is coincident with Cai and at site 3, remote from the EAD origin, Vm precedes Cai (3 ms).
As illustrated in Figure 6, a bigeminy pattern on EKG corresponded to a CaiO with an EAD during each beat (Fig. 6A). Similarly, trigeminy corresponded to beat-to-beat alternations of a large CaiO with an EAD followed by a smaller Cai oscillation without an EAD on the next beat (Fig. 6B). Non-sustained runs of polymorphic VT corresponded to long CaT with multiple CaiO (Fig. 6C).
Figure 6.

EKG recordings of complex ectopy: Bigeminy and Trigeminy correspond to CaiO
A: EKG recording of paced rhythm with bigeminy. Each paced beat (green arrows) is followed by a ventricular ectopic beat (red arrow). T-waves on EKG signals are indicated by black arrows. Note that neither Vm nor Cai recover to baseline before the ectopic beat; in this sense, the paced/ectopic beat can be understood as a single complex AP.
B: An episode of trigeminy from the same experiment. Two paced beats are followed by an ectopic beat. The optical tracings indicate that alternans between a short monophasic paced AP and a “bigeminal” AP underlies the trigeminal pattern.
C: Simultaneous EKG and Cai tracing with brief runs of polymorphic VT. Pacing rate was 50 bpm with 2:1 capture. Each run of polymorphic VT corresponds to a single CaT with multiple secondary CaiO.
TdP is suppressed by interventions which abolish CaiO
To corroborate the role of spontaneous SR Ca2+ release in eliciting EADs and TdP, several interventions were tested to reduce SR Ca2+ load in attempts to suppress CaiO and the generation of TdP. As shown in Figure 7, nifedipine (5 μM) (A) and low external Ca2+ (100 μM) (B) suppressed Cai oscillations, EADs and TdP (n=4 for each intervention), although APD remained prolonged. Restoration of original Ca2+ resulted in reappearance of CaiO and TdP. In other experiments (n=3), the hearts were perfused with Tyrode's containing ryanodine and thapsigargin (10 μM and 200 nM, respectively) to deplete SR prior to perfusion with dofetilide. In the presence of ryanodine and thapsigargin, dofetilide prolonged APD, but CaiO and TdP failed to occur.
Figure 7.

Effect of Reduced SR Ca2+ load on CaiO and TdP
TdP was induced with LQT2 solution then nifedipine (5 μM) was added (A) or external Ca2+ was lowered (100 μM) (B) in the perfusate. Both interventions attenuated CaiO and terminated TdP despite continuous dofetilide perfusion and marked APD prolongation.
Discussion
The main finding of this report is that under LQT2 conditions, CaT oscillations occur in ventricular myocardium during regular rhythm. They are not caused by oscillations of membrane potential, which they precede by minutes. When EADs do appear, they usually follow CaT upstroke at the site of EAD origin.
Although Cai oscillations under LQT conditions have been reported before, they were always described in the presence of EADs and often understood as a consequence of ICaL reactivation with consequent calcium-induced calcium release. Since the timing of Cai and Vm upstrokes is often similar and their relationship may be spatially heterogenous, this explanation was difficult to disprove. Here, we show that CaT oscillations consistently occur minutes before the appearance of EADs, at the time when AP downstroke remains smooth and monophasic. Interventions which abolish CaT oscillations also abolish TdP. These findings indicate that the secondary CaT peaks are caused by instabilities of intracellular Ca2+ handling caused by AP prolongation. These instabilities in turn promote the appearance of EADs and, eventually, TdP.
CaT oscillations drive EADs
The driving role of Cai oscillations in EAD generation is supported by the analysis of CaT and AP relationship at the site of EAD focus. At the origins of EADs, the rise of Cai preceded the EAD depolarization (n=2/5). At sites remote from EAD foci, Vm preceded Cai, which is expected if voltage is responsible for EAD propagation. At sites of earliest EAD upstroke, Cai followed the EAD depolarization in 3/5 hearts; even then, the short Vm-Cai delays (< 7 ms) suggested that normal voltage-driven SR Ca2+ release did not occur. In such cases, the EAD most likely emanated from deeper in the myocardial wall and propagated to the epicardial surface. In cryoablated rabbit hearts where a thin layer of epicardium survives, Cai elevation always preceded the EAD depolarization.23 The cryoablation studies support the interpretation that when EAD depolarizations precede Cai elevation, the site of earliest EAD upstrokes correspond to epicardial breakthrough of a transmural depolarization wavefront, The higher spatial dispersion of CaTD compared to APD dispersion just before the onset of EADs also supports the notion that CaTs are not under the control of APs.
Mechanisms linking CaT oscillations to EADs
The most likely mechanism linking secondary CaT upstrokes to membrane depolarization is the NCX current, INCX, consistent with reports that NCX blockers suppress EADs and TdP.27 We speculate that CaT oscillations are driven by spontaneous Ca2+ release from an overloaded SR. In LQT2, the long AP plateau increases Ca2+ influx via ICa,L because the voltage-dependent component of inactivation is incomplete and long APDs also reduce the driving force for Ca2+ efflux via NCX. These changes indirectly increase SR Ca2+ uptake due to the increase of sarcolemmal Ca2+ entry and the suppression of Ca2+ efflux mechanisms. Consistent with this view, nifedipine, low external Ca2+ and ryanodine/thapsigargin eliminated CaT oscillations, EADs and TdP. Thus, our data indicate that spontaneous Ca2+ release from an overloaded SR network is the primary cause of ventricular arrhythmias in LQT2.
In dofetilide-induced LQT2, CaiO always appeared before EADs and TdP. Although all CaiO are expected to elicit INCX oscillations, not all CaiO produced EADs because the ability of INCX (due to a CaiO) to sufficiently depolarize the cell membrane and produce an EAD depends on several factors: i) the magnitude of the Cai elevation which determines the magnitude of INCX, ii) Vm during the plateau phase, a determinant of the magnitude of repolarizing K+ currents: IK1, residual IKr and IKs, iii) the time-point along phase 2 of the AP when INCX rises, a determinant of the number of L-type Ca2+ channels that have recovered from inactivation and can be reactivated and iv) the activation of the opposing repolarizing K+ currents (IKr and IKs) are also time-dependent. The data provide compelling evidence that INCX is the most reasonable mechanism for the generation of EADs through L-type Ca2+ channels re-activation but it cannot entirely exclude a contribution from spontaneous ICa,L re-activation.
Non-alternans TWL is caused by the lability of ventricular APs, which is preceded by CaiO and CaT lability. CaiO are not fully synchronized (Fig. 4) and could contribute to AP lability through reverse Cai-Vm coupling. In contrast to TWL, alternans of CaT, AP or TWA was never observed before the onset of ectopy.
Spontaneous SR Ca2+ release and arrhythmias
Abnormal Ca2+ handling has been implicated in arrhythmogenesis in numerous pathologies,28 including digoxin toxicity29 and catecholaminergic polymorphic ventricular tachycardia.30,31 VT is triggered by DADs in both of these conditions. DADs are caused by spontaneous SR Ca2+ release during diastole and membrane depolarization by INCX.32 However, the role of spontaneous systolic Ca2+ release from SR in the generation of EADs continues to be debated.33 CaiO in the form of sparks and waves have been reported in a wide range of cardiac preparations, ranging from isolated myocytes to intact perfused hearts, and have been implicated as an arrhythmogenic mechanism.34 In a guinea-pig model of ischemia/reperfusion, spontaneous CaiO appeared to drive ventricular ectopy.35 Reperfusion arrhythmias thus represent another clinically relevant situation involving spontaneous Ca2+ release from overloaded SR. The link between delayed repolarization, SR overload, CaT oscillations and TdP may help the development diagnostic and treatment strategies in patients with long QT syndrome.
Conclusions
In LQT2, APD prolongation promotes CaT oscillations, which precede the appearance of EADs. The data provide a mechanistic explanation for TWL and enhance our understanding of arrhythmogenesis in long QT syndrome. This may lead to improved clinical management of patients with impaired repolarization.
Limitations
Dofetilide was used at a relatively high dose to elicit drug-induced LQT2 becuase lower doses were less reliable at eliciting TdP. Our LQT2 model exhibits an extreme degree of impaired repolarization compared to most clinical situations such that its clinical relevance must be validated. However, it has the advantage of reproducible TdP induction during an acute study.
Acknowledgments
Supported in part by a grant from Boston Scientific, Inc. To JN and NIH NHLBI HL-69097 to GS and a Three Rivers Affiliate of the AHA Pre-Doctoral Fellowship to JK.
Footnotes
Disclosures: The authors have no conflicts to disclose
Publisher's Disclaimer: This is a PDF file of an unedited manuscript that has been accepted for publication. As a service to our customers we are providing this early version of the manuscript. The manuscript will undergo copyediting, typesetting, and review of the resulting proof before it is published in its final citable form. Please note that during the production process errors may be discovered which could affect the content, and all legal disclaimers that apply to the journal pertain.
References
- 1.Malik M, Batchvarov VN. Measurement, interpretation and clinical potential of QT dispersion. The Journal of the American College of Cardiology. 2000;36:1749–1766. doi: 10.1016/s0735-1097(00)00962-1. [DOI] [PubMed] [Google Scholar]
- 2.Hinterseer M, Beckmann BM, Thomsen MB, et al. Relation of increased short-term variability of QT interval to congenital long-QT syndrome. Am J Cardiol. 2009;103:1244–1248. doi: 10.1016/j.amjcard.2009.01.011. [DOI] [PubMed] [Google Scholar]
- 3.Morita H, Wu J, Zipes DP. The QT syndromes: long and short. Lancet. 2008;372:750–763. doi: 10.1016/S0140-6736(08)61307-0. [DOI] [PubMed] [Google Scholar]
- 4.January CT, Fozzard HA. Delayed afterdepolarizations in heart muscle: mechanisms and relevance. Pharmacological Reviews. 1988;40:219–227. [PubMed] [Google Scholar]
- 5.Volders PG, Vos MA, Szabo B, et al. Progress in the understanding of cardiac early afterdepolarizations and torsades de pointes: time to revise current concepts. Cardiovascular Research. 2000;46:376–392. doi: 10.1016/s0008-6363(00)00022-5. [DOI] [PubMed] [Google Scholar]
- 6.Luo CH, Rudy Y. A dynamic model of the cardiac ventricular action potential. II. Afterdepolarizations, triggered activity, and potentiation. Circulation Research. 1994;74:1097–1113. doi: 10.1161/01.res.74.6.1097. [DOI] [PubMed] [Google Scholar]
- 7.Shusterman V, Goldberg A, London B. Upsurge in T-wave alternans and nonalternating repolarization instability precedes spontaneous initiation of ventricular tachyarrhythmias in humans. Circulation. 2006;113:2880–2887. doi: 10.1161/CIRCULATIONAHA.105.607895. [DOI] [PubMed] [Google Scholar]
- 8.Salerno-Uriarte JA, De Ferrari GM, Klersy C, et al. Prognostic value of T-wave alternans in patients with heart failure due to nonischemic cardiomyopathy: results of the ALPHA Study. Journal of the American College of Cardiology. 2007;50:1896–1904. doi: 10.1016/j.jacc.2007.09.004. [DOI] [PubMed] [Google Scholar]
- 9.Berger RD, Kasper EK, Baughman KL, et al. Beat-to-beat QT interval variability: novel evidence for repolarization lability in ischemic and nonischemic dilated cardiomyopathy. Circulation. 1997;96:1557–1565. doi: 10.1161/01.cir.96.5.1557. [DOI] [PubMed] [Google Scholar]
- 10.Nemec J, Buncova M, Shusterman V, et al. QT interval variability and adaptation to heart rate changes in patients with long QT syndrome. Pacing and Clinical Electrophysiology. 2009;32:72–81. doi: 10.1111/j.1540-8159.2009.02179.x. [DOI] [PubMed] [Google Scholar]
- 11.Atiga WL, Calkins H, Lawrence JH, et al. Beat-to-beat repolarization lability identifies patients at risk for sudden cardiac death. Journal of Cardiovascular Electrophysiology. 1998;9:899–908. doi: 10.1111/j.1540-8167.1998.tb00130.x. [DOI] [PubMed] [Google Scholar]
- 12.Chudin E, Goldhaber J, Garfinkel A, et al. Intracellular Ca(2+) dynamics and the stability of ventricular tachycardia. Biophysics Journal. 1999;77:2930–2941. doi: 10.1016/S0006-3495(99)77126-2. [DOI] [PMC free article] [PubMed] [Google Scholar]
- 13.Diaz ME, O'Neill SC, Eisner DA. Sarcoplasmic reticulum calcium content fluctuation is the key to cardiac alternans. Circulation Research. 2004;94:650–656. doi: 10.1161/01.RES.0000119923.64774.72. [DOI] [PubMed] [Google Scholar]
- 14.Walker ML, Wan X, Kirsch GE, et al. Hysteresis effect implicates calcium cycling as a mechanism of repolarization alternans. Circulation. 2003;108:2704–2709. doi: 10.1161/01.CIR.0000093276.10885.5B. [DOI] [PubMed] [Google Scholar]
- 15.Kaufman ES, Priori SG, Napolitano C, et al. Electrocardiographic prediction of abnormal genotype in congenital long QT syndrome: experience in 101 related family members. Journal of Cardiovascular Electrophysiology. 2001;12:455–461. doi: 10.1046/j.1540-8167.2001.00455.x. [DOI] [PubMed] [Google Scholar]
- 16.Nemec J, Ackerman MJ, Tester DJ, et al. Catecholamine-provoked microvoltage T wave alternans in genotyped long QT syndrome. Pacing and Clinical Electrophysiology. 2003;26:1660–1667. doi: 10.1046/j.1460-9592.2003.t01-1-00249.x. [DOI] [PubMed] [Google Scholar]
- 17.Couderc JP, Zareba W, Burattini L, et al. Beat-to-Beat repolarization variability in LQTS patients with the SCN5A sodium channel gene mutation. Pacing and Clinical Electrophysiology. 1999;22:1581–1592. doi: 10.1111/j.1540-8159.1999.tb00376.x. [DOI] [PubMed] [Google Scholar]
- 18.Nemec J, Hejlik JB, Shen WK, et al. Catecholamine-induced T-wave lability in congenital long QT syndrome: a novel phenomenon associated with syncope and cardiac arrest. Mayo Clin Proc. 2003;78:40–50. doi: 10.4065/78.1.40. [DOI] [PubMed] [Google Scholar]
- 19.Hondeghem LM, Carlsson L, Duker G. Instability and triangulation of the action potential predict serious proarrhythmia, but action potential duration prolongation is antiarrhythmic. Circulation. 2001;103:2004–2013. doi: 10.1161/01.cir.103.15.2004. [DOI] [PubMed] [Google Scholar]
- 20.Thomsen MB, Volders PG, Beekman JD, et al. Beat-to-Beat variability of repolarization determines proarrhythmic outcome in dogs susceptible to drug-induced torsades de pointes. Journal of the American College of Cardiology. 2006;48:1268–1276. doi: 10.1016/j.jacc.2006.05.048. [DOI] [PubMed] [Google Scholar]
- 21.January CT, Riddle JM. Early afterdepolarizations: mechanism of induction and block. A role for L-type Ca2+ current. Circulation Research. 1989;64:977–990. doi: 10.1161/01.res.64.5.977. [DOI] [PubMed] [Google Scholar]
- 22.Viswanathan PC, Rudy Y. Pause induced early afterdepolarizations in the long QT syndrome: a simulation study. Cardiovascular Research. 1999;42:530–542. doi: 10.1016/s0008-6363(99)00035-8. [DOI] [PubMed] [Google Scholar]
- 23.Choi BR, Burton F, Salama G. Cytosolic Ca2+ triggers early afterdepolarizations and Torsade de Pointes in rabbit hearts with type 2 long QT syndrome. Journal of Physiology (London) 2002;543:615–631. doi: 10.1113/jphysiol.2002.024570. [DOI] [PMC free article] [PubMed] [Google Scholar]
- 24.Xie LH, Chen F, Karagueuzian HS, et al. Oxidative stress-induced afterdepolarizations and calmodulin kinase II signaling. Circ Res. 2009;104:79–86. doi: 10.1161/CIRCRESAHA.108.183475. [DOI] [PMC free article] [PubMed] [Google Scholar]
- 25.Zabel M, Hohnloser SH, Behrens S, et al. Electrophysiologic features of torsades de pointes: insights from a new isolated rabbit heart model. Journal of Cardiovascular Electrophysiology. 1997;8:1148–1158. doi: 10.1111/j.1540-8167.1997.tb01001.x. [DOI] [PubMed] [Google Scholar]
- 26.Choi BR, Salama G. Simultaneous maps of optical action potentials and calcium transients in guinea-pig hearts: mechanisms underlying concordant alternans. Journal of Physiology (London) 2000;529:171–188. doi: 10.1111/j.1469-7793.2000.00171.x. [DOI] [PMC free article] [PubMed] [Google Scholar]
- 27.Milberg P, Pott C, Fink M, et al. Inhibition of the Na+/Ca2+ exchanger suppresses torsades de pointes in an intact heart model of long QT syndrome-2 and long QT syndrome-3. Heart Rhythm. 2008;5:1444–1452. doi: 10.1016/j.hrthm.2008.06.017. [DOI] [PubMed] [Google Scholar]
- 28.Salama G. Arrhythmia genesis: aberrations of voltage or Ca2+ cycling? Heart Rhythm. 2006;3:67–70. doi: 10.1016/j.hrthm.2005.10.025. [DOI] [PubMed] [Google Scholar]
- 29.Rosen MR. Cellular electrophysiology of digitalis toxicity. Journal of the American College of Cardiology. 1985;5:22A–34A. doi: 10.1016/s0735-1097(85)80460-5. [DOI] [PubMed] [Google Scholar]
- 30.Liu N, Colombi B, Memmi M, et al. Arrhythmogenesis in catecholaminergic polymorphic ventricular tachycardia: insights from a RyR2 R4496C knock-in mouse model. Circulation Research. 2006;99:292–298. doi: 10.1161/01.RES.0000235869.50747.e1. [DOI] [PubMed] [Google Scholar]
- 31.Terentyev D, Nori A, Santoro M, et al. Abnormal interactions of calsequestrin with the ryanodine receptor calcium release channel complex linked to exercise-induced sudden cardiac death. Circulation Research. 2006;98:1151–1158. doi: 10.1161/01.RES.0000220647.93982.08. [DOI] [PubMed] [Google Scholar]
- 32.Fujiwara K, Tanaka H, Mani H, et al. Burst emergence of intracellular Ca2+ waves evokes arrhythmogenic oscillatory depolarization via the Na+-Ca2+ exchanger: simultaneous confocal recording of membrane potential and intracellular Ca2+ in the heart. Circulation Research. 2008;103:509–518. doi: 10.1161/CIRCRESAHA.108.176677. [DOI] [PubMed] [Google Scholar]
- 33.Sato D, Xie LH, Sovari AA, et al. Synchronization of chaotic early afterdepolarizations in the genesis of cardiac arrhythmias. Proceedings of the National Academy of Sciences U S A. 2009;106:2983–2988. doi: 10.1073/pnas.0809148106. [DOI] [PMC free article] [PubMed] [Google Scholar]
- 34.Terentyev D, Viatchenko-Karpinski S, Gyorke I, et al. Calsequestrin determines the functional size and stability of cardiac intracellular calcium stores: Mechanism for hereditary arrhythmia. Proceedings of the National Academy of Sciences USA. 2003;100:11759–11764. doi: 10.1073/pnas.1932318100. [DOI] [PMC free article] [PubMed] [Google Scholar]
- 35.Lakireddy V, Bub G, Baweja P, et al. The kinetics of spontaneous calcium oscillations and arrhythmogenesis in the in vivo heart during ischemia/reperfusion. Heart Rhythm. 2006;3:58–66. doi: 10.1016/j.hrthm.2005.09.018. [DOI] [PubMed] [Google Scholar]