

Abstract
Merkel cell polyomavirus (MCPyV) is a common infectious agent that is likely involved in the etiology of most Merkel cell carcinomas (MCCs). Serum antibodies recognizing the MCPyV capsid protein, VP1, are detectable at high titer in nearly all MCC patients, and remain stable over time. Although antibodies to the viral capsid indicate prior MCPyV infection, they provide limited clinical insight into MCC because they are also detected in more than half of the general population. We investigated whether antibodies recognizing MCPyV large and small tumor-associated antigens (T-Ags) would be more specifically associated with MCC. Among 530 population control subjects, these antibodies were present in only 0.9% and were of low titer. In contrast, among 205 MCC cases, 40.5% had serum IgG antibodies that recognize a portion of T-Ag shared between small and large T-Ags. Among cases, titers of T-Ag antibodies fell rapidly (approximately 8 fold/year) in patients whose cancer did not recur, while they rose rapidly in those with progressive disease. Importantly, in several patients who developed metastases, the rise in T-Ag titer preceded clinical detection of disease spread. These results suggest that antibodies recognizing T-Ag are relatively specifically associated with MCC, do not effectively protect against disease progression, and may serve as a clinically useful indicator of disease status.
Key words (5): Merkel cell carcinoma, Merkel cell polyomavirus, MCPyV, antibody, biomarker
Introduction
Merkel cell carcinoma (MCC) is an aggressive skin cancer with 35–50% disease-associated mortality (1). A recently discovered human polyomavirus (Merkel cell polyomavirus, MCPyV or MCV) has been strongly linked to MCC and appears to participate in the causation of most MCC tumors. Indeed, MCPyV DNA is detectable in approximately 80% of MCC tumor lesions and has been demonstrated to be integrated into MCC tumor DNA (2–5).
Similar to other polyomaviruses, MCPyV encodes two major families of genes (6). The early genes (Tumor-Associated or T antigens, T-Ags) promote cell cycle entry and replication of viral DNA and are expressed from a single transcript. The largest of the T antigen species, aptly named Large T antigen (LT-Ag) is an oncoprotein that is persistently expressed in a truncated form in the majority of MCC tumors and likely promotes cell division in MCC cell lines by inhibition of the tumor suppressor pRb (7–10). Small T antigen (ST-Ag) shares the first 78 amino acids with LT-Ag, is thought to inhibit the tumor suppressor PP2A through its unique c-terminal domain, and is also expressed in MCCs(10). In contrast to the T antigens, the late genes (viral proteins, or VPs) encode proteins that form the viral capsid, of which VP1 is the major constituent. Although the capsid is required for initial infection, VP1 expression cannot be detected in MCC tumors (11) and is thus thought to not play a role in tumor persistence.
Work from several groups, including our own, has demonstrated that nearly all MCC patients have antibodies to the MCPyV capsid (11–13). This suggests that a history of infection with MCPyV is associated with MCC tumor development. However, infection with MCPyV is common, and 42–77% of subjects from the general population have antibodies to capsid proteins (12–15). Thus, there is limited potential for such antibodies to be used clinically as a marker for MCC.
We hypothesized that serum antibodies to MCPyV T-antigens would be more specifically associated with MCC than those of the viral capsid. In contrast to capsid proteins that are highly visible to the humoral immune system, T-antigen oncoproteins are not present in viral particles, are only expressed after viral entry into host cells, are located in the nucleus (16), and are thus less likely to trigger an antibody response except in the setting of dying or diseased tissue (such as a tumor that persistently expresses the T-antigens). In this study, we employed multiplex serology and a case-control design to characterize differences in frequency, titer, and specificity of anti-MCPyV antibodies between MCC cases and population-based controls.
Materials and Methods
Human subjects
All studies were approved by the Institutional Review Board of the Fred Hutchinson Cancer Research Center and of the University Hospital of Wuerzburg and were performed in accordance with Helsinki Principles.
Serum samples from MCC cases used in the matched case-control analyses were from the Merkel Cell Carcinoma Repository of Patient Data and Specimens, Fred Hutchison Cancer Research Center, and were collected between January 1, 2008, and May 1, 2010. Case patients (n=139) in this matched portion of the study were from the United States and ranged in age from 31 to 91 years at diagnosis and included 79 men and 60 women. Control subjects (n=530) were recruited from Western Washington by random-digit dialing as previously described (17, 18) and frequency matched to case patients with MCC by age (within 5-years) and gender with a final ratio of 4 controls to 1 case.
A second set of sera from MCC cases (not matched to controls) was obtained from 66 MCC patients and was available for some but not all studies. These sera included 20 cases from the United States (sera collected 2009–2010) and 46 MCC patients from Germany (sera collected 2001–2010). The age (range: 37–96 years) and gender distributions (25 females and 41 males) of this population were similar to that of the MCC cases used in the matched analyses.
Plasmids, Cloning, Site-Directed Mutagenesis, and Preparation of Fusion Proteins
Fusion proteins, in which glutathione S-transferase (GST) was added to the N-terminus and an 11 amino acid epitope tag added to the C-terminus (19), were used for all antibody binding assays. See Supplemental data for details of generation of the fusion proteins.
Multiplex Antibody Binding Assay
These methods are a modification of the protocol described by Waterboer et al (20) (21) and have been described in detail previously (13). In brief, polystyrene beads were covalently coupled to casein that had previously been linked with glutathione. Each fluorescently labeled bead set was loaded with a different fusion protein and, after washing to remove unbound fusion protein, pooled for an initial experiment using serum diluted at 1:100 to determine which samples were sero-reactive for VP1, large T and small T antigens from each of BK polyomavirus and MCPyV. See Supplemental Data for details.
For titration experiments, human sera were diluted 1:50 in blocking buffer, in 96-well polypropylene plates (Fisher Scientific, Pittsburgh, PA) and shaken for 20 min at room temperature. A 1:10 dilution of each sample was made in blocking buffer and the plate shaken as before. A second 1:10 dilution was made and the plate shaken. The dilute sera (50μl) were transferred to the wells of a 96 well filter plate that had a mixture of antigen coated beads (50μl). Each plate had six wells used for the titration of a control (pooled positive sera). Serial dilutions of the control pool were made starting at 1:2 (concentration range: 1:100–1:3200) on the first plate and ending at 1:6 (concentration range: 1:100–1:777,600) on the final plate. The subtracted MFI values for each antigen were used to generate titration curves on GraphPad Prism (GraphPad Software Inc, La Jolla, CA) using the Sigmoidal dose response (with variable slope) program. A cutoff of MFI=1000 was used as the threshold between positive and negative because 1000 approximated the border between signal and noise. These curves (separate for ST-Ag and LT-Ag, see Figure 4A) were used to obtain titers (apparent titers) for MFIs of all experimental samples. The actual titers were then corrected for serum dilutions. Thus, the titer for each sample was estimated to be the dilution at which the sample would have an MFI of 1000. Samples that were too low to be computed were given an arbitrary titer of 1. Several sera had titers too high to be calculated even at the 1:10,000 dilution and were assigned titers of 2,500,000 for ST-Ag and 1,200,000 for LT-Ag.
Figure 4. Quantitative titration of antibodies recognizing MCPyV T-Ag.
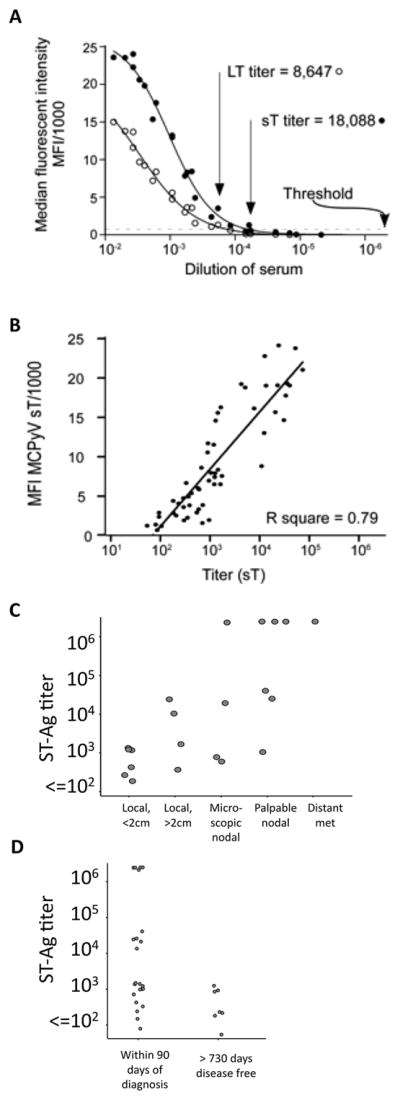
A) Determination of titer by serial dilutions. A pool of sample sera selected from among T-antigen seropositives is shown. The threshold of positive vs negative was set at an MFI of 1000 (dotted line). B) ST-Ag titers, determined from 1–3 additional dilutions, as compared to the specimen’s initial screening ST-Ag MFI. All 58 sera with a titer in quantitative range are shown. C) ST-Ag titer within 90 days of diagnosis as compared to extent of MCC at presentation. D) ST-Ag titers comparing MCC patients within 90 days of diagnosis to those who were more than two years after diagnosis, with no recurrence.
Merkel cell polyomavirus PCR detection in tumor tissue
DNA from Merkel cell carcinoma was extracted and polyomavirus DNA was detected in tumor tissue by qPCR using methods as previously described for US (22) and European (4) cases.
Merkel cell polyomavirus immunohistochemistry
Staining for MCPyV large T-Ag was performed with the CM2B4 antibody [Santa Cruz] (7) at 1:100 dilution in pH 9 EDTA buffer with 15% swine serum in serum free protein block, overnight incubation at 4 degrees. Antigen retrieval was performed at pH 9 for 30 minutes in a preheated 95 degree water bath, then slides were slowly cooled for 30 minutes on the bench. All tumors were represented in triplicate on a single tissue microarray (TMA). Scoring was performed using the Allred method (23) by an observer blinded to serostatus and the median score was employed. Some off-target nuclear staining was observed in tonsil tissue, however no peri- or intra-tumoral vessels, stroma, or lymphocytes were immunoreactive with the CM2B4 antibody. If more than one tissue from a particular tumor was represented on the TMA, a single specimen was chosen using the following ranking: primary > nodal metastasis > recurrence > other metastasis. Peri- and intra-tumoral vessels, stroma, and lymphocytes all were CM2B4 negative. Scores ranged from 0–8 and cutpoints employed were as follows: negative: Allred 0–1.5, weak positive: Allred 2–4.5, strong positive: Allred 5–8.
Statistical analyses
Gender-specific cutpoints (3 standard deviations above the mean of population control sera) were used to determine seropositivity. Cutpoints used for men: MCST-Ag: 1058, MCLT-Ag: 3280, BKST-Ag: 3683, BKLT-Ag: 6134 and for women: MCST-Ag: 818, MCLT-Ag: 2110, BKST-Ag: 3021, BKLT-Ag: 4216. For VP1, the previously published cutpoint of 5000 was used (13). Odds ratios were sex and age adjusted. Proportion seropositive was compared between groups (eg. cases and controls, virus positive vs. virus negative cases) with Fisher’s exact test. Linear regression was employed to compare association between reactivity with small T-Ag to reactivity with large T-Ag and to compare association between BKV and MCPyV. Statistical analyses were performed with STATA software (StataCorp, College Station, Texas).
Results
MCC patients are more likely than controls to have antibody responses to MCPyV T-Ags
Sera from 139 MCC cases (“initial MCC cases”) and 530 population controls (age and sex matched 4:1 to these cases) were screened for antibody reactivities to the Merkel cell polyomavirus (MCPyV) and BK polyomavirus (BKV) VP1, LT-Ag, and ST-Ag proteins in a single batch (Supplemental Figure 1). Similar to prior reports, MCC case subjects were significantly more likely than control subjects to have antibody reactivity to the MCPyV capsid (OR 5.5, 95% CI: 2.9–11.2) but not the BKV capsid (OR 1.4, 95% CI: 0.9–2.3)(Figure 1) (12, 13). However, the association with MCPyV T-Ag was even stronger. A total of 205 MCC cases were studied for TAg reactivity: 139 “initial cases” (Table 1) and an additional 66 cases from Europe and the USA with a similar age and gender distribution. MCC case subjects were more likely to have IgG antibody reactivity to the MCPyV large T (OR 16.9, 95% CI: 7.8–36.7) and small T-Ag oncoproteins (OR 63.2, 24.4–164.0) (Table 1). Furthermore, and in contrast to VP1, antibodies to the T-antigen were rarely detected among controls but commonly detected among cases. Indeed, twenty-six percent of MCC patients were seroreactive to large T-Ag as compared to only 2% of population subjects (p < 0.001, Figure 1). Examining seropositivity to small T-Ag, the association grew even stronger, with 40.5% of MCC cases seroreactive as compared to only 0.9% of control subjects (p<0.001, Figure 1).
Figure 1.

Prevalence of antibodies to Merkel cell and BK polyomavirus VP1 (capsid), large T antigen, and small T antigen proteins among MCC patients and age- and sex- matched controls. Population controls were random-digit dialed persons who were age and sex matched to 139 MCC cases in the United States. MCPyV large and small T-Ag data (n=205) includes these 139 “initial” cases on which the matching was performed (T-Ag data for the set of 139 available in Table 1) and an additional 66 MCC cases of similar age and sex distributions. First row: reactivity to MCPyV VP1 (left), LT-Ag (center) and ST-Ag (right) is shown. Each spot represents one serum sample. MFI = median fluorescent intensity. Second row: the proportion of control and case subjects seroreactive for each MCPyV antigen. Third and fourth rows represent analogous studies carried out using BK polyomavirus antigens. NS = non-significant.
Table 1.
Risk of Merkel Cell Carcinoma associated with serostatus to MCPyV Small and Large T-antigens
| Antigen | Sero- status | Controls (n=530) | Cases (n = 139) | Odds Ratio | |||
|---|---|---|---|---|---|---|---|
| N | % | N | % | OR | 95% CI | ||
| MCPyV Small T | − | 525 | (99.1) | 88 | (63.3) | 1.0 | (ref) |
| + | 5 | (0.9) | 51 | (36.7) | 63.2 | (24.4–164.0)* | |
| MCPyV Large T | − | 521 | (98.3) | 108 | (77.7) | 1.0 | (ref) |
| + | 9 | (1.7) | 31 | (22.3) | 16.9 | (7.8–36.7)* | |
| BKV Small T | − | 524 | (98.9) | 138 | (99.3) | 1.0 | (ref) |
| + | 6 | (1.1) | 1 | (0.7) | 0.6 | (0.1–5.3) | |
| BKV Large T | − | 519 | (97.9) | 136 | (97.8) | 1.0 | (ref) |
| + | 11 | (2.1) | 3 | (2.2) | 1.0 | (0.3–3.8) | |
139 “initial” USA MCC cases are included along with 530 USA population controls matched to these cases in a 4:1 manner by 5-year age and gender. Odds ratios have been adjusted for age at blood draw and gender. Cutpoints used to determine positivity (based on 3 standard deviations above the mean of controls): Men: MCST-Ag 1058, MCLT-Ag 3280, BKST-Ag 3683, BKLT-Ag 6134. Women: MCST-Ag: 818, MCLT-Ag 2110, BKST-Ag 3021, BKLT-Ag 4216.
In order to determine assay reproducibility, a randomly selected sub-set of 116 sera (including cases and controls and positive and negative sera) were re-tested on a separate date in a blinded fashion. Seroreactivities were well correlated (R2=0.73 for ST-Ag) (Supplemental Figure 2). On a second additional date, 149 samples with an LT-Ag and/or ST-Ag MFI > 500 were retested. Correlation between this re-test and the initial screen was also excellent (ST-Ag R2 = 0.83, data not shown).
No relationship was observed between seroreactivity to BK T-Ag (Figure 1) and MCC. Furthermore, seroreactivity to BK T-Ag was not associated with seroreactivity to MCPyV T-Ag, indicating there was little cross-reactivity between assays (data not shown).
As shown in Figure 1, reactive MCC cases appeared to have much stronger seroreactivity to the MCPyV T-Ags than the few reactive controls at the screening dilution. Multiple dilutions were further tested to confirm this higher antibody titer for case or control subjects with an MFI on screen of 500 or greater. The geometric mean titer (2900) for antibodies recognizing LT-Ag among reactive “initial” MCC cases (n=56, 95% CI: 1500–5800) was more than 10-fold greater than the geometric mean titer of 200 among the reactive matched population controls (n=36, 95% CI: 100–300). Differences in ST-Ag reactivity were even more pronounced. Indeed, geometric mean titer for ST-Ag was several orders of magnitude greater in MCC cases (2100, 95% CI: 800–5500, n=57) than matched controls (5, 95% CI: 1–30, n=10).
Localization of reactive T antigen epitopes
The MCPyV LT-Ag and ST-Ag proteins result from splice variants of a single transcript. The two oncoproteins share a common N-terminal domain (78 amino acids), followed by regions unique to each protein (24) (Figure 2A). We observed similar seroreactivity to full-length LT-Ag and ST-Ag in the “initial” MCC cases (n = 139, R2 = 0.85; Figure 2B), but not matched population controls (n = 530, R2 = 0.01; Figure 2C). (LT-Ag and ST-Ag reactivities were also strongly correlated in the additional 66 case sera, but these sera were not available at the time of detailed epitope localization analyses.) Thus, we hypothesized MCC cases recognized a T-Ag epitope contained within the shared domain.
Figure 2.

Localization of T antigen regions containing immunoreactive antibody epitopes. A) LT-Ag and ST-Ag proteins share a common domain, amino acids 1–78 (red), followed by portions unique to each protein. Amino acids indicated in the figure reflect end-points of various truncations tested. B) and C) Correlation between LT-Ag and ST-Ag seroreactivity among the 139 “initial” MCC cases and 530 matched population controls. Note: approximately 500 controls overlap in the region of no reactivity to either antigen. D) Using the indicated T-Ag truncations, three major patterns of reactivity were observed. Pattern “I” is consistent with no reactivity. Pattern “II” is consistent with recognition of an epitope within the first 78 amino acids shared between LT-Ag and ST-Ag. Pattern “III” is consistent with recognition of an LT-Ag epitope located between amino acids 78–176, in a region of LT-Ag that is not shared with ST-Ag.
Several truncations of large and small T-Ag were employed in order to map reactive antibody epitopes in MCPyV T-Ags (Figure 2D). The most common pattern for both cases and controls, (“I”), showed no reactivity to any T-Ag epitope. Among sero-reactive subjects, two general patterns, “II” and “III”, were observed. Pattern “II” was consistent with recognition of the common/shared domain and observed among 36.7% of patients and 0.9% of controls. In general, reactivity to full-length LT-Ag was reduced in this assay, likely due to lower amounts of LT-Ag on the beads as compared to the shorter T-Ag products (data not shown). Sera with pattern “III” responses recognized epitopes unique to LT-Ag (between LT-Ag amino acids 78 and 176 or between 176 and 302) and was seen among 1.7% of controls and in a single MCC case (0.7%). Interestingly, the MCC patient with this LT-only recognition pattern had no detectable MCPyV DNA in their tumor lesion, suggesting this pattern may be non-specific and may represent cross-reactivity to another protein. In accordance with these results, the remaining experiments were performed using full-length ST-Ag as the target T-Ag.
MCC cases with MCPyV-positive tumor lesions more likely to be seropositive
Cytokeratin-20 (CK20) is a canonical marker for Merkel cell carcinoma and has been reported to be associated with virus status, with CK20 negative tumors unlikely to have detectable virus (7). CK20 data was available for 123 MCC cases from the “initial” case group. None of the 6 (0%) CK20 negative cases had antibodies to ST-Ag, while 45 of 117 (38%) of the CK20+ cases were seropositive. However, this trend did not reach statistical significance (p = 0.08, Figure 3A).
Figure 3.

Relationship between MCPyV detection in tumor lesion and patient serostatus. A) Seroreactivity based on expression of CK20, a canonical marker of MCC that is positively associated with virus presence. B, C) Strongly virus DNA positive tumors have a higher rate of seropositivity to MCPyV VP1 (not significant) and T-Ag than cases in which MCPyV DNA cannot be detected in the tumor lesion. Cases were sorted into three bins based on amount of MCPyV DNA detected in the tumor relative to a control gene (Methods). D, E) MCPyV Large T-Ag protein expression (CM2B4 antibody) in the patient’s MCC tumor was significantly associated with seropositivity for both VP1 and T-Ag.
Next, we investigated whether patients with detectable MCPyV DNA in their tumors were more likely to have antibodies recognizing MCPyV antigens. For 37 MCC cases in the “initial” case group, MCPyV DNA copy number was characterized by qPCR (22) as absent, low/borderline (more than 5 cycle difference between MCPyV and control gene; corresponding to 1 copy per 16 cells or fewer), or moderately/strongly positive based on MCPyV DNA copy number (n=37). Consistent with the findings in the general population, a significant fraction of virus-negative cases (n=8) had antibodies recognizing the VP1 capsid (Figure 3B). However, serology for the MCPyV T-Ag much more closely reflected the virus status of the tumor. Indeed, none of the 8 cases with DNA negative (0%), 3 of 12 (25%) of cases with DNA low, and 10 of 17 (59%) cases with DNA strong positive tumors were ST-Ag seropositive (p = 0.01 comparing strong positives to absent, Fisher’s exact test) (Figure 3C). Similar results were observed among 33 European MCC cases (qPCR done by different method (4)). Among 5 cases with no detectable MCPyV DNA, there were no ST-Ag reactive sera (0%). In contrast, 19 of 28 cases (68%) with MCPyV DNA positive tumors were seroreactive to ST-Ag (p < 0.01, Fisher’s exact test)(data not shown).
Similar analyses were performed based on MCPyV T-Ag protein expression (n=29 cases with available FFPE tumor for study) (see Methods for details). Using immunohistochemistry of tumor lesions (antibody directed at large T-Ag), 0 of 7 (0%) MCPyV large T-Ag protein non-expressers, 2 of 8 (25%) weak expressers, and 9 of 14 (64%) strong expressers were ST-Ag seropositive (p = 0.01 comparing strong positives to absent, Fisher’s exact test)(Figure 3E).
Anti-T antigen IgG antibody levels reflect MCC tumor burden
In order to better quantitate the degree of seropositivity among reactive cases and controls, we re-tested reactive specimens at multiple dilutions in order to determine antibody titer (the dilution at which a sera goes from reactive to non-reactive, Figure 4A). Titers closely correlated with screening MFI values at the 1:100 dilution (R2 = 0.79, Figure 4B).
Interestingly, seroreactive patients presenting with advanced disease (regional or metastatic, n=12) had significantly higher anti-T-antigen antibody titers at the time of presentation (within 90 days) (geometric mean titer 53,000, 95% CI: 5,100–553,000) than those presenting with local only disease (n=10, geometric mean 1000, 95% CI: 300–3,800). When these cases are further broken down by extent of disease, a trend towards increased titer at presentation with increased burden of disease was apparent (Figure 4C).
Furthermore, the titer of T-Ag antibodies among patients at or near the time of presentation (within 90 days) (n=23, geometric mean 8150, 95%CI: 1810–36700) was an order of magnitude greater than that of patients who were more than two years since being rendered disease free with no recurrences (n=7, geometric mean 330, 95%CI: 120–920; Figure 4D). In contrast, titers to VP1 were similar among recently diagnosed and long-term tumor free cases, and a similar fraction were VP1 seroreactive (87% vs. 100% respectively). These observations led us to wonder whether IgG antibodies to the T-Ag oncoproteins were related to MCC tumor burden and whether they change with changing tumor burden.
There were 20 MCC cases that were informative on this issue because they met the following criteria: a) blood draws were available from two or more dates; b) the T-Ag titer was ≥ 100 for at least one of the blood draws. All 43 blood draws available from these 20 cases are depicted in Figure 5.
Figure 5.

Titers of IgG to MCPyV T-Ag, but not VP1, dynamically reflect MCC disease burden. All cases are shown that had available disease status information and an ST-Ag Titer (performed if ST-Ag MFI > 500). There were 20 cases with a T-Ag titer > 100 for at least one draw and for whom multiple draws were available. Each line represents one case. Note the logarithmic scale. A) Patients without MCC recurrence (these 10 cases represented in both the VP1 and T-Ag graphs). These patients did not progress in the time between draws or subsequently develop MCC recurrence after the second blood draw (available follow-up range: 0–6 months). B) Patients with progression. Importantly, for three cases (wu1432, wu4001, w338, indicated by double asterisks), a rise in titer preceded the clinical detection of metastasis by 1–6 months. Disease status at time of draw is indicated on the graph: NED = no evidence of disease. MET = metastasis/disease progression.
Among 10 patients whose disease did not progress in the follow-up period (all were rendered disease-free prior to the second draw) VP1 titer remained stable and did not significantly differ between draws (Figure 5A, left panel). In contrast, we observed a rapid drop in T-Ag titer in 8 of these 10 patients while the titer in the remaining 2 patients remained low (Figure 5A, right panel). Indeed, among these 10 patients whose disease did not progress, the geometric mean T-antigen titer was 1290 at the initial draw (95% CI: 300–5520), and diminished by 8-fold to 160 (95% CI: 110–240) by the time of the follow-up draw (98–469 days later, median of 308 days). The median rate of change in T-Ag titer was negative 10% per month (range: −24% to +3%) as compared to 1.5% for VP1 (range: −5% to +32%).
Importantly, anti-T-Ag titer not only reflected decreases in disease burden, but also increased in cases with recurrent disease (Figure 5B). In all six draws from patients whose disease was known to have progressed, there were increased titers at the time of progression. Furthermore, in 3 of 6 cases with a blood draw that occurred several months prior to clinical recognition of MCC relapse (denoted in the figure by **), a rise in T-Ag titer preceded the development of clinically appreciable MCC recurrence by 1–6 months.
Discussion
Merkel cell polyomavirus is a recently described polyomavirus (2) and MCPyV T-antigen oncoproteins are persistently expressed in MCC tumors (7–9). These oncoproteins are capable of eliciting a humoral immune response, they are more prevalent and of higher titer in MCC cases than controls. Furthermore, there is a strong association between T-Ag antibodies and virus detection in the MCC tumor. Finally, antibodies to MCPyV T-Ag oncoprotein (but not MCPyV capsid) vary greatly over time in MCC patients and reflect the burden of disease.
The strong association between antibodies to MCPyV T-Ags and Merkel cell carcinoma is similar to prior VP1 studies in this cancer in their support of a link between MCPyV and MCC and the concept that Merkel cell carcinoma patients have long-term, high-level and/or recent exposure to Merkel cell polyomavirus antigens (11–13). Furthermore, and unlike anti-VP1 antibodies, T-Ag antibodies were only rarely detected among controls. This means that T-Ag antibodies are more specifically associated with Merkel cell carcinoma than antibodies to the capsid protein.
Interestingly, and in contrast to controls, MCC cases almost exclusively recognize a T-Ag epitope located in the common domain shared between MCPyV LT-Ag and ST-Ag, whereas the rare seropositive population controls usually recognized epitopes unique to LT-Ag. We hypothesize that large T reactive controls may represent cross-reactions to a different protein.
MCC patients with detectable MCPyV in their tumor by PCR or IHC were more likely to have anti-VP1 and anti-T-Ag antibodies than those without detectable MCPyV. Interestingly, no case with a MCPyV negative tumor seroreacted to MCPyV T-Ag. This suggests there might be a population of MCC that develop without MCPyV involvement.
Importantly, we observed rapid changes in T-Ag titer that vacillated with disease burden. Indeed, titer often varied more than 10 fold in a one-year period. Importantly, titers were highest when patients were sickest, suggesting that antibodies to T-Ag are not protective against disease progression. Similar to our observations, in some other cancers, antibodies recognizing human cancer antigens (such as p53) or papillomavirus proteins have been reported to be volatile and change with cancer burden (25, 26).
The rapid turnover of IgG antibodies recognizing T-Ag in MCC patient sera suggests instability within the B cell population. Chemotherapy was not the cause of observed IgG decreases as no patients in Fig 5 had ever received chemotherapy. Instead, variation in titer is likely due to changes in antigen burden reducing or increasing stimulation of effector B lymphocytes. It is also possible that the memory B cell response is not generated properly, perhaps due to ineffective priming within the tumor microenvironment.
It is possible that tracking the antibody titer to the viral T-Ag holds promise as an MCC disease marker. Computed tomography imaging is expensive and has rather poor sensitivity and specificity for MCC (27). In three cases, a rise in serologic ST-Ag titer preceded clinical detection of MCC metastasis by 1–6 months. For patients with a positive baseline MCPyV T-Ag titer, it may make be appropriate to follow T-Ag titer at subsequent clinic visits in order to better inform clinicians of possible occult recurrence.
Our study has several limitations. The first is that serial blood draws were only available for 20 seropositive cases. The second is that it is currently impossible to know which if any “NED” patients may have slowly growing, clinically occult MCC. A third limitation is that given the very small number of control subjects with antibodies to small T-Ag (5 of 530), our estimate of the hazard ratio associated with seropositivity to small T-Ag is imprecise.
Despite these limitations, this study represents a significant advance in our understanding of the humoral immune response to Merkel cell polyomavirus and Merkel cell carcinoma. In summary, there are striking differences between MCC cases and matched population controls in anti-MCPyV T-Ag antibody prevalence, titer, and specificity. Further study of anti-MCPyV T-Ag antibodies in an enlarged population of MCC patients is indicated to determine their potential for clinical utility in assessing disease status of this cancer.
Supplementary Material
Acknowledgments
Financial Support: American Cancer Society grant RSG-08-115-01-CCE, NIH-RC2CA147820 and NIH-K24-CA139052-1 to PN, and NIH-T32-CA80416-10 and F30ES017385 to KP, Deutsche Forschungsgemeinschaft-KFO124 to JCB/DS, 2P01CA042792 and R01AI38382 to DAG, David & Rosalind Bloom Fund and the MCC Patient Gift Fund at the University of Washington.
We thank Heather Sloan, Stephanie Pietromonaco, the Fred Hutchinson Specimen Processing Lab and Claudia Siedel for their assistance in obtaining serological specimens from MCC patients. We thank Mike Imperiale for supplying the BKV T-antigen plasmids and Yuan Chang and Patrick Moore for the gift of the CM2B4 antibody to large T antigen.
Footnotes
Conflicts of interest: None
References
- 1.Albores-Saavedra J, Batich K, Chable-Montero F, Sagy N, Schwartz AM, Henson DE. Merkel cell carcinoma demographics, morphology, and survival based on 3870 cases: a population based study. J Cutan Pathol. 2009 doi: 10.1111/j.1600-0560.2009.01370.x. [Epub ahead of print] [DOI] [PubMed] [Google Scholar]
- 2.Feng H, Shuda M, Chang Y, Moore PS. Clonal integration of a polyomavirus in human Merkel cell carcinoma. Science. 2008;319:1096–100. doi: 10.1126/science.1152586. [DOI] [PMC free article] [PubMed] [Google Scholar]
- 3.Kassem A, Schopflin A, Diaz C, et al. Frequent detection of Merkel cell polyomavirus in human Merkel cell carcinomas and identification of a unique deletion in the VP1 gene. Cancer Res. 2008;68:5009–13. doi: 10.1158/0008-5472.CAN-08-0949. [DOI] [PubMed] [Google Scholar]
- 4.Becker JC, Houben R, Ugurel S, Trefzer U, Pfohler C, Schrama D. MC polyomavirus is frequently present in Merkel cell carcinoma of European patients. J Invest Dermatol. 2009;129:248–50. doi: 10.1038/jid.2008.198. [DOI] [PubMed] [Google Scholar]
- 5.Bhatia K, Goedert JJ, Modali R, Preiss L, Ayers LW. Merkel cell carcinoma subgroups by Merkel cell polyomavirus DNA relative abundance and oncogene expression. Int J Cancer. 2010;126:2240–6. doi: 10.1002/ijc.24676. [DOI] [PMC free article] [PubMed] [Google Scholar]
- 6.Garneski KM, DeCaprio JA, Nghiem P. Does a new polyomavirus contribute to Merkel cell carcinoma? Genome Biol. 2008;9:228. doi: 10.1186/gb-2008-9-6-228. [DOI] [PMC free article] [PubMed] [Google Scholar]
- 7.Shuda M, Arora R, Kwun HJ, et al. Human Merkel cell polyomavirus infection I. MCV T antigen expression in Merkel cell carcinoma, lymphoid tissues and lymphoid tumors. Int J Cancer. 2009;125:1243–9. doi: 10.1002/ijc.24510. [DOI] [PMC free article] [PubMed] [Google Scholar]
- 8.Bhatia K, Goedert JJ, Modali R, Preiss L, Ayers LW. Immunological detection of viral large T antigen identifies a subset of Merkel cell carcinoma tumors with higher viral abundance and better clinical outcome. Int J Cancer. 2009 doi: 10.1002/ijc.25136. [Epub ahead of print] [DOI] [PMC free article] [PubMed] [Google Scholar]
- 9.Busam KJ, Jungbluth AA, Rekthman N, et al. Merkel cell polyomavirus expression in merkel cell carcinomas and its absence in combined tumors and pulmonary neuroendocrine carcinomas. Am J Surg Pathol. 2009;33:1378–85. doi: 10.1097/PAS.0b013e3181aa30a5. [DOI] [PMC free article] [PubMed] [Google Scholar]
- 10.Houben R, Shuda M, Weinkam R, et al. Merkel cell polyomavirus infected Merkel cell carcinoma cells require expression of viral T antigens. J Virol. 2010 doi: 10.1128/JVI.02400-09. [Epub ahead of print] [DOI] [PMC free article] [PubMed] [Google Scholar]
- 11.Pastrana DV, Tolstov YL, Becker JC, Moore PS, Chang Y, Buck CB. Quantitation of human seroresponsiveness to Merkel cell polyomavirus. PLoS Pathog. 2009;5:e1000578. doi: 10.1371/journal.ppat.1000578. [DOI] [PMC free article] [PubMed] [Google Scholar]
- 12.Tolstov YL, Pastrana DV, Feng H, et al. Human Merkel cell polyomavirus infection II. MCV is a common human infection that can be detected by conformational capsid epitope immunoassays. Int J Cancer. 2009;125:1250–6. doi: 10.1002/ijc.24509. [DOI] [PMC free article] [PubMed] [Google Scholar]
- 13.Carter JJ, Paulson KG, Wipf GC, et al. Association of Merkel cell polyomavirus-specific antibodies with Merkel cell carcinoma. J Natl Cancer Inst. 2009;101:1510–22. doi: 10.1093/jnci/djp332. [DOI] [PMC free article] [PubMed] [Google Scholar]
- 14.Kean JM, Rao S, Wang M, Garcea RL. Seroepidemiology of human polyomaviruses. PLoS Pathog. 2009;5:e1000363. doi: 10.1371/journal.ppat.1000363. [DOI] [PMC free article] [PubMed] [Google Scholar]
- 15.Touze A, Gaitan J, Arnold F, et al. Generation of Merkel cell polyomavirus virus-like particles and their application to the detection of MCV antibodies. J Clin Microbiol. 2010 May;48(5):1767–70. doi: 10.1128/JCM.01691-09. [DOI] [PMC free article] [PubMed] [Google Scholar]
- 16.Nakamura T, Sato Y, Watanabe D, et al. Nuclear localization of Merkel cell polyomavirus large T antigen in Merkel cell carcinoma. Virology. 2010;398:273–9. doi: 10.1016/j.virol.2009.12.024. [DOI] [PubMed] [Google Scholar]
- 17.Daling JR, Madeleine MM, Johnson LG, et al. Human papillomavirus, smoking, and sexual practices in the etiology of anal cancer. Cancer. 2004;101:270–80. doi: 10.1002/cncr.20365. [DOI] [PubMed] [Google Scholar]
- 18.Carter JJ, Madeleine MM, Shera K, et al. Human papillomavirus 16 and 18 L1 serology compared across anogenital cancer sites. Cancer Res. 2001;61:1934–40. [PubMed] [Google Scholar]
- 19.Sehr P, Zumbach K, Pawlita M. A generic capture ELISA for recombinant proteins fused to glutathione S-transferase: validation for HPV serology. J Immunol Methods. 2001;253:153–62. doi: 10.1016/s0022-1759(01)00376-3. [DOI] [PubMed] [Google Scholar]
- 20.Waterboer T, Sehr P, Michael KM, et al. Multiplex human papillomavirus serology based on in situ-purified glutathione s-transferase fusion proteins. Clin Chem. 2005;51:1845–53. doi: 10.1373/clinchem.2005.052381. [DOI] [PubMed] [Google Scholar]
- 21.Waterboer T, Sehr P, Pawlita M. Suppression of non-specific binding in serological Luminex assays. J Immunol Methods. 2006;309:200–4. doi: 10.1016/j.jim.2005.11.008. [DOI] [PubMed] [Google Scholar]
- 22.Garneski KM, Warcola AH, Feng Q, Kiviat NB, Leonard JH, Nghiem P. Merkel cell polyomavirus is more frequently present in North American than Australian Merkel cell carcinoma tumors. J Invest Dermatol. 2009;129:246–8. doi: 10.1038/jid.2008.229. [DOI] [PMC free article] [PubMed] [Google Scholar]
- 23.Allred DC, Harvey JM, Berardo M, Clark GM. Prognostic and predictive factors in breast cancer by immunohistochemical analysis. Mod Pathol. 1998;11:155–68. [PubMed] [Google Scholar]
- 24.Shuda M, Feng H, Kwun HJ, et al. T antigen mutations are a human tumor-specific signature for Merkel cell polyomavirus. Proc Natl Acad Sci U S A. 2008;105:16272–7. doi: 10.1073/pnas.0806526105. [DOI] [PMC free article] [PubMed] [Google Scholar]
- 25.Shimada H, Takeda A, Arima M, et al. Serum p53 antibody is a useful tumor marker in superficial esophageal squamous cell carcinoma. Cancer. 2000;89:1677–83. [PubMed] [Google Scholar]
- 26.Zumbach K, Kisseljov F, Sacharova O, et al. Antibodies against oncoproteins E6 and E7 of human papillomavirus types 16 and 18 in cervical-carcinoma patients from Russia. Int J Cancer. 2000;85:313–8. doi: 10.1002/(sici)1097-0215(20000201)85:3<313::aid-ijc3>3.0.co;2-w. [DOI] [PubMed] [Google Scholar]
- 27.Gupta SG, Wang LC, Penas PF, Gellenthin M, Lee SJ, Nghiem P. Sentinel lymph node biopsy for evaluation and treatment of patients with Merkel cell carcinoma: The Dana-Farber experience and meta-analysis of the literature. Arch Dermatol. 2006;142:685–90. doi: 10.1001/archderm.142.6.685. [DOI] [PubMed] [Google Scholar]
Associated Data
This section collects any data citations, data availability statements, or supplementary materials included in this article.