

Abstract
High levels of the adipocytokine leptin are associated with reduced risk of Alzheimer’s disease (AD). Leptin treatment also reduces β-amyloid (Aβ) levels in in vivo and in vitro models of AD. Aβ and leptin interact with the Akt/mammalian target of rapamycin complex1 (mTORC1) signaling pathway. Akt/mTORC1 activation reduces tau phosphorylation through the inhibition of the downstream enzyme GSK-3β. mTORC1 also regulates translation of many proteins including leptin. While Aβ has been shown to inactivate Akt, inhibit mTORC1, and facilitate the phosphorylation of tau, leptin activates both Akt and mTORC1 and reduces tau phosphorylation. However, the extent to which Aβ may modulate leptin expression and increase tau phosphorylation involving Akt/mTORC1 has not been determined. In this study, we show that incubation of organotypic slices from rabbit hippocampus with Aβ downregulates leptin expression, inhibits Akt, activates GSK-3β, increases tau phosphorylation, and inactivates mTORC1. Leptin treatment reverses Aβ effects by alleviating Akt inhibition, preventing GSK-3β activation, reducing tau phosphorylation, and activating mTORC1. On the other hand, Rapamycin, an allosteric inhibitor of mTORC1, downregulates leptin expression, increases tau phosphorylation, and does not affect Akt and GSK-3β. Our results demonstrate for the first time that Aβ regulates leptin expression and tau phosphorylation through mTORC1.
Keywords: Alzheimer’s disease, β-amyloid, Leptin, mTOR, Tau, Organotypic slices
Introduction
Alzheimer’s disease (AD) is neuropathologically characterized by the accumulation of β-amyloid (Aβ) peptide as extracellular plaques and the deposition of hyperphosphorylated tau in intracellular neurofibrillary tangles (NFT’s). Epidemiological studies suggest a link between dysregulation of plasma leptin levels and the development of AD. Lower circulating levels of leptin have been reported in AD patients (Power et al. 2001). A recent prospective study involving 785 human subjects demonstrated that higher circulating leptin levels were associated with lower risk of dementia including AD (Lieb et al. 2009). There is substantial evidence that leptin is endogenously produced in the brain (Li et al. 1999; Ur et al. 2002) and modulates Aβ production and tau hyperphosphorylation in vivo and in vitro (for review, see Tezapsidis et al. 2009). Chronic leptin administration has been reported to reduce Aβ levels in Tg 2576 (Fewlass et al. 2004) and improve cognitive performance in CRND8 transgenic mice models for AD (Greco et al. 2009a). Leptin also decreases the activity of BACE-1, the enzyme that initiates processing of amyloid precursor protein (APP) to yield Aβ, in SH-SY5Y cells (Fewlass et al. 2004). Tau phosphorylation, increased levels of which is a hallmark of AD, is also reduced by leptin in SH-SY5Y cells, differentiated human NT2 cells and rat primary cortical neurons (Greco et al. 2008; Greco et al. 2009b; Greco et al. 2009c). Collectively, these data suggest that leptin downregulation precedes and triggers Aβ and tau phosphorylation accumulation. While it is demonstrated that Aβ peptide can cause tau phosphorylation, the possibility that this peptide can also modulate leptin has not been tested. It may be possible that increased Aβ levels cause leptin downregulation, thereby further accelerating tau phosphorylation. Several lines of evidence point to the protein kinase B (Akt)/mammalian target of rapamycin (mTOR) signaling pathway as a potential intermediate through which leptin and Aβ modulate one another and regulate tau phosphorylation. mTOR is downstream of the AkT pathway and constitutes an integral part of the AkT/mTOR pathway. mTOR resides in two multi-protein complexes termed mTORC1 and mTORC2 (Sarbassov et al. 2004; Sarbassov et al. 2005a; Sarbassov et al. 2005b). mTORC1 activity is enhanced by phosphorylation at Ser2448 residue and can be measured by activation of the downstream proteins p70S6K1 and 4E-BP (Hara et al. 2002; Kim et al. 2002; Loewith et al. 2002). It has been established that mTORC1 regulates leptin biosynthesis at the level of translation (Roh et al. 2003; Cho et al. 2004; Chakrabarti et al. 2008) and Aβ has been demonstrated to inhibit mTORC1 (Chen et al. 2009). One can expect that inhibition of mTORC1 by Aβ may impair leptin translation and reduces its expression levels. Inhibition of mTOR by Aβ can in turn inactivate Akt (Chen et al. 2009), thus potentially activating the downstream enzyme GSK-3β (Magrane et al. 2005; Nassif et al. 2007). On the other hand, leptin can phosphorylate Akt, subsequently inactivating GSK-3β and activating mTORC1 (Cota et al. 2006; Guo et al. 2008; Maya-Monteiro et al. 2008; Greco et al. 2009c). GSK-3β is a serine/threonine kinase that phosphorylates numerous proteins including tau protein (Sperber et al. 1995). GSK-3β activity is facilitated by phosphorylation at Tyr216 and reduced by phosphorylation at Ser9 (Dajani et al. 2001). Therefore, increased levels of p-Tyr216 GSK-3β enhance tau phosphorylation and reduced levels of this enzyme preclude the hyperphosphorylation of tau. Likewise, increased levels of p-Ser9 GSK-3β reduce tau phosphorylation and reduced phosphorylation of GSK-3β at Ser9 enhances tau hyperphosphorylation.
In this study we determined the effects of Aβ, soluble and fibrillar, on leptin expression, leptin receptor phosphorylation, as well as on Akt/mTORC1 signaling and tau phosphorylation. We also treated slices with leptin and the mTORC1 inhibitor rapamycin to further characterize the involvement of the Akt/mTORC1 signaling pathway in Aβ-leptin interaction. The experiments were carried out in organotypic slices from adult rabbit hippocampus, a model system we have previously used to demonstrate that leptin reduces oxysterol-induced increase in Aβ and phosphorylated tau (Marwarha et al. 2010).
Materials and methods
Materials
Leptin, Aβ42, and rapamycin were purchased from Sigma Aldrich (St. Louis, MO), Hibernate A dissection medium was obtained from BrainBits LLC (Springfield, IL), and membrane inserts for organotypic slices from Millipore (Bedford, MA). The antibiotic/antimycotic agents for media (100 U/ml penicillin, and 0.05 μM/ml streptomycin) were purchased from Sigma Aldrich and all other supplies for the culture of organotypic slices (Neurobasal medium, B27, horse serum, and glutamine) were purchased from Invitrogen (Carlsbad, CA).
Organotypic slice preparation
The organotypic slice system has many advantages in that connectivity between neurons, interneurons and glia is maintained. In addition, rabbits have a phylogeny closer to humans than rodents (Graur et al. 1996), and their Aβ sequence, unlike that of rodents, is similar to the Aβ sequence of the human (Johnstone et al. 1991). Organotypic hippocampal slices were prepared from White New Zealand adult male rabbits (n = 4; 1.5–2 year old; Harlan Laboratories, Madison, WI). Male rabbits were used to exclude potential influence of hormonal changes that occur in females as a result of the estrous cycle. There is evidence that leptin levels fluctuate during the estrous cycle in female rats (Tanaka et al. 2001). Serum leptin levels also increase during the mid-luteal phase of menstruation by as much as 50% compared to early follicular phase in women (Riad-Gabriel et al. 1998; Ludwig et al. 2000). Brains were rapidly removed and organotypic slices were prepared as we have previously shown (Sharma et al. 2008; Marwarha et al. 2010) and as follows. Hippocampi were dissected, trimmed of excess white matter and placed into chilled dissection media composed of hibernate A containing 20% horse serum and 0.5 mM l-glutamine. Isolated tissue was placed on a wetted filter paper on the Teflon stage of a MacIlwain chopper for coronal sectioning (300 μm thick). From each rabbit hippocampi, about 60 sections were cut (120 sections per rabbit). Sections were placed in new dissection media and allowed to rest five minutes on ice before separating and plating on membrane inserts. Five sections were placed on each insert with a total of 12 inserts per hippocampus (24 inserts per rabbit). Inserts were placed in 35 mm culture dishes containing 1.1 ml growth media (Neurobasal A with 20% horse serum, 0.5 mM l-glutamine, 100 U/ml penicillin, and 0.05 μM/ml streptomycin), and warmed 30 min prior to plating to ensure complete equilibration. Slices were exposed to a humidified incubator atmosphere (4.5% CO2 and 35°C). Media was changed at DIV1 and slices were switched at DIV4 to a defined medium consisting of Neurobasal A, 2% B27 supplement and 0.5 mM l-glutamine. All animal procedures were carried out in accordance with the U.S. Public Health Service Policy on the Humane Care and Use of Laboratory Animals and were approved by the Institutional Animal Care and Use Committee at the University of North Dakota.
Treatments
Organotypic slices from each rabbit were incubated at DIV10 with 10 μM soluble Aβ42, 10 μM fibrillar Aβ42 or 100 nM rapamycin in presence or absence of leptin. A stock solution of leptin of 62.5 μM (1mg/ml) was prepared in sterile distilled water and diluted in media at 1:2000 to a concentration of 31.25nM (0.5μg/ml), 1:1000 to a concentration of 62.5nM (1.0μg/ml), and 1:500 to a concentration of 125nM (2μg/ml). Aβ42 peptide was dissolved in sterile distilled water to yield a 250 μM (1mg/ml) stock solution and diluted in media at 1:25 to a final concentration of 10μM (40μg/ml). To prepare the fibrillar Aβ42 (fAβ42), 250 μM freshly prepared stock solution of Aβ42 peptide in sterile distilled water was incubated for 72 hours as we have previously described (Ghribi et al. 2003a; Ghribi et al. 2003b). BCA assay was performed to estimate the concentration of Aβ fibrils. The fibrillar Aβ42 was added to media to a final concentration of 10μM. Rapamycin was purchased as a 2.5mg/ml (2.74mM) stock solution in DMSO and was diluted in media at 1:274 to yield a working stock solution of 10μM. The rapamycin solution was further diluted at 1:100 in media to yield a final concentration of 100nM. In several other studies, rapamycin was used up to 1μM concentration and Aβ at 5–20μM concentration in SH-SY5Y human neuroblastoma cells and rat cortical neurons (Lafay-Chebassier et al, 2006; Chen et al, 2009). Each treatment was delivered into the media of 3 inserts with 5 sections from each of the 4 rabbits. A set of untreated slices were also included as control sections. Sections were harvested after 72 hours of treatment.
Western blot analysis
Organotypic slices were homogenized in T-PER tissue protein extraction reagent (Thermo Scientific, Rockford, IL) supplemented with protease and phosphatase inhibitors. Protein concentrations from whole tissue homogenates were determined with BCA protein assay. Proteins (10 μg) were separated in SDS-PAGE gels followed by transfer to a polyvinylidene difluoride membrane (BioRad, Hercules, CA) and incubation with the following antibodies: anti-leptin rabbit antibody (1:1000; ABR Affinity Bioreagents, Rockford, IL), anti-leptin receptor (ObRb) rabbit antibody (1:1000; ABR Affinity Bioreagents, Rockford, IL), anti-phospho (Tyr1138) leptin receptor (p-Tyr1138 ObRb) goat antibody (1:100; Santa Cruz, Santa Cruz, CA), anti-SOCS3 mouse antibody (1:500; Cell Signaling, Boston, MA), anti-mTOR mouse antibody (1:500; Cell Signaling, Boston, MA), anti-phospho (Ser2448) mTOR mouse antibody (1:100; Cell Signaling, Boston, MA), anti-p70S6K1 rabbit antibody (1:1000; Cell Signaling, Boston, MA), anti-phospho (Thr389) p70S6K1 mouse antibody (1:500; Cell Signaling, Boston, MA), anti-CP13 mouse antibody (1:500; gift from Dr. Peter Davies, Albert Einstein College of Medicine, NYC, NY), anti-PHF1 mouse antibody (1:500; gift from Dr. Peter Davies, Albert Einstein College of Medicine, NYC, NY), anti-Tau5 mouse antibody (1:500; Calbiochem, SanDiego, CA), anti-Akt rabbit antibody (1:1000; Cell Signaling, Boston, MA), anti-phospho (Ser473) Akt rabbit antibody (1:500; Cell Signaling, Boston, MA), anti-GSK-3β mouse antibody (1:500; BD Biosciences, San Jose, CA), anti-phospho (Ser9) GSK-3β rabbit antibody (1:100; Cell Signaling, Boston, MA), and anti-phospho (Tyr216) GSK-3β rabbit antibody (1:500; BD Biosciences, San Jose, CA). β-actin was used as a gel loading control. The blots were developed with enhanced chemiluminescence (Immmun-star HRP chemiluminescent kit, Bio-Rad, Hercules, CA). Bands were visualized on a polyvinylidene difluoride membrane and analyzed by LabWorks 4.5 software on a UVP Bioimaging System (Upland, CA). Quantification of results was performed by densitometry and the results analyzed as total integrated densitometric values (arbitrary units).
Quantification of leptin levels by ELISA
Leptin levels were quantified in the organotypic slices using a quantitative sandwich ELISA kit (R & D systems, Minneapolis, MN) as per the manufacturer’s protocol. Organotypic slices treated with 10 μM soluble Aβ42, 10 μM fAβ42, 100 nM rapamycin, or leptin (0.5 μg/ml=31.25nM, 1μg/ml=62.5nM, and 2μg/ml=125nM) were homogenized in T-PER tissue protein extraction reagent (Thermo Scientific, Rockford, IL) supplemented with protease and phosphatase inhibitors. Protein concentrations in tissue homogenates were determined with BCA protein assay. The tissue homogenates were further diluted in PBS to yield a protein concentration of 1 mg/ml. 1 μL of the tissue homogenate from each treatment group normalized to 1 mg/ml protein concentration was further diluted 1:100 in the assay diluent buffer provided with the kit. A total of 100 μL of the diluted homogenate was added to each well of the ELISA plate for the assay. The optical density of each well was determined using a microplate reader set at 450nm. The concentrations obtained were multiplied by a factor of 100 to account for the 100-fold dilution. The leptin levels were measured in triplicate for each treatment. The final results are expressed as ng of leptin/ml of tissue homogenate.
Quantitative Real time RT-PCR analysis
Total RNA was isolated and extracted from organotypic slices using the 5 prime “PerfectPure RNA tissue kit” (5 Prime, Inc., Gaithersburg, MD). RNA estimation was performed using “Quant-iT RNA Assay Kit” using a Qubit fluorometer according to the manufacturer’s protocol (Invitrogen, Carlsbad, CA). cDNA was obtained by reverse transcribing 1 μg of extracted RNA using an iScript cDNA synthesis kit” (BioRad, Hercules, CA). The following oligomeric primers (Sigma, St Louis, MO) were used to amplify the leptin mRNA in the hippocampal organotypic slices: leptin forward primer – 5′-AGTCTGCCGTCCCGAAATGTG-3′, leptin reverse primer - 5′-CCAGGGTCTCCAAGCCACTG. The cDNA amplification was performed using an iQ SYBR Green Supermix kit following the manufacturer’s instructions (BioRad, Hercules, CA). The amplification was performed using an iCycler iQ Multicolor Real Time PCR Detection System (BioRad, Hercules, CA). The expression of specific leptin transcripts amplified were normalized to the expression of glyceraldehyde -3-phosphate dehydrogenase (GAPDH).
Statistical analysis
The significance of differences among the samples was assessed by either unpaired Student’s t-test (for comparison of two treatments) or by One Way Analysis of Variance (One Way ANOVA) followed by Tukey’s post-hoc test (for comparison of multiple treatments). Statistical analysis was performed with GraphPad Prism software 4.01. Quantitative data for Western blotting analysis are presented as mean values ± S.E.M with unit value assigned to control and the magnitude of differences among the samples being expressed relative to the unit value of control. Quantitative data for Real Time RT-PCR analysis are presented as mean values ± S.E.M, with reported values being the product of absolute value of the ratio of leptin mRNA to GAPDH mRNA multiplied by 1000000.
Results
Aβ decreases leptin expression levels
Western blotting and densitometric analysis (Fig 1a) show a decrease in leptin levels in the organotypic hippocampal slices treated with soluble Aβ42 and fAβ42 compared to untreated organotypic slices. Quantitative determination of leptin concentrations with an ELISA immunoassay (Fig 1b) also clearly demonstrates that both soluble Aβ42 and fAβ42 decrease leptin levels in hippocampal organotypic slices. Real time RT-PCR analysis (Fig 1c) shows a significant decrease in leptin mRNA in slices treated with soluble Aβ42 and fAβ42 compared to untreated organotypic slices. The magnitude in reduction of leptin levels and mRNA is similar with soluble and fAβ42.
Figure 1.

Efects of Aβ on leptin expression levels in organotypic slices from rabbit hippocampus. (a) Representative Western blot and densitometric analysis demonstrate that treatment with 10 μM soluble Aβ42 or fibrillar Aβ42 (fAβ42) for 72 hours significantly decreases protein levels of leptin compared to untreated slices. (b) Quantitative determination of leptin concentrations by ELISA shows that Aβ treatments reduce leptin concentrations in organotypic slices. (c) Real Time RT- PCR analysis demonstrates that treatment with soluble Aβ42 and fibrillar Aβ42 (fAβ42) for 72 hours significantly decreases mRNA expression of leptin compared to untreated slices. Data is presented as mean values ± S.E.M. *p<0.05, **p<0.01, ***p<0.001 versus control.
Leptin concentrations and phosphorylation of leptin receptors following treatment of organotypic slices with increased concentrations of exogenous leptin
In order to determine the concentration of leptin that activates leptin receptors by increasing phosphorylation (p-Tyr1138 ObRb), we carried out a dose response experiment using 0.5 μg/ml=31.25nM, 1μg/ml=62.5nM, and 2μg/ml=125nM of leptin. Western blotting and densitometric analysis (Fig 2a) shows that treatment of organotypic slices with leptin at 125 nM only induces a 40% increase in levels of p-Tyr1138 ObRb. Treatment of organotypic slices with the two lower concentrations of leptin, 31.25nM and 62.5nM, had no effect on the levels of p-Tyr1138 ObRb (Fig 2a).
Figure 2.
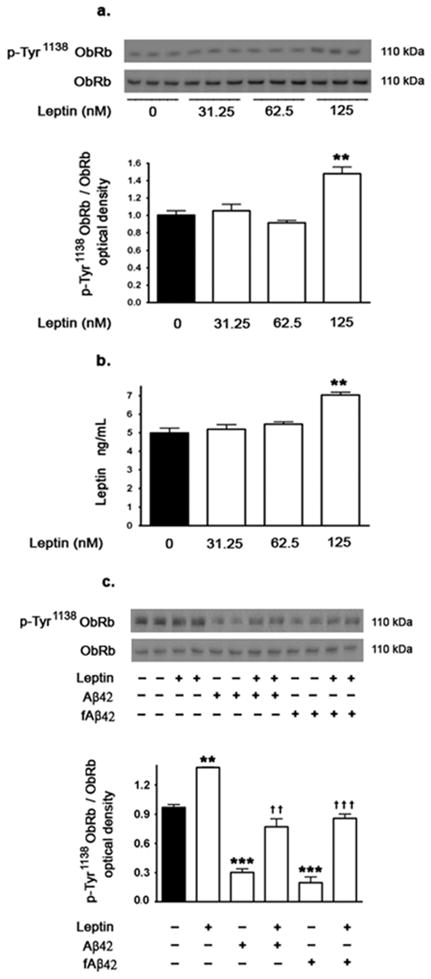
Effects of leptin treatment on leptin receptor phosphorylation and leptin concentrations. (a) Representative Western blot and densitometric analysis demonstrating that treatment of organotypic slices with 125nM leptin elicits an increase in leptin receptor phosphorylation (p-Tyr1138 ObRb) compared to untreated organotypic slices or slices treated with 31.25 or 62.5 nM. (b) Quantitative determination of leptin concentrations by ELISA in organotypic slices demonstrates that 125nM but not 31.25nM or 62.5 nM leptin elicits an increase in leptin concentrations in organotypic slice tissue. (c) Representative Western blot and densitometric analysis showing that treatment of organotypic slices with soluble Aβ42 and fAβ42 for 72 hours significantly decreases levels of phosphorylated leptin receptor (p-ObRb) at Tyr1138 residue. Leptin (125nM) treatment reverses the effects of soluble Aβ42 and fAβ42 on levels of p-Tyr1138 ObRb. Treatment of slices with leptin (125nM) alone increased p-Tyr1138 Ob-Rb. Data is presented as mean values ± S.E.M. **p<0.01, ***p<0.001 versus control. †† p<0.01, ††† p<0.001 versus soluble Aβ42 or fibrillar Aβ42.
To determine the basal levels of leptin in hippocampal organotypic slices as well as the amount of exogenous leptin that is up taken from the media by the organotypic slices, we used a quantitative ELISA immunoassay. Our results show that basal concentrations of leptin are ~5 ng/ml (310 pM) and these concentrations are unchanged with 31.25 or 62.5 nM leptin. However, the 125 nM leptin induced a ~35% increase in leptin concentrations (7ng/mL=435pM) in organotypic slices tissue compared to control slices (Fig 2b). These results are in accordance with the increase in the p-Tyr1138 ObRb determined with 125nM leptin treatment.
Aβ decreases the phosphorylation of leptin receptor, effect that is reversed by leptin treatment
The extent to which reduction of leptin expression levels by soluble Aβ42 and fAβ42 is associated with reduction in leptin signaling was determined by measuring levels of phosphorylated leptin receptors. Our results show that soluble Aβ42 and fAβ42 significantly decreased leptin receptor (ObRb) phosphorylation in hippocampal slices, as determined by a decrease in p- Tyr1138 ObRb (Fig 2c). Western blotting and densitometric analysis shows that treatment with 125nM leptin reverses the effects of soluble Aβ42 and fibrillar Aβ42 on p- Tyr1138 ObRb, restoring levels of p-Tyr1138 ObRb to basal levels (Fig 2c). Treatment with leptin alone markedly increased levels of p-Tyr1138 ObRb beyond basal levels.
Aβ increases levels of the phosphatase SOCS-3
SOCS-3 (Suppressor Of Cytokine Signaling-3) is a 26 kDa protein phosphatase implicated in the termination of signal transduction pathways that are initiated by some of the growth factors and cytokines. There are a multitude studies implicating SOCS-3 as a leading player in the dephosphorylation of leptin receptor and termination of leptin signaling culminating in a phenomenon known as “leptin resistance” (Bjorbaek et al. 1999). As we observed a reduction in leptin receptor phosphorylation with both soluble Aβ42 and fAβ42, we determined the effects of Aβ treatments on SOCS-3 levels. Western blotting and densitometric analysis show that treatment with Aβ42 or fAβ42 results in a~2-fold increase in levels of SOCS-3 (Fig 3). Interestingly, concomitant treatment of leptin with either soluble Aβ42 or fAβ42 produces no effect on SOCS-3 levels (Fig 3). The significant increase in SOCS-3 expression levels-induced by Aβ treatments may be a mechanism by which Aβ reduces leptin receptor phosphorylation and ultimately leptin signaling.
Figure 3.

Representative Western blot and densitometric analysis showing that treatment of organotypic slices with soluble Aβ42 and fAβ42 for 72 hours significantly increases levels of the phosphatase SOCS-3. Leptin (125nM) treatment does not affect levels of SOCS-3. Data is presented as mean values ± S.E.M. * p<0.05 versus control.
mTORC1 regulates leptin expression levels in the hippocampal organotypic slices
To determine the extent to which mTORC1 regulates leptin expression levels, we treated slices with rapamycin, a specific inhibitor of mTORC1. Rapamycin dramatically reduces protein levels of leptin as determined with Western blotting (Fig 4a) and ELISA immunoassay (Fig 4b). Real time RT-PCR analysis clearly demonstrates that rapamycin significantly decreases leptin mRNA expression by 65% (Fig 4c). The effects of rapamycin on leptin expression levels are similar to those observed with Aβ in figure 1. The effects of rapamycin on leptin mRNA is of particular interest as mTORC1 is primarily involved in translational control of leptin protein rather than transcription of this protein. Rapamycin is an allosteric inhibitor of mTORC1 and it is not clear whether rapamycin affects mTORC1 mRNA. Allosteric inhibition of mTORC1 by rapamycin may lead to inhibition of translation of transcription factors that are necessary for leptin expression.
Figure 4.

Western blot, ELISA and Real Time RT- PCR analysis demonstrating the involvement of mTOR in leptin expression. (a) Representative Western blot and densitometric analysis show that treatment of organotypic slices with the mTOR inhibitor rapamycin for 72 hours significantly decreases protein levels of leptin compared to control slices. (b) Quantitative measurement of leptin levels using ELISA demonstrate that treatment of organotypic slices with rapamycin significantly decreases leptin concentrations. (c) Real Time RT- PCR analysis shows that treatment of organotypic slices with rapamycin significantly also decreases leptin mRNA expression. Data is presented as mean values ± S.E.M. **p<0.01, ***p<0.001 versus control.
Aβ attenuates mTORC1 signaling in the hippocampal organotypic slices and treatment with exogenous leptin restores mTORC1 signaling
Western blotting and densitometric analysis show that soluble Aβ42 and fAβ42 significantly attenuate mTORC1 activation in hippocampal organotypic slices as determined by a decrease in p-Ser2448 mTOR (Fig 5a). Treatment with leptin alone markedly increased levels of p-Ser2448 mTOR by 3-fold compared to the basal levels. Leptin treatment also restored the decrease in p-Ser2448 mTOR levels induced by either soluble Aβ42 or fAβ42 (Fig 5a). On the other hand, treatment with the allosteric mTORC1 inhibitor rapamycin did not affect mTOR phosphorylation.
Figure 5.

Effect of Aβ, rapamycin and leptin treatment on mTOR phosphorylation and activation. (a) Treatment of organotypic slices with soluble Aβ42 or fAβ42 for 72 hours significantly decreases phosphorylation of mTOR at Ser2448 residue. The mTOR inhibitor rapamycin does not affect mTOR phosphorylation. Leptin treatment, either alone or in association with soluble Aβ and rapamycin, dramatically increases p-Ser2448 mTOR to levels higher than basal levels. However, leptin only partially reversed the decrease in levels of p-Ser2448 mTOR induced by fAβ42. (b) Treatment of organotypic slices with soluble Aβ42, fAβ42 and rapamycin for 72 hours significantly reduces phosphorylation of p70S6K1 (p-Thr389 p70S6K1). Leptin treatment, either alone or in association with soluble Aβ increases p-Thr389 p70S6K1to levels higher than basal levels. Leptin also prevented the decrease in p-Thr389 p70S6K1 induced by fAβ42. However, leptin fails to prevent the inhibition of p-Thr389 p70S6K1 caused by rapamycin. Data is presented as mean values ± S.E.M. *p<0.05, **p<0.01 and ***p<0.001 versus control, † p<0.05 and ††† p<0.001 versus soluble Aβ42 or fAβ42, ‡ ‡ ‡ p<0.001 versus rapamycin.
mTORC1 activation can be assessed by measuring the phosphorylation levels of p70S6K1, a serine/threonine kinase that functions as a downstream target of the AKT/mTORC1 signaling pathway (Martin and Blenis 2002). Our results show that Aβ, soluble and fibrillar, significantly reduced levels of p-Thr389 p70S6K1 (Fig 5b). Treatment with rapamycin dramatically lowered levels of p-Thr389 p70S6K1 compared to basal levels and to levels induced by Aβ. These results show that both Aβ and rapamycin inhibited mTORC1 activation. Treatment with leptin, while increased p-Thr389 p70S6K1 in presence or absence of Aβ, it failed to reverse the effects of rapamycin on p-Thr389 p70S6K1 levels (Fig 5b).
Leptin treatment attenuates the Aβ and Rapamycin-induced increase in p-tau levels
Because Aβ is known to cause tau phsophorylation and leptin to reduce phsophorylation of tau, we determined the extent to which mTORC1 is involved in tau phosphorylation. Western blotting and densitometric analysis demonstrate that treatment of organotypic slices with fAβ42 increased levels of phosphorylated tau as detected by the antibodies CP13 and PHF-1 (Fig 6). CP13 and PHF-1 antibodies detect tau phosphorylated at Ser202, Thr205 and Ser396, Ser404 respectively. Treatment with soluble Aβ42 resulted in phosphorylation of tau at sites recognized by the antibody CP13, but did not alter phosphorylation detected by PHF-1. On the other hand, leptin treatment significantly reduced the basal levels of phosphorylated tau and attenuated the increase in tau phosphorylation induced by soluble Aβ42 and fAβ42. Similarly to fAβ42, the mTORC1 inhibitor rapamycin significantly increased phosphorylated tau levels, suggesting the involvement of mTORC1 in the regulation of tau phosphorylation. Treatment with leptin reduced rapamycin-induced tau phosphorylation detected with CP13 but not with PHF-1. This suggests that mTORC1 activation and signaling is necessary in the leptin – induced reduction of phosphorylation of tau at the Ser396 and Ser404 residues.
Figure 6.

Representative Western blots and densitometric analysis demonstrating the effect of Aβ, rapamycin and leptin treatments on tau levels. Treatment of organotypic slices with soluble Aβ42, fAβ42 or rapamycin for 72 hours significantly increases phosphorylation of tau at the Ser202 and Thr205 residues as detected by CP13 antibody. Leptin treatment decreases both basal levels, soluble Aβ42 and rapamycin-induced, but not fAβ42 -induced, phosphorylated Ser202 and Thr205 tau. fAβ42 and rapamycin, but not soluble Aβ42, increased levels of tau phosphorylated at Ser396 and Ser404 residues as detected by PHF-1 antibody. Leptin treatment, while reduces basal levels and fAβ42 - induced phosphorylated Ser396 and Ser404 tau levels, fails to reduce rapamycin-induced increase in levels of phosphorylated tau at Ser396 and Ser404. Data is presented as mean values ± S.E.M. *p<0.05 and **p<0.01 versus control, † p<0.05 versus soluble Aβ42 or fAβ42, ‡ p<0.05 versus rapamycin
Leptin treatment increases levels of p-Akt and inactive p-GSK-3β
While inhibition of Akt and subsequent activation of GSK-3β by phosphorylation at Tyr216 (p-Tyr216 GSK-3β) phosphorylates tau, activation of Akt and inhibition of GSK-3β by phosphorylation at Ser9 (p-Ser9 GSK-3β) reduces tau phosphorylation (Sutherland et al. 1993). We determined the extent to which reduction of leptin and increase of tau phosphorylation induced by Aβ and rapamycin is associated with the inactivation of Akt and activation of GSK3-β. Western blotting and densitometric analysis demonstrate that soluble and fAβ42 significantly reduce levels of the active p-Ser473 Akt (Fig 7a). Treatment with rapamycin alone did not affect p-Ser473 Akt levels. Treatment with leptin however markedly increased levels of p- Ser473 Akt to levels higher than basal levels in cells untreated or treated with soluble Aβ42, fAβ42 or rapamycin. The magnitude of increase by leptin of p-Ser473 Akt levels is similar in all treatment groups (**p<0.01). On the other hand, treatment with Aβ, soluble and fibrillar, reduced levels of the inactive form of GSK-3β, p-Ser9 GSK-3β, and increases levels of active form of GSK-3β, p-Tyr216 GSK-3β compared to control levels (Fig 7b). Leptin increased levels of inactive p-Ser9 GSK-3β levels at basal state and in the presence of Aβ but did not affect levels of active Tyr216 GSK-3β. Treatment with rapamycin did not affect p-Ser9 GSK-3β or p-Tyr216 GSK-3β levels and co-treatment with leptin did not affect levels of p-Ser9 GSK-3β in presence of rapamycin. These results suggest that GSK-3β may be involved in the phosphorylation of tau induced by Aβ but not by rapamycin.
Figure 7.


Effects of Aβ, rapamycin and leptin treatments on p- Ser473 AkT, p- Ser9 GSK-3β, and p- Tyr216 GSK-3β levels. (a) Treatment of organotypic slices for 72 hours with soluble Aβ42 or fAβ42, but not with rapamycin, significantly decreases phosphorylation of AkT at Ser473. Leptin treatment, either alone or in association with Aβ or rapamycin, markedly increases p-Ser473 AkT to levels higher than the basal levels. (b) Treatment of organotypic slices for 72 hours with soluble Aβ42 or fAβ42 reduces p-Ser9 GSK-3β levels and increases p-Tyr216 GSK-3β levels. Rapamycin does not affect p-Ser9 GSK-3β or p-Tyr216 GSK-3β levels. Leptin treatment increases p-Ser9 GSK-3β alone or in the presence of Aβ but does not affect p-Tyr216 GSK-3β levels. Data is presented as mean values ± S.E.M. *p<0.05, **p<0.01 and ***p<0.001 versus control; † p<0.05 and †† p<0.01 versus soluble Aβ42 or fAβ42; ‡ p<0.05 versus rapamycin.
Discussion
This study was designed to determine the effects of Aβ on leptin expression and the involvement of the Akt/mTORC1 signaling in Aβ-leptin interaction. Our results show for the first time that both soluble Aβ42 and fAβ42 induce a decrease in expression levels of leptin and leptin receptor phosphorylation in rabbit hippocampus. One of the mechanisms by which Aβ induces a reduction in leptin receptor phosphorylation (a reduction in p-Tyr1138 ObRb) is by decreasing the endogenous expression and levels of leptin in the hippocampus. It has also been reported that the phosphatase Suppressor of Cytokine Signaling -3 (SOCS-3) protein is involved in the dephosphorylation and inactivation of a multitude of cytokine receptors, including leptin receptor (Bjorbaek et al. 1999). We therefore determined the effect of Aβ on the expression levels of SOCS-3. We found that both soluble and fAβ42 evoke an increase in the levels of SOCS-3. Increased levels of SOCS-3 could be an additional mechanism by which Aβ reduces leptin receptor phosphorylation. Attenuation of leptin receptor phosphorylation is tantamount to the attenuation of leptin signaling. Leptin signaling is critical in memory formation, expression of neurotrophic factors such as BDNF, glucose regulation and cell survival in the hippocampus. Therefore the attenuation of leptin receptor phosphorylation by Aβ may lead to deleterious effects that are associated with accumulation of Aβ peptide.
We also demonstrate in this study that mTORC1 signaling is necessary for leptin expression as the mTORC1 inhibitor rapamycin markedly reduced leptin expression levels. In line with these results, we show that Aβ-induced reduction in leptin expression levels is associated with inhibition of mTORC1 activation as evidenced by reduction in phosphorylated levels of mTOR and of the downstream kinase p70S6K1. Our data suggests that inhibition of mTORC1 activation and signaling is a mechanism through which Aβ exhibits its inhibitory effects on leptin expression levels. mTORC1 signaling has been shown to be attenuated in the cortex of APP/PS1 transgenic mice that exhibit increased Aβ levels as well as in lymphocytes of AD patients (Lafay-Chebassier et al. 2005).
mTOR resides in two mutually exclusive multi-protein complexes termed mTORC1 and mTORC2 (Sarbassov et al. 2004; Sarbassov et al. 2005a; Sarbassov et al. 2005b). mTOR associated with Raptor forms the core of the nutrient dependent and rapamycin sensitive-mTORC1 complex that regulates translation through p70S6K1 and 4E-BP (Hara et al. 2002; Kim et al. 2002; Loewith et al. 2002). On the other hand, mTOR associated with Rictor nucleates into a different multiprotein complex termed mTORC2 which is nutrient independent and rapamycin insensitive (Loewith et al. 2002; Jacinto et al. 2004; Sarbassov et al. 2004). mTORC2 phosphorylates AkT at Ser473 resulting in its maximal activation (for Review, see Sarbassov et al. 2005a; Sarbassov et al. 2005b). In this study, we demonstrate for the first time, that treatment with exogenous leptin attenuates the Aβ-induced inhibition of mTOR (mTORC1) signaling in hippocampal organotypic slices. Thus our data suggests that there is a positive feed back loop between mTORC1 and leptin, with both of mTORC1 and leptin reinforcing the expression or activation of each other. Aβ, by interrupting this loop, can inhibit mTORC1 activation and reduce leptin expression.
Leptin treatment was able to rescue the inhibition induced by Aβ on mTORC1 activation and signaling. mTOR is activated by phosphorylation at Ser2481 and Ser2448 residues. It is important to note that mTOR is autophosphorylated at Ser2481 and exhibits spontaneous intrinsic kinase activity under the activation of AkT (Brown et al. 1995; Peterson et al. 2000). AkT can positively regulate mTOR activation directly through phosphorylation at Ser2448. We demonstrate in our study that leptin activates Akt by increasing phosphorylation at Ser473, thus potentially activating mTOR by increasing phosphorylation at Ser2448. mTORC1 activity can be assessed by measuring the phosphorylation of its downstream effector p70S6K1. We have found that while leptin increased basal levels of p-Thr389 p70S6K1, Aβ decreases levels of p-Thr389 p70S6K1. Furthermore, leptin completely reversed the decrease in p-Thr389 p70S6K1 levels induced by Aβ. Rapamycin did not affect p-Ser2448 mTOR levels but dramatically reduced p-Thr389p70S6K1 levels.
Several studies demonstrated the inhibitory effect of Aβ on long term potentiation (LTP) and synaptic plasticity (Freir et al. 2001; for Review see Selkoe 2008). The activation of the PI3K/AkT pathway is necessary for the expression of LTP in the dentate gyrus (Kelly & Lynch. 2000) and the CA1 region of the hippocampus (Raymond et al. 2002; Karpova et al. 2006). Furthermore, there is unequivocal evidence that mTORC1, which is downstream of AkT in the AkT/mTORC1 pathway, is also a requisite for the maintenance of synaptic plasticity in the CA1 region of the hippocampus (Tang et al. 2002) and consolidation of long-term memory (Tischmeyer et al. 2003). In this study we demonstrate that treatment with Aβ attenuates the activation of both AkT and mTORC1. Our study thus provides a valuable insight into the putative mechanisms involved in the Aβ-induced perturbation of synaptic plasticity. Interestingly, leptin has been shown to influence synaptic plasticity and enhance LTP in the dentate gyrus of rats (Wayner et al. 2004). Leptin also improves memory processing and retention when administered directly into the CA1 region in mice (Farr et al. 2006). Treatment of acute hippocampal slices with leptin results in the conversion of short-term potentiation (STP) to LTP by enhancing Ca2+ influx through NMDA receptors (Shanley et al. 2001). We demonstrate in our study that treatment of organotypic slices with leptin results in the activation of AkT and mTORC1, two kinases critically involved in LTP formation and synaptic plasticity.
It is suggested that Aβ accumulation is an upstream event to tau phosphorylation as Aβ deposits in plaques precede tangle formation (for Review, see Hardy and Selkoe 2002) and Aβ triggers tau hyperphosphorylation in vitro (Takashima et al. 1998). We have also previously demonstrated that administration of Aβ into rabbit brains triggers hyperphosphorylation of tau (Ghribi et al. 2003a; Ghribi et al. 2003b). Work from our laboratory in organotypic slices from rabbit hippocampus recently demonstrated that leptin decreases both basal and 27-hydroxycholesterol-induced phosphorylated tau and Aβ levels (Marwarha et al. 2010). In this study we demonstrate that fAβ42 induces phosphorylation of tau at residues Ser202and Thr205 as well as Ser396 and Ser404 while soluble Aβ42 peptide evokes phosphorylation of tau at Ser202, Thr205 but not Ser396 or Ser404. Treatment with leptin reverses the soluble and fAβ42-induced phosphorylation of tau. Remarkably, treatment with the mTORC1 inhibitor rapamycin resulted in an increase in tau phosphorylation at residues Ser202, Thr205, Ser396, and Ser404. Treatment with leptin alleviated the increase in phosphorylation of tau induced by rapamycin at Ser202 and Thr205 residues not at Ser396 and Ser404 residues.
GSK-3β is a kinase implicated in the hyperphosphorylation of tau (Hanger et al. 1992; Mandelkow et al. 1992; Lovestone et al. 1994; Brownlees et al. 1997; Lucas et al. 2001; Leroy et al. 2007; Rankin et al. 2007). Increase in the phosphorylation of GSK-3β at Tyr216 residue enhances tau hyperphosphorylation and increase in the phosphorylation of GSK-3β at Ser9 residue prevents tau hyperphosphorylation. Many signaling pathways contribute to the phosphorylation of GSK-3β at Ser9 including Akt activation (Sutherland et al. 1993; Cross et al. 1995). In this study, Aβ significantly lowered levels of p-Ser473 AkT as well as p-Ser9 GSK3β and increased p-Tyr216 GSK-3β. Treatment with leptin completely reversed the decrease in p- Ser473 Akt and p-Ser9 GSK-3β induced by Aβ, suggesting that inhibition of GSK-3β underlies the mechanism by which leptin reduces tau phosphorylation. Our results are in accordance with recent data showing that leptin prevents tau phosphorylation in neuronal cells through GSK-3β inhibition (Greco et al. 2009a). Leptin treatment alone also increased basal levels of p- Ser473 Akt and p-Ser9 GSK-3β. Treatment with rapamycin moderately, but not significantly, increased p- Ser473 Akt and decreased p-Ser9 GSK-3β levels and did not alter p- Tyr216 GSK-3β levels, suggesting that increased tau phosphorylation by rapamycin is primarily independent of Akt and GSK-3β. Previous studies suggest that tau phosphorylation can be regulated by protein phosphatase 2A (PP2A) (Liu et al. 2005; Qian et al. 2010), cyclin-dependent kinase 5 (Cdk5) (Patrick et al. 1999), and c-Jun N-terminal kinase (JNK) (Zhu et al. 2001). Further studies are warranted to determine the involvement of these proteins in mTOR-mediated tau phosphorylation.
In summary, our study is the first to show that Aβ42 reduces leptin expression in the rabbit hippocampus. Soluble and fAβ42 appear to exert similar effects on leptin expression. Inhibition of leptin expression by Aβ results in the inactivation of AkT and the activation of GSK-3β, potentially increasing tau phosphorylation. Leptin treatment restores the AkT signaling and inactivates GSK-3β, thus preventing the Aβ-induced tau hyperphosphorylation. Furthermore, leptin activates mTORC1 signaling and also rescues it from the inhibition imposed by Aβ. mTORC1 can also regulate tau phosphorylation independently of AkT and GSK-3β pathway. Our results suggest that maintenance of an activated AkT/mTORC1 signaling pathway can protect against Aβ deleterious effects. A schematic illustration is provided to summarize our findings and hypotheses (Fig 8).
Figure 8.

Aβ attenuates mTORC1 signaling by reducing the phosphorylation of mTOR (1), thus causing a decrease in the expression of leptin (2). Reduced expression levels of leptin are accompanied by a reduction in phosphorylation of leptin receptor (p-Tyr1138 ObRb) (3). Aβ also increases SOCS-3 expression levels (4), an effect that may also cause a reduction in levels of p-Tyr1138 ObRb (5). Reduced levels p-Tyr1138 ObRb leads to decreased activation of AkT (6), subsequently resulting in the activation of GSK-3β (7). Activation of GSK-3β results in increased phosphorylation of tau (p-tau) (8). Attenuated AkT activation can also reduce mTORC1 activation (9), an effect that may further reduce leptin expression (2). It is also possible that Aβ regulates leptin signaling via other mechanisms independent of mTORC1 and SOCS-3.
Acknowledgments
This work was supported by a Grant from the NIH (NIEHS, R01ES014826).
Footnotes
All authors report no biomedical financial interests or potential conflicts of interest.
References
- Bjorbaek C, El-Haschimi K, Frantz JD, Flier JS. The role of SOCS-3 in leptin signaling and leptin resistance. J Biol Chem. 1999;274:30059–30065. doi: 10.1074/jbc.274.42.30059. [DOI] [PubMed] [Google Scholar]
- Brown EJ, Beal PA, Keith CT, Chen J, Shin TB, Schreiber SL. Control of p70 s6 kinase by kinase activity of FRAP in vivo. Nature. 1995;377:441–446. doi: 10.1038/377441a0. [DOI] [PubMed] [Google Scholar]
- Brownlees J, Irving NG, Brion JP, Gibb BJ, Wagner U, Woodgett J, Miller CC. Tau phosphorylation in transgenic mice expressing glycogen synthase kinase-3beta transgenes. Neuroreport. 1997;8:3251–3255. doi: 10.1097/00001756-199710200-00013. [DOI] [PubMed] [Google Scholar]
- Chakrabarti P, Anno T, Manning BD, Luo Z, Kandror KV. The mammalian target of rapamycin complex 1 regulates leptin biosynthesis in adipocytes at the level of translation: the role of the 5′-untranslated region in the expression of leptin messenger ribonucleic acid. Mol Endocrinol. 2008;22:2260–2267. doi: 10.1210/me.2008-0148. [DOI] [PMC free article] [PubMed] [Google Scholar]
- Chen TJ, Wang DC, Chen SS. Amyloid-beta interrupts the PI3K-Akt-mTOR signaling pathway that could be involved in brain-derived neurotrophic factor-induced Arc expression in rat cortical neurons. J Neurosci Res. 2009;87:2297–2307. doi: 10.1002/jnr.22057. [DOI] [PubMed] [Google Scholar]
- Cho HJ, Park J, Lee HW, Lee YS, Kim JB. Regulation of adipocyte differentiation and insulin action with rapamycin. Biochem Biophys Res Commun. 2004;321:942–948. doi: 10.1016/j.bbrc.2004.07.050. [DOI] [PubMed] [Google Scholar]
- Cota D, Proulx K, Smith KA, Kozma SC, Thomas G, Woods SC, Seeley RJ. Hypothalamic mTOR signaling regulates food intake. Science. 2006;312:927–930. doi: 10.1126/science.1124147. [DOI] [PubMed] [Google Scholar]
- Cross DA, Alessi DR, Cohen P, Andjelkovich M, Hemmings BA. Inhibition of glycogen synthase kinase-3 by insulin mediated by protein kinase B. Nature. 1995;378:785–789. doi: 10.1038/378785a0. [DOI] [PubMed] [Google Scholar]
- Dajani R, Fraser E, Roe SM, Young N, Good V, Dale TC, Pearl LH. Crystal structure of glycogen synthase kinase 3 beta: structural basis for phosphate-primed substrate specificity and autoinhibition. Cell. 2001;105:721–732. doi: 10.1016/s0092-8674(01)00374-9. [DOI] [PubMed] [Google Scholar]
- Farr SA, Banks WA, Morley JE. Effects of leptin on memory processing. Peptides. 2006;27:1420–1425. doi: 10.1016/j.peptides.2005.10.006. [DOI] [PubMed] [Google Scholar]
- Fewlass DC, Noboa K, Pi-Sunyer FX, Johnston JM, Yan SD, Tezapsidis N. Obesity-related leptin regulates Alzheimer’s Abeta. FASEB J. 2004;18:1870–1878. doi: 10.1096/fj.04-2572com. [DOI] [PubMed] [Google Scholar]
- Freir DB, Holscher C, Herron CE. Blockade of long-term potentiation by beta-amyloid peptides in the CA1 region of the rat hippocampus in vivo. J Neurophysiol. 2001;85:708–713. doi: 10.1152/jn.2001.85.2.708. [DOI] [PubMed] [Google Scholar]
- Ghribi O, Herman MM, Savory J. Lithium inhibits Abeta-induced stress in endoplasmic reticulum of rabbit hippocampus but does not prevent oxidative damage and tau phosphorylation. J Neurosci Res. 2003a;71:853–862. doi: 10.1002/jnr.10511. [DOI] [PubMed] [Google Scholar]
- Ghribi O, Prammonjago P, Herman MM, Spaulding NK, Savory J. Abeta(1-42)-induced JNK and ERK activation in rabbit hippocampus is differentially regulated by lithium but is not involved in the phosphorylation of tau. Brain Res Mol Brain Res. 2003b;119:201–206. doi: 10.1016/j.molbrainres.2003.09.001. [DOI] [PubMed] [Google Scholar]
- Graur D, Duret L, Gouy M. Phylogenetic position of the order Lagomorpha (rabbits, hares and allies) Nature. 1996;379:333–335. doi: 10.1038/379333a0. [DOI] [PubMed] [Google Scholar]
- Greco SJ, Bryan KJ, Sarkar S, Zhu X, Smith MA, Ashford JW, Johnston JM, Tezapsidis N, Casadesus G. Chronic Leptin Supplementation Ameliorates Pathology and Improves Cognitive Performance in a Transgenic Mouse Model of Alzheimer’s Disease. J Alzheimers Dis. 2009a doi: 10.3233/JAD-2009-1308. [DOI] [PubMed] [Google Scholar]
- Greco SJ, Sarkar S, Casadesus G, Zhu X, Smith MA, Ashford JW, Johnston JM, Tezapsidis N. Leptin inhibits glycogen synthase kinase-3beta to prevent tau phosphorylation in neuronal cells. Neurosci Lett. 2009b;455:191–194. doi: 10.1016/j.neulet.2009.03.066. [DOI] [PMC free article] [PubMed] [Google Scholar]
- Greco SJ, Sarkar S, Johnston JM, Tezapsidis N. Leptin regulates tau phosphorylation and amyloid through AMPK in neuronal cells. Biochem Biophys Res Commun. 2009c;380:98–104. doi: 10.1016/j.bbrc.2009.01.041. [DOI] [PMC free article] [PubMed] [Google Scholar]
- Greco SJ, Sarkar S, Johnston JM, Zhu X, Su B, Casadesus G, Ashford JW, Smith MA, Tezapsidis N. Leptin reduces Alzheimer’s disease-related tau phosphorylation in neuronal cells. Biochem Biophys Res Commun. 2008;376:536–541. doi: 10.1016/j.bbrc.2008.09.026. [DOI] [PMC free article] [PubMed] [Google Scholar]
- Guo Z, Jiang H, Xu X, Duan W, Mattson MP. Leptin-mediated cell survival signaling in hippocampal neurons mediated by JAK STAT3 and mitochondrial stabilization. J Biol Chem. 2008;283:1754–1763. doi: 10.1074/jbc.M703753200. [DOI] [PubMed] [Google Scholar]
- Hanger DP, Hughes K, Woodgett JR, Brion JP, Anderton BH. Glycogen synthase kinase-3 induces Alzheimer’s disease-like phosphorylation of tau: generation of paired helical filament epitopes and neuronal localisation of the kinase. Neurosci Lett. 1992;147:58–62. doi: 10.1016/0304-3940(92)90774-2. [DOI] [PubMed] [Google Scholar]
- Hara K, Maruki Y, Long X, Yoshino K, Oshiro N, Hidayat S, Tokunaga C, Avruch J, Yonezawa K. Raptor, a binding partner of target of rapamycin (TOR), mediates TOR action. Cell. 2002;110:177–189. doi: 10.1016/s0092-8674(02)00833-4. [DOI] [PubMed] [Google Scholar]
- Hardy J, Selkoe DJ. The amyloid hypothesis of Alzheimer’s disease: progress and problems on the road to therapeutics. Science. 2002;297:353–356. doi: 10.1126/science.1072994. [DOI] [PubMed] [Google Scholar]
- Jacinto E, Loewith R, Schmidt A, Lin S, Ruegg MA, Hall A, Hall MN. Mammalian TOR complex 2 controls the actin cytoskeleton and is rapamycin insensitive. Nat Cell Biol. 2004;6:1122–1128. doi: 10.1038/ncb1183. [DOI] [PubMed] [Google Scholar]
- Johnstone EM, Chaney MO, Norris FH, Pascual R, Little SP. Conservation of the sequence of the Alzheimer’s disease amyloid peptide in dog, polar bear and five other mammals by cross-species polymerase chain reaction analysis. Brain Res Mol Brain Res. 1991;10:299–305. doi: 10.1016/0169-328x(91)90088-f. [DOI] [PubMed] [Google Scholar]
- Karpova A, Sanna PP, Behnisch T. Involvement of multiple phosphatidylinositol 3-kinase-dependent pathways in the persistence of late-phase long term potentiation expression. Neuroscience. 2006;137:833–841. doi: 10.1016/j.neuroscience.2005.10.012. [DOI] [PubMed] [Google Scholar]
- Kelly A, Lynch MA. Long-term potentiation in dentate gyrus of the rat is inhibited by the phosphoinositide 3-kinase inhibitor, wortmannin. Neuropharmacology. 2000;39:643–651. doi: 10.1016/s0028-3908(99)00169-0. [DOI] [PubMed] [Google Scholar]
- Kim DH, Sarbassov DD, Ali SM, King JE, Latek RR, Erdjument-Bromage H, Tempst P, Sabatini DM. mTOR interacts with raptor to form a nutrient-sensitive complex that signals to the cell growth machinery. Cell. 2002;110:163–175. doi: 10.1016/s0092-8674(02)00808-5. [DOI] [PubMed] [Google Scholar]
- Lafay-Chebassier C, Paccalin M, Page G, Barc-Pain S, Perault-Pochat MC, Gil R, Pradier L, Hugon J. mTOR/p70S6k signalling alteration by Abeta exposure as well as in APP-PS1 transgenic models and in patients with Alzheimer’s disease. J Neurochem. 2005;94:215–225. doi: 10.1111/j.1471-4159.2005.03187.x. [DOI] [PubMed] [Google Scholar]
- Lafay-Chebassier C, Perault-Pochat MC, Page G, Rioux BA, Damjanac M, Pain S, Houeto JL, Gil R, Hugon J. The immunosuppressant rapamycin exacerbates neurotoxicity of Abeta peptide. J Neurosci Res. 2006;84:1323–1334. doi: 10.1002/jnr.21039. [DOI] [PubMed] [Google Scholar]
- Leroy K, Yilmaz Z, Brion JP. Increased level of active GSK-3beta in Alzheimer’s disease and accumulation in argyrophilic grains and in neurones at different stages of neurofibrillary degeneration. Neuropathol Appl Neurobiol. 2007;33:43–55. doi: 10.1111/j.1365-2990.2006.00795.x. [DOI] [PubMed] [Google Scholar]
- Li HY, Wang LL, Yeh RS. Leptin immunoreactivity in the central nervous system in normal and diabetic rats. Neuroreport. 1999;10:437–442. doi: 10.1097/00001756-199902050-00042. [DOI] [PubMed] [Google Scholar]
- Lieb W, Beiser AS, Vasan RS, Tan ZS, Au R, Harris TB, Roubenoff R, Auerbach S, DeCarli C, Wolf PA, Seshadri S. Association of plasma leptin levels with incident Alzheimer disease and MRI measures of brain aging. JAMA. 2009;302:2565–2572. doi: 10.1001/jama.2009.1836. [DOI] [PMC free article] [PubMed] [Google Scholar]
- Liu F, Grundke-Iqbal I, Iqbal K, Gong CX. Contributions of protein phosphatases PP1, PP2A, PP2B and PP5 to the regulation of tau phosphorylation. Eur J Neurosci. 2005;22:1942–1950. doi: 10.1111/j.1460-9568.2005.04391.x. [DOI] [PubMed] [Google Scholar]
- Loewith R, Jacinto E, Wullschleger S, Lorberg A, Crespo JL, Bonenfant D, Oppliger W, Jenoe P, Hall MN. Two TOR complexes, only one of which is rapamycin sensitive, have distinct roles in cell growth control. Mol Cell. 2002;10:457–468. doi: 10.1016/s1097-2765(02)00636-6. [DOI] [PubMed] [Google Scholar]
- Lovestone S, Reynolds CH, Latimer D, Davis DR, Anderton BH, Gallo JM, Hanger D, Mulot S, Marquardt B, Stabel S. Alzheimer’s disease-like phosphorylation of the microtubule-associated protein tau by glycogen synthase kinase-3 in transfected mammalian cells. Curr Biol. 1994;4:1077–1086. doi: 10.1016/s0960-9822(00)00246-3. [DOI] [PubMed] [Google Scholar]
- Lucas JJ, Hernandez F, Gomez-Ramos P, Moran MA, Hen R, Avila J. Decreased nuclear beta-catenin, tau hyperphosphorylation and neurodegeneration in GSK-3beta conditional transgenic mice. EMBO J. 2001;20:27–39. doi: 10.1093/emboj/20.1.27. [DOI] [PMC free article] [PubMed] [Google Scholar]
- Ludwig M, Klein HH, Diedrich K, Ortmann O. Serum leptin concentrations throughout the menstrual cycle. Arch Gynecol Obstet. 2000;263:99–101. doi: 10.1007/s004040050004. [DOI] [PubMed] [Google Scholar]
- Magrane J, Rosen KM, Smith RC, Walsh K, Gouras GK, Querfurth HW. Intraneuronal beta-amyloid expression downregulates the Akt survival pathway and blunts the stress response. J Neurosci. 2005;25:10960–10969. doi: 10.1523/JNEUROSCI.1723-05.2005. [DOI] [PMC free article] [PubMed] [Google Scholar]
- Mandelkow EM, Drewes G, Biernat J, Gustke N, Van LJ, Vandenheede JR, Mandelkow E. Glycogen synthase kinase-3 and the Alzheimer-like state of microtubule-associated protein tau. FEBS Lett. 1992;314:315–321. doi: 10.1016/0014-5793(92)81496-9. [DOI] [PubMed] [Google Scholar]
- Martin KA, Blenis J. Coordinate regulation of translation by the PI 3-kinase and mTOR pathways. Adv Cancer Res. 2002;86:1–39. doi: 10.1016/s0065-230x(02)86001-8. [DOI] [PubMed] [Google Scholar]
- Marwarha G, Dasari B, Prasanthi JR, Schommer J, Ghribi O. Leptin reduces the accumulation of Abeta and phosphorylated tau induced by 27-hydroxycholesterol in rabbit organotypic slices. J Alzheimers Dis. 2010;19:1007–1019. doi: 10.3233/JAD-2010-1298. [DOI] [PMC free article] [PubMed] [Google Scholar] [Retracted]
- Maya-Monteiro CM, Almeida PE, D’Avila H, Martins AS, Rezende AP, Castro-Faria-Neto H, Bozza PT. Leptin induces macrophage lipid body formation by a phosphatidylinositol 3-kinase- and mammalian target of rapamycin-dependent mechanism. J Biol Chem. 2008;283:2203–2210. doi: 10.1074/jbc.M706706200. [DOI] [PubMed] [Google Scholar]
- Nassif M, Hoppe J, Santin K, Frozza R, Zamin LL, Simao F, Horn AP, Salbego C. Beta-amyloid peptide toxicity in organotypic hippocampal slice culture involves Akt/PKB, GSK-3beta, and PTEN. Neurochem Int. 2007;50:229–235. doi: 10.1016/j.neuint.2006.08.008. [DOI] [PubMed] [Google Scholar]
- Patrick GN, Zukerberg L, Nikolic M, de la MS, Dikkes P, Tsai LH. Conversion of p35 to p25 deregulates Cdk5 activity and promotes neurodegeneration. Nature. 1999;402:615–622. doi: 10.1038/45159. [DOI] [PubMed] [Google Scholar]
- Peterson RT, Beal PA, Comb MJ, Schreiber SL. FKBP12-rapamycin-associated protein (FRAP) autophosphorylates at serine 2481 under translationally repressive conditions. J Biol Chem. 2000;275:7416–7423. doi: 10.1074/jbc.275.10.7416. [DOI] [PubMed] [Google Scholar]
- Power DA, Noel J, Collins R, O’Neill D. Circulating leptin levels and weight loss in Alzheimer’s disease patients. Dement Geriatr Cogn Disord. 2001;12:167–170. doi: 10.1159/000051252. [DOI] [PubMed] [Google Scholar]
- Qian W, Shi J, Yin X, Iqbal K, Grundke-Iqbal I, Gong CX, Liu F. PP2A regulates tau phosphorylation directly and also indirectly via activating GSK-3beta. J Alzheimers Dis. 2010;19:1221–1229. doi: 10.3233/JAD-2010-1317. [DOI] [PubMed] [Google Scholar]
- Rankin CA, Sun Q, Gamblin TC. Tau phosphorylation by GSK-3beta promotes tangle-like filament morphology. Mol Neurodegener. 2007;2:12. doi: 10.1186/1750-1326-2-12. [DOI] [PMC free article] [PubMed] [Google Scholar]
- Raymond CR, Redman SJ, Crouch MF. The phosphoinositide 3-kinase and p70 S6 kinase regulate long-term potentiation in hippocampal neurons. Neuroscience. 2002;109:531–536. doi: 10.1016/s0306-4522(01)00500-0. [DOI] [PubMed] [Google Scholar]
- Riad-Gabriel MG, Jinagouda SD, Sharma A, Boyadjian R, Saad MF. Changes in plasma leptin during the menstrual cycle. Eur J Endocrinol. 1998;139:528–531. doi: 10.1530/eje.0.1390528. [DOI] [PubMed] [Google Scholar]
- Roh C, Han J, Tzatsos A, Kandror KV. Nutrient-sensing mTOR-mediated pathway regulates leptin production in isolated rat adipocytes. Am J Physiol Endocrinol Metab. 2003;284:E322–E330. doi: 10.1152/ajpendo.00230.2002. [DOI] [PubMed] [Google Scholar]
- Sarbassov DD, Ali SM, Kim DH, Guertin DA, Latek RR, Erdjument-Bromage H, Tempst P, Sabatini DM. Rictor, a novel binding partner of mTOR, defines a rapamycin-insensitive and raptor-independent pathway that regulates the cytoskeleton. Curr Biol. 2004;14:1296–1302. doi: 10.1016/j.cub.2004.06.054. [DOI] [PubMed] [Google Scholar]
- Sarbassov DD, Ali SM, Sabatini DM. Growing roles for the mTOR pathway. Curr Opin Cell Biol. 2005a;17:596–603. doi: 10.1016/j.ceb.2005.09.009. [DOI] [PubMed] [Google Scholar]
- Sarbassov DD, Guertin DA, Ali SM, Sabatini DM. Phosphorylation and regulation of Akt/PKB by the rictor-mTOR complex. Science. 2005b;307:1098–1101. doi: 10.1126/science.1106148. [DOI] [PubMed] [Google Scholar]
- Selkoe DJ. Soluble oligomers of the amyloid beta-protein impair synaptic plasticity and behavior. Behav Brain Res. 2008;192:106–113. doi: 10.1016/j.bbr.2008.02.016. [DOI] [PMC free article] [PubMed] [Google Scholar]
- Shanley LJ, Irving AJ, Harvey J. Leptin enhances NMDA receptor function and modulates hippocampal synaptic plasticity. J Neurosci. 2001;21:RC186. doi: 10.1523/JNEUROSCI.21-24-j0001.2001. [DOI] [PMC free article] [PubMed] [Google Scholar]
- Sharma S, Prasanthi RPJ, Schommer E, Feist G, Ghribi O. Hypercholesterolemia-induced Abeta accumulation in rabbit brain is associated with alteration in IGF-1 signaling. Neurobiol Dis. 2008;32:426–432. doi: 10.1016/j.nbd.2008.08.002. [DOI] [PMC free article] [PubMed] [Google Scholar] [Retracted]
- Sperber BR, Leight S, Goedert M, Lee VM. Glycogen synthase kinase-3 beta phosphorylates tau protein at multiple sites in intact cells. Neurosci Lett. 1995;197:149–153. doi: 10.1016/0304-3940(95)11902-9. [DOI] [PubMed] [Google Scholar]
- Sutherland C, Leighton IA, Cohen P. Inactivation of glycogen synthase kinase-3 beta by phosphorylation: new kinase connections in insulin and growth-factor signalling. Biochem J. 1993;296 (Pt 1):15–19. doi: 10.1042/bj2960015. [DOI] [PMC free article] [PubMed] [Google Scholar]
- Takashima A, Honda T, Yasutake K, Michel G, Murayama O, Murayama M, Ishiguro K, Yamaguchi H. Activation of tau protein kinase I/glycogen synthase kinase-3beta by amyloid beta peptide (25-35) enhances phosphorylation of tau in hippocampal neurons. Neurosci Res. 1998;31:317–323. doi: 10.1016/s0168-0102(98)00061-3. [DOI] [PubMed] [Google Scholar]
- Tanaka M, Nakaya S, Kumai T, Watanabe M, Tateishi T, Shimizu H, Kobayashi S. Effects of estrogen on serum leptin levels and leptin mRNA expression in adipose tissue in rats. Horm Res. 2001;56:98–104. doi: 10.1159/000048099. [DOI] [PubMed] [Google Scholar]
- Tang SJ, Reis G, Kang H, Gingras AC, Sonenberg N, Schuman EM. A rapamycin-sensitive signaling pathway contributes to long-term synaptic plasticity in the hippocampus. Proc Natl Acad Sci U S A. 2002;99:467–472. doi: 10.1073/pnas.012605299. [DOI] [PMC free article] [PubMed] [Google Scholar]
- Tezapsidis N, Johnston JM, Smith MA, Ashford JW, Casadesus G, Robakis NK, Wolozin B, Perry G, Zhu X, Greco SJ, Sarkar S. Leptin: a novel therapeutic strategy for Alzheimer’s disease. J Alzheimers Dis. 2009;16:731–740. doi: 10.3233/JAD-2009-1021. [DOI] [PMC free article] [PubMed] [Google Scholar]
- Tischmeyer W, Schicknick H, Kraus M, Seidenbecher CI, Staak S, Scheich H, Gundelfinger ED. Rapamycin-sensitive signalling in long-term consolidation of auditory cortex-dependent memory. Eur J Neurosci. 2003;18:942–950. doi: 10.1046/j.1460-9568.2003.02820.x. [DOI] [PubMed] [Google Scholar]
- Ur E, Wilkinson DA, Morash BA, Wilkinson M. Leptin immunoreactivity is localized to neurons in rat brain. Neuroendocrinology. 2002;75:264–272. doi: 10.1159/000054718. [DOI] [PubMed] [Google Scholar]
- Wayner MJ, Armstrong DL, Phelix CF, Oomura Y. Orexin-A (Hypocretin-1) and leptin enhance LTP in the dentate gyrus of rats in vivo. Peptides. 2004;25:991–996. doi: 10.1016/j.peptides.2004.03.018. [DOI] [PubMed] [Google Scholar]
- Zhu X, Raina AK, Rottkamp CA, Aliev G, Perry G, Boux H, Smith MA. Activation and redistribution of c-jun N-terminal kinase/stress activated protein kinase in degenerating neurons in Alzheimer’s disease. J Neurochem. 2001;76:435–441. doi: 10.1046/j.1471-4159.2001.00046.x. [DOI] [PubMed] [Google Scholar]