Abstract
Bone quality is significantly correlated with the inhomogeneous distribution of material and ultrastructural properties (e.g., modulus and mineralization) of the tissue. Current techniques for quantifying inhomogeneity consist of descriptive statistics such as mean, standard deviation and coefficient of variation. However, these parameters do not describe the spatial variations of bone properties. The objective of this study was to develop a novel statistical method to characterize and quantitatively describe the spatial variation of bone properties at ultrastructural levels. To do so, a random field defined by an exponential covariance function was used to present the spatial uncertainty of elastic modulus by delineating the correlation of the modulus at different locations in bone lamellae. The correlation length, a characteristic parameter of the covariance function, was employed to estimate the fluctuation of the elastic modulus in the random field. Using this approach, two distribution maps of the elastic modulus within bone lamellae were generated using simulation and compared with those obtained experimentally by a combination of atomic force microscopy and nanoindentation techniques. The simulation-generated maps of elastic modulus were in close agreement with the experimental ones, thus validating the random field approach in defining the inhomogeneity of elastic modulus in lamellae of bone. Indeed, generation of such random fields will facilitate multi-scale modeling of bone in more pragmatic details.
Keywords: Inhomogeneity, nanoindentation, random field, correlation length, spatial variation
1. INTRODUCTION
Material properties of bone are inhomogeneous in nature at multiple length scales. At the macroscopic level, material properties of bone are significantly different at various anatomic locations [1, 2]. Microscopically, marked variations of elastic modulus in bone lamellae have been observed in osteons by nanoindentation testing [3, 4]. In addition, inhomogeneity of mineralization in bone was detected by quantitative backscattering imaging and described by bone mineral density distribution [5, 6]. At the nanoscopic scale, variations in the elastic modulus of individual collagen fibrils have also been reported in the literature [7]. It has been well documented that bone inhomogeneity may give rise to the increased bone fragility in terms of energy dissipation at nanoscopic scales [7] and the toughness of bulk bone specimens [6]. Thus, quantification of inhomogeneity becomes necessary in both analytical and experimental research of bone.
Current techniques to quantify the inhomogeneous properties of bone include basic and descriptive statistics such as mean (μ), standard deviation (σ) and coefficient of variation (COV). However, these parameters only give an overall estimate of variations, but not the spatial distribution of tissue properties in bone. The recent advance of nanotechnology has made it possible to experimentally map the distribution of elastic modulus within a single lamella of bone [7]. How to quantitatively analyze and describe the spatial distributions of these properties still remains unsolved. To address this issue, a novel statistical method based on the random field theory was proposed and validated in this study to quantitatively characterize spatial variations of tissue properties of bone at nanoscopic scales.
2. MATERIALS & METHODS
2.1 Maps of nanoindentation modulus
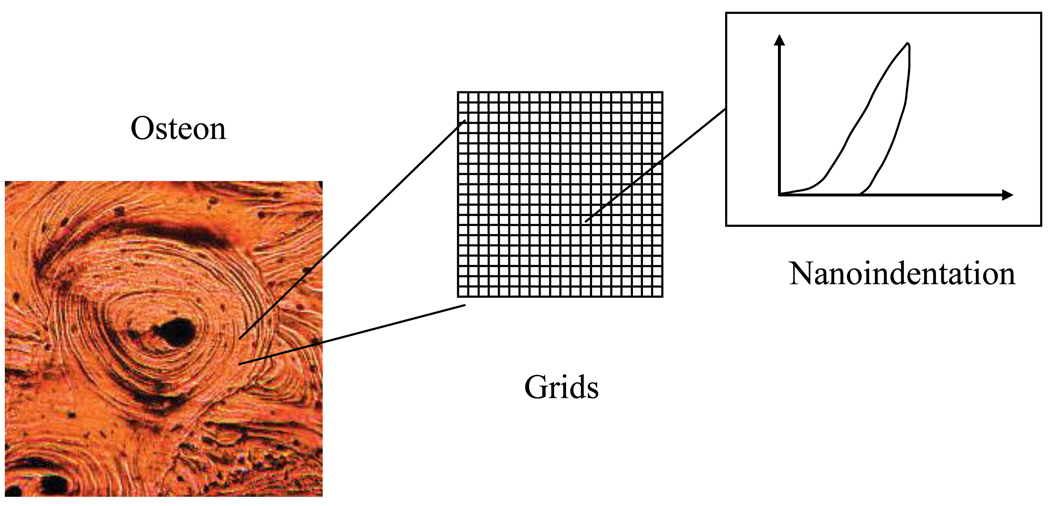
Nanoscopic inhomogeneity of bovine cortical bone samples was investigated in this study by assessing the spatial distribution of the elastic modulus of lamellae using atomic force microscopy (AFM)-based nanoindentation techniques [7]. In brief, a square region of 2µm×2µm in a lamella was selected randomly within an osteon (Figure 1). The region of interest was divided in rectangular grids by 100nm. Nanoindentation measurements in the grids were carried out at a peak indentation force of 5µN, with the indentation depth being around 50nm.
Figure 1.
Schematic of nanoindentation measurements of modulus in bone.
Two maps of nanoindentation modulus were obtained on the cross-section perpendicular to the longitudinal axis of two bovine cortical bone samples and used to develop the statistical model of inhomogeneity in this study. The elastic modulus was calculated from the unloading curve of nanoindentation testing (Figure 1) using the Oliver-Pharr method [8].
2.2 Assessment of inhomogeneity using variograms
In this study, the spatial variation was evaluated using a so-called variogram, which could be expressed in two parameters: semi-variance and lag [9, 10]. The semi-variance (γ) was defined as the half of the expected squared difference between any paired data values {z(x), z(x+h)}:
| (1) |
where z is a random function of the indentation modulus of bone that varies continuously in space; x denotes the spatial coordinates of locations; and h, also known as lag, is a vector representing the Euclidean distance and direction between any two data locations. In this paper, the terms, lag and separation distance, are interchangeable.
The experimental variogram for the nanoindentation modulus maps was computed as an average of semi-variance values at different locations that have the same value of lag:
| (2) |
where m(h) is the number of data pairs {z(xi), z(xi+h)} for observations separated by h.
2.3 Correlation length
To fit the variogram obtained from the experimental data, a mathematical model must satisfy the following conditions: an intercept on the ordinate, a monotonically increasing section, and conditional negative semi-definite [9]. Among the simple functions (i.e., exponential, Gaussian, and spherical models) that meet these conditions, the exponential model was selected in this study because it fitted well with the experimentally obtained maps of nanoindentation modulus and had the highest R-squared value.
| (3) |
where γ(h) is the semi-variance as a function of lag (h), L is referred to as the correlation length, c0 is the nugget variance. In theory, c0 should be naught. Due to the discrete data acquisition during the experiment, however, it may not be zero. c is the difference between the nugget variance and the converging value of γ(h) when h approaches infinity, which is actually the value of variance of the map.
The correlation length of experimental modulus maps can be mathematically determined by fitting the exponential model to the observed variogram using the least square estimation or the maximum likelihood estimate [9]. In this study, the ordinary least square estimation was implemented in MATLAB (MathWorks, Natrick, MA) with the function “lsqcurvefit”. In brief, the parameters in the exponential model (L, c0, and c) can be estimated by minimizing the residual sum of squares for semi-variance
| (4) |
where τ represents the vector of parameter estimates [L, c0, c]; γ̑k represents the vector of semi-variance estimates, each estimate being denoted by γ̑(hj); k is the size of the semi-variance vector; The quantity γ(hj, τ) is the jth semi-variance expected from the fitted model and depends on the parameter estimates.
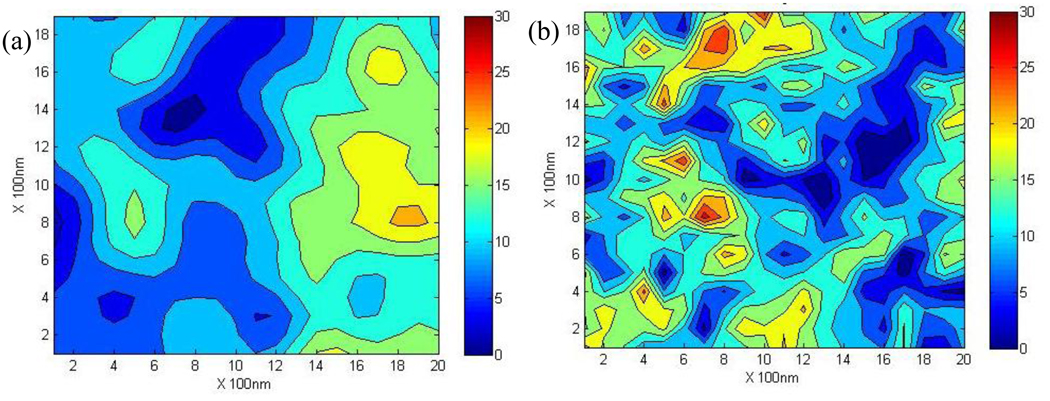
The correlation length is an important parameter to characterize spatial variations of a random field. Relatively, a large correlation length (L=500nm, Figure 2a) implies a smooth variation, whereas a small correlation length (L=100nm, Figure 2b) corresponds to rapid changes in the property over the space domain. The mean, standard deviation, c0 and c were the same between these two maps and only the correlation length was different.
Figure 2.
Visualization of maps with different correlation lengths. (a) L =500 nm; (b) L=100 nm.
2.4 Random fields
A random field is a statistical manifestation that represents the continuous random distribution of properties across the space. For example, each observed map of nanoindentation modulus actually corresponds to one realization of the random field. In fact, random fields are represented by random variables that are correlated with each other through the covariance function. To avoid intensive computation induced by the large number of independent random variables, the covariance matrix from the exponential model was decomposed in this study through an eigenvalue analysis known as the Karhunen-Loeve (KL) transformation with a cutoff value of 90% [11]. By doing so, only a limited number of random variables would be needed for realization of a random field. Furthermore, if a model is determined for the random field, other realizations could be readily generated using the covariance function [12].
3. RESULTS
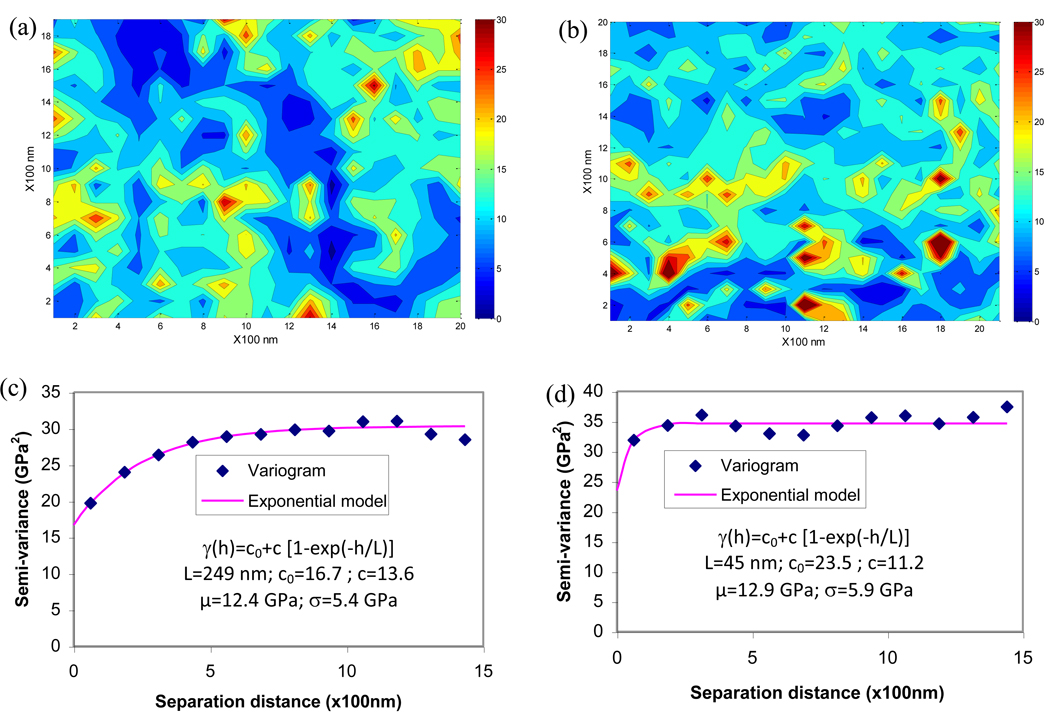
The spatial variation of experimentally obtained maps of nanoindentation modulus was shown in the form of variograms for the two maps used in this study (Figure 3). Contour plots of the modulus maps exhibited the spatial variation of elastic modulus in lamellae at nanoscopic scales (Figure 3a and Figure 3b). In the two maps, one exhibited a smoother variation of elastic modulus (Figure 3a) than the other (Figure 3b). The semi-variance of nanoindentation modulus increased with increasing separation distance and reached a plateau, also known as the sill of the variogram (Figure 3c and Figure 3d). It suggested that as separating distance increased, the modulus of bone became more dissimilar on average. The semi-variance of the nanoindentation modulus from one map (Figure 3c) slowly reached the plateau as the separation distance increased to about 1,200nm, whereas the semi-variance from the other map (Figure 3d) rapidly increased to the plateau at a separation distance about 200nm.
Figure 3.
Contour maps of nanoindentation modulus obtained from bovine cortical bone and their variogram. (a) modulus map with smooth variation; (b) modulus map with rough variation; (c) variogram of the modulus map with smooth variation; (d) variogram of the modulus map with rough variation. The variograms were curve-fitted using exponential models to estimate the correlation length. The correlation length of the smooth maps (L=249nm) of modulus in bone is about five times that of rough maps (L=45nm).
Correlation lengths of both elastic modulus maps were estimated from the variogram by fitting with the exponential model (Figures 3c and 3d). Their values were calculated as 249nm and 45nm, respectively. Such a difference in the correlation length can also be ascertained from the appearance of the two experimental contour maps, showing that the smaller correlation length corresponded to more rough changes, whereas the map with the larger value indicated a more smooth distribution of the modulus.
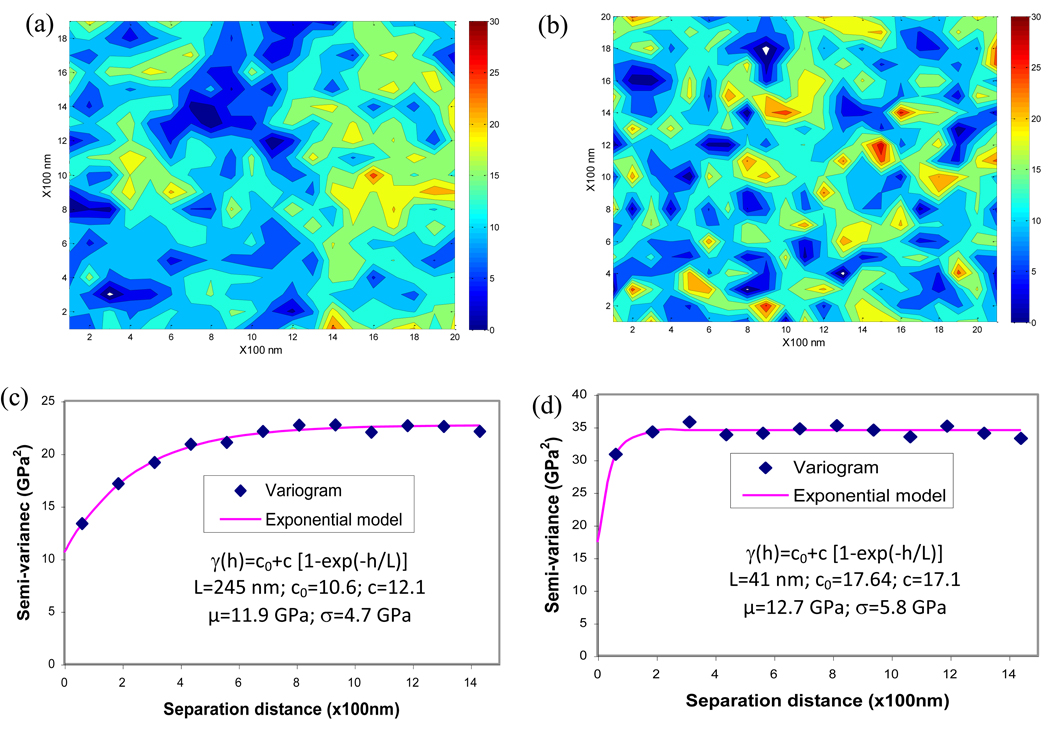
Using the correlation length estimated from the experimental modulus maps, a realization of the random field was generated using the KL transform, as described earlier. The mean and standard deviation obtained from the experimental modulus maps was used in the simulation. Comparing the simulation and experimental maps, the generated maps exhibited similar manifestation of the spatial modulus distributions in lamellae (Figure 4a and Figure 4b). The generated map with a lager correlation length (L=245nm, Figure 4c) was smoother in modulus changes, whereas the generated map with a shorter correlation length (L=41nm, Figure 4d) demonstrated more rapid spatial changes in the elastic modulus. The correlation lengths of the simulated maps were close to the experimental ones.
Figure 4.
Model generated maps of modulus using the random field theory and their variograms. (a) modulus map with smooth variation; (b) modulus map with rough variation; (c) variogram of the modulus map with smooth variation; (d) variogram of the modulus map with rough variation. Correlation lengths of simulated maps were estimated from variograms using exponential models.
4. DISCUSSION
The results of this study indicate that the random field approach may help quantitatively define the spatial variation of mechanical properties within lamellae of bone. In addition to the descriptive statistics (e.g., mean and standard deviation), the correlation length derived in this study may serve as an effective and quantitative parameter that gives rise to the spatial characteristics of bone inhomogeneity.
It is worth mentioning that the descriptive statistics between the two experimental modulus maps are nearly the same (means: 12.4 vs. 12.9, standard deviations: 5.4 vs. 5.9), and the variogram analysis shows that the maps are indeed quite different, exhibiting considerably different correlation length. This suggests that the basic statistics do not account for the spatial variation. The correlation length from the variogram analysis can effectively differentiate the spatial variation pattern of these two modulus maps with the nugget variance (c0) and the parameter c defining the localized variation of modulus.
Potentially, the correlation length can be used to assess age-related and/or pathological changes in bone ultrastructure (i.e., spatial variation of bone properties at nanoscopic levels) and its effect on bone fragility. Previous studies have shown that spatial variations in properties of bone may serve as one mechanism for energy dissipation at nanoscopic levels [7], and variations of mineralization in cortical and trabecular bone tissues may affect the toughness of osteoporotic tissues [6, 13, 14]. To address this issue, a recent study has used the experimental variogram to describe grey-level variations in 2D projection images derived from 3D micro-CT images of trabecular bone and its relationship with micro-architectural parameters in trabecular bone [15]. If the concept of the correlation length proposed in this study is applied, a quantitative measurement can be made directly on the plain X-ray or DEXA images obtained from routine clinical practice.
Quantification of inhomogeneity using the correlation length may also facilitate building the multi-scale model of bone as a hierarchical structure. In addition to quantifying nanoscopic variations of bone properties as shown in this study, a similar approach may also be used to describe the inhomogeneous properties at the microscopic, macroscopic and organ levels of bone. A recent study has successfully used the random field approach in the probabilistic finite element modeling of damage progression in bone at ultrastructural levels [12].
Moreover, this statistical approach can also be applied in design and fabrication of scaffolds used in bone tissue engineering. Characterizing the spatial distribution of material properties in the scaffolds will facilitate the design of biomaterials for tissue engineered bone products that may mimic the natural ones.
One limitation of this study is that the number of samples is small. Only two modulus maps were obtained from two bovine cortical bone samples. Nevertheless, the spatial variation of material properties was observed within these modulus maps. Another limitation is that isotropic randomness was assumed in this study to fit the variogram of modulus maps. In reality, anisotropy should be considered in the modeling process. In fact, a few studies have addressed the issue in defining the correlation lengths [9]. In addition, the covariance model to fit the variogram data will depend on the experimental data, and model selection must be evaluated on a case-by-case basis. We have tested that exponential, Gaussian and spherical models for modulus maps in this study. The exponential model has the highest R-square values for ordinary least square curve fitting. Therefore, we choose the exponential model in this study. Nevertheless, this does not mean that exponential covariance model is always appropriate for bone mineral and mechanical property data. The variogram must be analyzed for each case to choose a proper model. Correlation lengths from two different covariance models are not comparable. By fitting the variogram with different mathematical functions, we have observed different values of correlation lengths for exponential, Gaussian and spherical models.
5. CONCLUSION
This study has proved that the random field approach is a powerful means to quantify the spatial variation of tissue properties of bone. It has shown that the correlation length of the random field defined by an exponential model could be used as a quantitative parameter to characterize the spatial variation of elastic modulus in bone at nanoscopic scales. This approach may be employed potentially in estimating ultrastructural changes in bone. In fact, it may also help generate realistic spatial variations of tissue properties in bone at different length scales, thus providing detailed information for multi-scale modeling of bone and assisting in better design and fabrication of tissue engineered bone products.
ACKNOWLEDGMENT
This study was partly supported by a grant from NIH/NIAMS (1R01AR055955) and by an NSF grant (HRD-0932339) in association with the Center for Simulation, Visualization and Real Time Prediction. In addition, the authors would like to thank Dr. Christine Ortiz and Dr. Haimin Yao from the Department of Materials Science and Engineering at Massachusetts Institute of Technology for providing the nanoindentation modulus maps.
Footnotes
Publisher's Disclaimer: This is a PDF file of an unedited manuscript that has been accepted for publication. As a service to our customers we are providing this early version of the manuscript. The manuscript will undergo copyediting, typesetting, and review of the resulting proof before it is published in its final citable form. Please note that during the production process errors may be discovered which could affect the content, and all legal disclaimers that apply to the journal pertain.
REFERENCES
- 1.Ashman RB, Cowin SC, Van Buskirk WC, Rice JC. A continuous wave technique for the measurement of the elastic properties of cortical bone. J Biomech. 1984;17:349–361. doi: 10.1016/0021-9290(84)90029-0. [DOI] [PubMed] [Google Scholar]
- 2.Linde F, Hvid I, Madsen F. The effect of specimen geometry on the mechanical behaviour of trabecular bone specimens. J Biomech. 1992;25:359–368. doi: 10.1016/0021-9290(92)90255-y. [DOI] [PubMed] [Google Scholar]
- 3.Rho JY. An ultrasonic method for measuring the elastic properties of human tibial cortical and cancellous bone. Ultrasonics. 1996;34:777–783. doi: 10.1016/s0041-624x(96)00078-9. [DOI] [PubMed] [Google Scholar]
- 4.Hofmann T, Heyroth F, Meinhard H, Franzel W, Raum K. Assessment of composition and anisotropic elastic properties of secondary osteon lamellae. J Biomech. 2006;39:2282–2294. doi: 10.1016/j.jbiomech.2005.07.009. [DOI] [PubMed] [Google Scholar]
- 5.Ruffoni D, Fratzl P, Roschger P, Klaushofer K, Weinkamer R. The bone mineralization density distribution as a fingerprint of the mineralization process. Bone. 2007;40:1308–1319. doi: 10.1016/j.bone.2007.01.012. [DOI] [PubMed] [Google Scholar]
- 6.Busse B, Hahn M, Soltau M, Zustin J, Puschel K, Duda GN, Amling M. Increased calcium content and inhomogeneity of mineralization render bone toughness in osteoporosis: mineralization, morphology and biomechanics of human single trabeculae. Bone. 2009;45:1034–1043. doi: 10.1016/j.bone.2009.08.002. [DOI] [PubMed] [Google Scholar]
- 7.Tai K, Dao M, Suresh S, Palazoglu A, Ortiz C. Nanoscale heterogeneity promotes energy dissipation in bone. Nat Mater. 2007;6:454–462. doi: 10.1038/nmat1911. [DOI] [PubMed] [Google Scholar]
- 8.Oliver WC, Pharr GM. Measurement of hardness and elastic modulus by instrumented indentation: Advances in understanding and refinements to methodology. Journal of Materials Research. 2004;19:3–20. [Google Scholar]
- 9.Mcbratney AB, Webster R. Choosing Functions for Semi-Variograms of Soil Properties and Fitting Them to Sampling Estimates. Journal of Soil Science. 1986;37:617–639. [Google Scholar]
- 10.Atkinson PM, Lloyd CD. Non-stationary variogram models for geostatistical sampling optimisation: An empirical investigation using elevation data. Computers & Geosciences. 2007;33:1285–1300. [Google Scholar]
- 11.Vanmarcke M. Random fields: analysis and synthesis. Cambridge, Massachusetts: The MIT Press; 1983. [Google Scholar]
- 12.Dong XN, Guda T, Millwater HR, Wang X. Probabilistic failure analysis of bone using a finite element model of mineral-collagen composites. J Biomech. 2009;42:202–209. doi: 10.1016/j.jbiomech.2008.10.022. [DOI] [PMC free article] [PubMed] [Google Scholar]
- 13.van Ruijven LJ, Mulder L, van Eijden TM. Variations in mineralization affect the stress and strain distributions in cortical and trabecular bone. J Biomech. 2007;40:1211–1218. doi: 10.1016/j.jbiomech.2006.06.004. [DOI] [PubMed] [Google Scholar]
- 14.Wang X, Zauel RR, Rao DS, Fyhrie DP. Cancellous bone lamellae strongly affect microcrack propagation and apparent mechanical properties: separation of patients with osteoporotic fracture from normal controls using a 2D nonlinear finite element method (biomechanical stereology) Bone. 2008;42:1184–1192. doi: 10.1016/j.bone.2008.01.022. [DOI] [PMC free article] [PubMed] [Google Scholar]
- 15.Pothuaud L, Carceller P, Hans D. Correlations between grey-level variations in 2D projection images (TBS) and 3D microarchitecture: applications in the study of human trabecular bone microarchitecture. Bone. 2008;42:775–787. doi: 10.1016/j.bone.2007.11.018. [DOI] [PubMed] [Google Scholar]


