Abstract
We have developed a dual-modality imaging system by integrating optical-resolution photoacoustic microscopy and fluorescence confocal microscopy to provide optical absorption and fluorescence contrasts simultaneously. By sharing the same laser source and objective lens, intrinsically registered photoacoustic and fluorescence images are acquired in a single scan. The micrometer resolution allows imaging of both blood and lymphatic vessels down to the capillary level. Simultaneous photoacoustic angiography and fluorescence lymphangiography were demonstrated, presenting more information about tumor angiogenesis, vasculature, and microenvironments in vivo.
Index Terms: Photoacoustic microscopy, Fluorescence confocal microscopy, Multimodal imaging, Angiography, Lymphangiography
I. Introduction
Multimodal imaging provides complementary anatomical and functional contrasts of biological tissue. Predominantly sensitive to optical absorption contrast, photoacoustic microscopy (PAM) can noninvasively image both hemoglobin concentration and oxygen saturation in single blood vessels using endogenous contrast [1], [2]. Such functional contrasts have been co-registered with anatomical contrasts by combining photoacoustic (PA) imaging with other imaging modalities, such as optical coherence tomography (OCT) [3], [4], backscattering confocal microscopy (BCM) [5], and ultrasonic imaging (USI) [6], [7]. While OCT and BCM image optical scattering, USI senses acoustic scattering. Anatomical images based on such scattering contrasts provide rich context for the functional PA images. Here, we report a hybrid PA and fluorescence confocal microscopy (PA-FCM). Fluorescence confocal microscopy (FCM) has already been applied in a broad variety of biological studies for imaging fluorophores. We believe that our new hybrid imaging system can offer more comprehensive insights into physiology through co-registered microscopic images of optical absorption and fluorescence contrasts.
To demonstrate the PA-FCM system, we imaged blood vessels and draining lymphatic vessels in vivo simultaneously. In vivo angiography and lymphangiography are invaluable in microvascular-related physiological and pathophysiological research [8], [9]. Cancer hallmarks include hypoxia, angiogenesis, and lymphangiogenesis [10]–[12]. Moreover, cancer metastases can occur via blood or lymphatic vessels. Spectroscopic PA imaging has been employed to study new blood vessel formation and hemoglobin oxygen saturation (sO2) in tumors [13], [14]. Meanwhile, fluorescence microscopy has been widely used to image lymphangiogenesis and lymphatic hyperplasia in mouse tumor models [15]. The combination of PA angiography and fluorescence lymphangiography can provide more comprehensive information for monitoring tumor growth and treatment in small animals.
II. Methods and materials
A. PA-FCM System
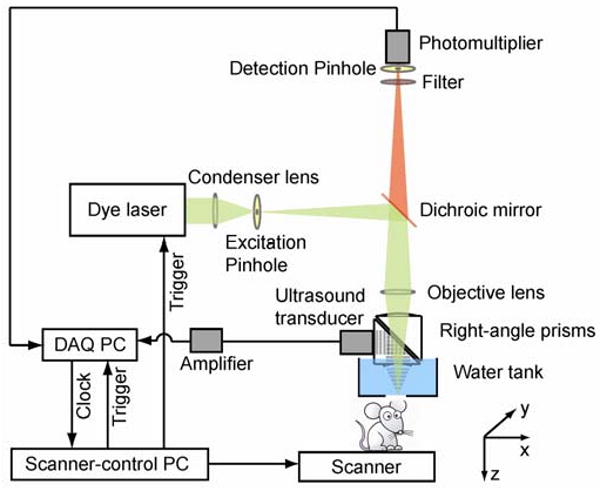
Figure 1 illustrates the experimental configuration of our PA-FCM system. The optical-resolution PAM subsystem was described in detail previously [1]. Briefly speaking, a tunable dye laser (Pyrromethene 597, Exciton, CBR-D, Sirah) pumped by a Nd:YLF laser (INNOSLAB, Edgewave) serves as the irradiation source. The laser beam (pulse duration, 7 ns), after passing through the excitation pinhole (pinhole diameter, 25 μm), is focused into the sample by an objective lens (NA, 0.2; magnification, 13.3). The laser pulse energy after the objective lens is ∼100 nJ. The generated PA waves are reflected by an acoustic-optical beam splitter to a 75-MHz ultrasonic transducer (V2022 BC, Olympus NDT). The FCM subsystem shares the same objective lens. A dichroic mirror (DMLP605, Thorlabs) allows transmission of fluorescence (above 605 nm) emitted from the sample. Two emission filters (FF01-624/40-25, Semrock) further eliminate the reflected excitation light. The fluorescence light passing through the detection pinhole (pinhole diameter, 50 μm) is collected by a photomultiplier tube module (H6780-20, Hamamatsu). The diameter of the detection pinhole was chosen by approximately matching the object-side pinhole diameter (detection pinhole diameter divided by objective lens magnification = 3.8 μm) with one Airy unit (1.22λ/NA = 3.5 μm). This method is commonly used in FCM to improve signal-to-noise ratios, while sufficiently rejecting light from off-focus plane [16], [17]. The amplified PA signal and fluorescence signal are digitized by a data acquisition card (CS 14200, Gage Applied). Two-dimensional raster scanning of the sample along the x-y transverse plane provides automatically co-registered PA and fluorescence images. Dual-wavelength angiography and lymphangiography images are captured by changing the laser wavelength after completing each B-scan. For light fluence compensation for both PA and fluorescence images, the laser energy is measured at both wavelengths by a photodiode before imaging.
Fig. 1.

Schematic of the dual-modality PA-FCM system.
B. Animal Preparation
We applied the multimodal system to image an ear of a nude mouse (Harlan, body weight ∼20 g) in vivo. To visualize the lymphatic network using PA-FCM, 5 μL of 20% rhodamine B isothiocyanate (RITC)–dextran (R9379, Sigma; average molecular weight ∼70000) was injected into the mouse ear tip using a 29-gauge needle. Imaging of blood and lymphatic vessels started immediately after the dye injection and lasted for ∼40 min. To keep the animal motionless, a breathing anesthesia system (E-Z Anesthesia, Euthanex) ventilated a gas mixture of 1% isoflurane and medical grade oxygen to the mouse during experiments. All experimental animal procedures were carried out in conformity with the laboratory protocol approved by the Animal Studies Committee of the School of Medicine at Washington University in St. Louis.
III. Results
A. Spatial resolution of PA-FCM system
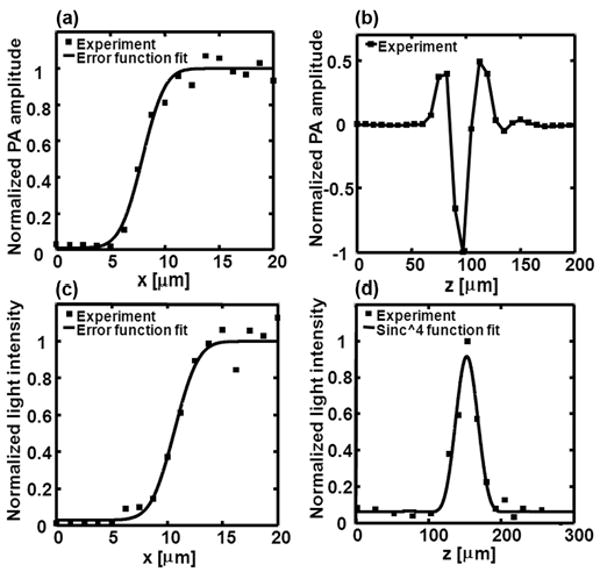
The spatial resolution of the PA-FCM system was measured experimentally. To quantify the resolution of PAM, a surgical blade was used as the sample. Figure 2(a) shows the edge spread function from the blade PAM image. The measured edge spread function was nonlinearly fitted by an error function. The full width at half maximum (FWHM) of its derivative —defining the lateral resolution—was estimated to be ∼3.9 μm. The axial resolution of PAM was measured using a “shift-and-sum” method with a single A-line PA signal in Fig. 2(b) [18]. The estimated PAM axial resolution was ∼17 μm, as determined by the 100-MHz bandwidth of the transducer. We quantified the resolution of confocal microscopy by measuring reflected light from a cracked silver mirror surface. Emission filters were removed for the resolution test. The edge spread function of the confocal microscope, as plotted in Fig. 2(c), yielded a lateral resolution of ∼3.9 μm. To measure the axial resolution of the confocal microscope, the mirror was translated along the axial direction. Figure 2(d) plots the normalized reflected light intensity with the mirror surface at various depths. The experimental data was then fitted by a (sinc)4 function [16], whose FWHM of ∼38 μm was used as the axial resolution of the confocal microscope.
Fig. 2.

Spatial resolutions of the dual-modality PA-FCM. (a) The lateral edge spread function of the PAM. (b) The axial resolution of the PAM. (c) The lateral edge spread function of the confocal microscope. (d) The axial resolution of the confocal microscope.
B. Vascular and Lymphatic Imaging
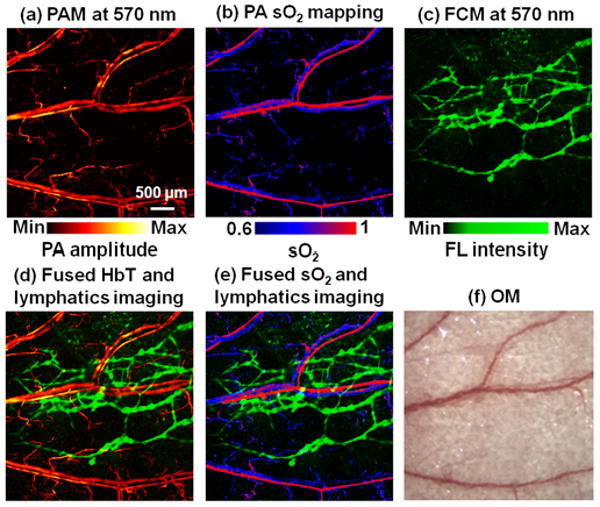
Anatomical and functional images of a nude mouse ear were acquired at dual wavelengths (570 and 593 nm). Figure 3(a) shows a structural PA image of vasculatures in the ear taken at an optical wavelength of 570 nm. Because 570 nm is an isosbestic point of oxyhemoglobin (HbO2) and deoxyhemoglobin (HbR) molar absorptivities, the PA signal amplitude measured at this wavelength depends on the total hemoglobin (HbT) concentration but not the sO2. Aided by the PA-FCM images acquired at 593 nm, the relative concentrations of HbO2 and HbR, and subsequently sO2, can be calculated based on the molar extinction spectra of HbO2 and HbR [9]. The PA sO2 mapping is shown in Fig. 3(b). Figure 3(c) shows the fluorescence images of lymphatics obtained simultaneously with the PA image in Fig. 3(a). After injection of RITC-dextran, lymphatic networks became visible in the FCM image. The mean ratio of the fluorescence signals from the lymphatic network at the excitation wavelengths of 570 nm and 593 nm was 9.2, and the ratio measured with the fluorescence dye in vitro was 10.0, confirming fluorescence emission from RITC-dextran. Figure 3(d) co-registers the mappings of the total hemoglobin concentration and fluorescence lymphatics. Figure 3(e), the fused image of vessel-by-vessel sO2 and fluorescent lymphatics, clearly depicts arterioles, venules, and draining lymphatic vessels in the mouse ear. Because vasculature regulates the metabolic and hemodynamic states of biological tissue and angiogenesis and lymphangiogenesis facilitate the spread of cancer, visualizing both blood and lymphatic vessels enables more comprehensive tracking of cancer metastasis.
Fig. 3.

Combined functional vascular and lymphatic images of a mouse ear in vivo. (a) PAM image of microvasculature acquired at 570 nm. (b) PA sO2 mapping based on dual-wavelength (570 nm and 593 nm) measurements. (c) FCM image of the lymphatic system acquired at 570 nm after the injection of 20% RITC-dextran. (d) Fused mapping of total hemoglobin concentration and fluorescent lymphatics. (e) Fused mapping of sO2 and fluorescent lymphatics. (f) Optical microscopic image acquired within the same region. FL: fluorescence. OM: optical microscopy.
IV. Conclusion
The experimental results here demonstrate the capability of the PA-FCM system in revealing complementary PA and fluorescence contrasts. The applications of PA-FCM will not be limited to the fusion of angiography and lymphangiography. Fluorescent molecular probes for tumor detection can be used so that tumor location and angiogenesis can be visualized simultaneously. With voltage-sensitive dye, fluorescence imaging can map voltage changes of the cell membrane potential [19]; while PAM can image the vasoconstriction and vasodilatation of blood vessels [2]. Hence the PA-FCM system may be used to image neurovascular interactions during brain electrical stimulation.
Acknowledgments
This work was sponsored in part by National Institutes of Health grants R01 EB000712, R01 EB008085, R01 CA113453901, U54 CA136398, and 5P60 DK02057933. L.W. has a financial interest in Microphotoacoustics, Inc. and Endra, Inc., which, however, did not support this work.
Contributor Information
Yu Wang, Optical Imaging Laboratory, Department of Biomedical Engineering, Washington University in St. Louis, Campus Box 1097, One Brookings Drive, St. Louis, MO 63130-4899, USA.
Konstantin Maslov, Optical Imaging Laboratory, Department of Biomedical Engineering, Washington University in St. Louis, Campus Box 1097, One Brookings Drive, St. Louis, MO 63130-4899, USA.
Chulhong Kim, Optical Imaging Laboratory, Department of Biomedical Engineering, Washington University in St. Louis, Campus Box 1097, One Brookings Drive, St. Louis, MO 63130-4899, USA.
Song Hu, Optical Imaging Laboratory, Department of Biomedical Engineering, Washington University in St. Louis, Campus Box 1097, One Brookings Drive, St. Louis, MO 63130-4899, USA.
Lihong V. Wang, Email: lhwang@biomed.wustl.edu, The Optical Imaging Laboratory, Department of Biomedical Engineering, Washington University in St. Louis, Campus Box 1097, One Brookings Drive, St. Louis, MO 63130-4899, USA.
References
- 1.Maslov K, Zhang HF, Hu S, Wang LV. Optical-resolution photoacoustic microscopy for in vivo imaging of single capillaries. Opt Lett. 2008;33:929–931. doi: 10.1364/ol.33.000929. [DOI] [PubMed] [Google Scholar]
- 2.Hu S, Maslov K, Wang LV. Noninvasive label-free imaging of microhemodynamics by optical-resolution photoacoustic microscopy. Opt Express. 2009;17:7688–7693. doi: 10.1364/oe.17.007688. [DOI] [PMC free article] [PubMed] [Google Scholar]
- 3.Jiao S, Xie Z, Zhang HF, Puliafito CA. Simultaneous multimodal imaging with integrated photoacoustic microscopy and optical coherence tomography. Opt Lett. 2009;34:2961–2963. doi: 10.1364/OL.34.002961. [DOI] [PMC free article] [PubMed] [Google Scholar]
- 4.Li L, Maslov K, Ku G, Wang LV. Three-dimensional combined photoacoustic and optical coherence microscopy for in vivo microcirculation studies. Opt Express. 2009;17:16450–16455. doi: 10.1364/OE.17.016450. [DOI] [PMC free article] [PubMed] [Google Scholar]
- 5.Zhang HF, Wang J, Wei Q, Liu T, Jiao S, Puliafito CA. Collecting back-reflected photons in photoacoustic microscopy. Opt Express. 2010;18:1278–1282. doi: 10.1364/OE.18.001278. [DOI] [PMC free article] [PubMed] [Google Scholar]
- 6.Niederhauser JJ, Jaeger M, Lemor R, Weber P, Frenz M. Combined ultrasound and optoacoustic system for real-time high-contrast vascular imaging in vivo. Medical Imaging, IEEE Transactions on. 2005;24:436–440. doi: 10.1109/tmi.2004.843199. [DOI] [PubMed] [Google Scholar]
- 7.Harrison T, Ranasinghesagara JC, Lu H, Mathewson K, Walsh A, Zemp RJ. Combined photoacoustic and ultrasound biomicroscopy. Opt Express. 2009;17:22041–22046. doi: 10.1364/OE.17.022041. [DOI] [PubMed] [Google Scholar]
- 8.Bollinger A, Jager K, Sgier F, Seglias J. Fluorescence microlymphography. Circulation. 1981;64:1195–1200. doi: 10.1161/01.cir.64.6.1195. [DOI] [PubMed] [Google Scholar]
- 9.Hu S, Wang LV. Photoacoustic imaging and characterization of the microvasculature. Journal of Biomedical Optics. 2010;15:011101–011115. doi: 10.1117/1.3281673. [DOI] [PMC free article] [PubMed] [Google Scholar]
- 10.Folkman J. Angiogenesis in cancer, vascular, rheumatoid and other disease. Nat Med. 1995;1:27–30. doi: 10.1038/nm0195-27. [DOI] [PubMed] [Google Scholar]
- 11.Carmeliet P, Jain RK. Angiogenesis in cancer and other diseases. Nature. 2000;407:249–257. doi: 10.1038/35025220. [DOI] [PubMed] [Google Scholar]
- 12.Stacker SA, Achen MG, Jussila L, Baldwin ME, Alitalo K. Metastasis: Lymphangiogenesis and cancer metastasis. Nat Rev Cancer. 2002;2:573–583. doi: 10.1038/nrc863. [DOI] [PubMed] [Google Scholar]
- 13.Ku G, Wang X, Xie X, Stoica G, Wang LV. Imaging of tumor angiogenesis in rat brains in vivo by photoacoustic tomography. Appl Opt. 2005;44:770–775. doi: 10.1364/ao.44.000770. [DOI] [PubMed] [Google Scholar]
- 14.Li ML, Oh JT, Xie X, Ku G, Wang W, Li C, Lungu G, George S, Wang LV. Simultaneous Molecular and Hypoxia Imaging of Brain Tumors In Vivo Using Spectroscopic Photoacoustic Tomography. Proc IEEE. 2008;96:481–489. [Google Scholar]
- 15.Hoshida T, Isaka N, Hagendoorn J, di Tomaso E, Chen YL, Pytowski B, Fukumura D, Padera TP, Jain RK. Imaging Steps of Lymphatic Metastasis Reveals That Vascular Endothelial Growth Factor-C Increases Metastasis by Increasing Delivery of Cancer Cells to Lymph Nodes: Therapeutic Implications. Cancer Research. 2006;66:8065–8075. doi: 10.1158/0008-5472.CAN-06-1392. [DOI] [PubMed] [Google Scholar]
- 16.Robert HW. Confocal optical microscopy. Reports on Progress in Physics. 1996;59:427. [Google Scholar]
- 17.Guy C, Colin JRS. Practical limits of resolution in confocal and non-linear microscopy. Microscopy Research and Technique. 2004;63:18–22. doi: 10.1002/jemt.10423. [DOI] [PubMed] [Google Scholar]
- 18.Xie Z, Jiao S, Zhang HF, Puliafito CA. Laser-scanning optical-resolution photoacoustic microscopy. Opt Lett. 2009;34:1771–1773. doi: 10.1364/ol.34.001771. [DOI] [PubMed] [Google Scholar]
- 19.Shoham D, Glaser DE, Arieli A, Kenet T, Wijnbergen C, Toledo Y, Hildesheim R, Grinvald A. Imaging Cortical Dynamics at High Spatial and Temporal Resolution with Novel Blue Voltage-Sensitive Dyes. Neuron. 1999;24:791–802. doi: 10.1016/s0896-6273(00)81027-2. [DOI] [PubMed] [Google Scholar]


