

Abstract
To evaluate sequential nearest-neighbor effects on quantum-chemical calculations of 13Cα chemical shifts, we selected the structure of the nucleic acid binding (NAB) protein from the SARS coronavirus determined by NMR in solution (PDB id 2K87). NAB is a 116-residue α/β protein, which contains 9 prolines and has 50% of its residues located in loops and turns. Overall, the results presented here show that sizeable nearest-neighbor effects are seen only for residues preceding proline, where Pro introduces an overestimation, on average, of 1.73 ppm in the computed 13Cα chemical shifts. A new ensemble of 20 conformers representing the NMR structure of the NAB, which was calculated with an input containing backbone torsion angle constraints derived from the theoretical 13Cα chemical shifts as supplementary data to the NOE distance constraints, exhibits very similar topology and comparable agreement with the NOE constraints as the published NMR structure. However, the two structures differ in the patterns of differences between observed and computed 13Cα chemical shifts, Δca,i, for the individual residues along the sequence. This indicates that the Δca,i -values for the NAB protein are primarily a consequence of the limited sampling by the bundles of 20 conformers used, as in common practice, to represent the two NMR structures, rather than of local flaws in the structures.
Keywords: Quantum-chemical calculation of 13Cα- chemical shifts, NMR structures of proteins, Sampling of conformation space
Introduction
Recent progress with the use of automatic and semi-automatic protocols for the structure determination of proteins by nuclear magnetic resonance (NMR) spectroscopy calls for improved structure validation procedures to assess the quality of the newly produced structures. Such validation procedures should contribute to increasing the quality of the NMR structures without requiring the acquisition of additional NMR data. For this purpose, the validation method should be able to provide a global structure quality score and at the same time be sensitive enough to identify flaws in local polypeptide segments. In this context, a new quantum-chemistry-based method for the evaluation of NMR structures was recently introduced, which can be used for any type of protein with available 13Cα chemical shifts (Vila et al. 2007b) and may replace statistical or semi-classical descriptions of protein properties. This new strategy provides a unified, self-consistent method to validate and determine high-quality protein structures, which does not rely on knowledge-based information (Vila et al. 2007a, b, 2008a). It makes use of the ever-increasing computational power available to achieve a detailed analysis of protein structures with physics-based strategies.
The currently used 13Cα chemical shift-based validation and determination protocol (Vila and Scheraga 2008, 2009; Vila et al. 2007a, b, 2008a) was introduced to exploit the following characteristics: (1) The assignment of Cα chemical shifts is a fundamental step in a protein structure determination by NMR spectroscopy, and no extra experimental work is needed. (2) In addition to the impact of the covalent structure, 13Cα chemical shifts are modulated mainly by the intraresidue backbone and side-chain dihedral angles (Spera and Bax 1991; de Dios et al. 1993; Kuszewski et al. 1995; Luginbühl et al. 1995; Havlin et al. 1997; Pearson et al. 1997; Iwadate et al. 1999; Xu and Case 2001; Sun et al. 2002; Villegas et al. 2007). (3) 13Cα is ubiquitous in proteins. (4) 13Cα chemical shifts can be computed with high accuracy at the quantum chemistry level of theory. This methodology has been used recently to validate (Vila and Scheraga 2009) and determine the structures of several proteins that differ in size and in 3D structure (Vila et al. 2007a, b, 2008a).
The nucleic acid binding (NAB) protein of the SARS coronavirus (Serrano et al. 2009), a 116-residue α/β protein containing 9 prolines and with 50% of its residues in loops and turns, was now chosen to further evaluate the impact of sequential nearest-neighbor effects on the accuracy of the computed 13Cα chemical shifts. The resulting analysis will provide us with information that can later be used to improve the prediction of 13Cα chemical shifts by servers, such as Cheshift (Vila et al. 2009).
Materials and methods
Conversion of the experimental NMR structures to rigid ECEPP geometry
The Ω = 20 conformers of the NAB protein (shown in Fig. 1) were regularized by replacing each residue with the corresponding standard ECEPP/3 residue (Némethy et al. 1992), for which the bond lengths and the bond angles are fixed (rigid-geometry approximation). This is a necessary step before the computation of the 13Cα chemical shifts. It did not change the original geometries significantly, as indicated by the all-heavy atom rmsd values (~0.12 Å) between each corresponding pair of experimental and regularized conformers.
Fig. 1.

Stereo-ribbon diagram of residues 6–112 of the conformer closest to the mean coordinates of the bundle of 20 protein conformers used to represent the NMR structure of the SARS-CoV NAB (Serrano et al. 2009). The regular secondary structures and the two residues P6 and K112 are identified. The molecular model was generated using the atomic coordinates deposited in the protein data bank, id 2K87
Computation of 13Cα chemical shifts
Each amino acid residue Xxx in the protein sequence was treated separately in 116 terminally-blocked tripeptides of sequence Ac-Gly-Xxx-Gly-NMe (Ac = acetyl; NMe = N-methyl), with the dihedral angles for Xxx taken from each of the Ω = 20 protein conformers. The 13Cα isotropic shielding values (σ) for each residue Xxx were calculated using the Gaussian 03 package (Frisch et al. 2004) at the OB98/6-311 + G(2d,p) level of theory for Xxx (Vila et al. 2008b), while the other residues in the tripeptides were treated at the OB98/3-21G level of theory, using the locally-dense basis set approach (Chesnut and Moore 1989). All ionizeable residues were considered to be neutral during the quantum-chemical calculations (Vila and Scheraga 2008), and a shielding value of 184.5 ppm for tetramethylsilane (TMS) was used as the reference (Vila et al. 2008b). Conversion of the computed TMS-referenced values for the 13Cα chemical shifts to a 2,2-dimethyl-2-silapentane-5-sulfonic acid sodium salt (DSS) reference was carried out by adding 1.7 ppm to the computed values (Wishart et al. 1995b).
Computation of the 13Cα conformational average rmsd
The observed chemical shift for each residue  represents the contributions from the ensemble of rapidly interconverting conformers that coexist in solution. An accurate comparison between observed and computed 13Cα chemical shifts therefore requires consideration of an ensemble of NMR-derived conformers, rather than of a single conformation. Hence, for each amino acid residue in the sequence, i, the average of the chemical shifts calculated for the individual residues in the ensemble of Ω conformers representing the NMR structure, 〈13Cα〉i, is computed as
 |
1 |
where  is the computed chemical shift for residue i in conformer k, with 1 ≤ i ≤ N, where N is the number of residues in the sequence. Equation (1) was obtained through the following approximation: For each residue, the quantity to be computed must, in principle, be
  where λk is the Boltzmann factor for conformer k, with
  . Because computation of the Boltzmann factors on the quantum mechanical level of theory was not possible with our present computational facilities, we used the approximation that each conformer contributes equally to the average chemical shift obtained by fast conformational averaging, i.e., λ
k = 1/Ω. Whether a computation of a Boltzmann average, rather than the arithmetic average, of the 13Cα chemical shifts given by Eq. (1) would lead to a more accurate representation of the 13Cα chemical shifts needs further investigation. This is currently beyond our computational capability, since it would require computation of the total energy at the quantum mechanical level of theory for each of the conformers in the ensemble used to represent the NMR structure.
. Because computation of the Boltzmann factors on the quantum mechanical level of theory was not possible with our present computational facilities, we used the approximation that each conformer contributes equally to the average chemical shift obtained by fast conformational averaging, i.e., λ
k = 1/Ω. Whether a computation of a Boltzmann average, rather than the arithmetic average, of the 13Cα chemical shifts given by Eq. (1) would lead to a more accurate representation of the 13Cα chemical shifts needs further investigation. This is currently beyond our computational capability, since it would require computation of the total energy at the quantum mechanical level of theory for each of the conformers in the ensemble used to represent the NMR structure.
The 〈13Cα〉i value obtained with Eq. (1) is used to compute the conformational-average difference Δca,i between the observed and computed 13Cα chemical shifts for each amino acid residue i,
 |
2 |
From this, the conformational-average rmsd parameter, ca-rmsd (Vila et al. 2007a), is obtained as
 |
3 |
which is a global property of the protein NMR structure given as the weighted average of the differences between the experimental 13Cα chemical shifts and the 〈13Cα〉i—values for all the residues in the protein.
NMR structure determination of NAB and generation of the structure NAB-13Cα
The structure determination of the NAB protein by Serrano et al. (2009) has an all-heavy-atom rmsd of 0.88 Å for the set of 20 conformers used to represent the globular domain comprising residues 5–112. The Ramachandran plot statistics obtained with PROCHECK (Laskowski et al. 1993) indicated that more than 97% of the backbone dihedral angles are in the most favored region or the additional allowed regions, with no residue in disallowed regions.
A new ensemble of 20 conformers, NAB-13Cα, was generated to provide a reference with which to evaluate the origin of per-residue 13Cα chemical shift differences, Δca,i, in the NAB structure. The input for the calculation of NAB-13Cα contains the same experimental NOE distance constraints as used for the published NAB NMR structure (Serrano et al. 2009) and a new set of ϕ and ψ dihedral angle constraints. The new set of dihedral angle constraints for each residue was chosen from the conformer of the published NAB ensemble (Serrano et al. 2009) that best reproduced the experimental 13Cα chemical shifts for this residue (Vila et al. 2007a, 2008a). The dihedral angle constraints derived from these values were used with a ± 30º range to allow for local rearrangements during structure calculation with the software CYANA. The NAB-13Cα ensemble was energy-minimized with the software OPALp (Luginbühl et al. 1997; Koradi et al. 2000) and exhibits an all-heavy-atom rmsd of 0.87 Å for the globular domain comprising residues 5–112. The NMR structure of NAB and the structure NAB-13Cα show very similar global architectures but different patterns of differences between observed and computed 13Cα chemical shifts, Δca,i, along the amino acid sequence. Hence, comparison of the two structures should enable us to investigate possible conformational-sampling effects.
CPU time used
The computational time was evaluated as the average of the CPU times T i needed for each of the N = 116 residues of conformer 1 of the NAB protein, :
 |
4 |
T i is the total CPU time (in seconds) used for residue i, as reported by the Gaussian 03 suite of programs (Frisch et al. 2004). All DFT calculations were carried out on a system of 768 cores with a floating point capability of 5.1 Tflops located at the Pittsburgh Supercomputing Center. The CPU time needed to compute the 13Cα chemical shifts for the NAB protein conformer 1 was, on average, 1,800 s per residue when using a cluster of 116 processors, which adds up to 10 h for twenty conformers.
Results and discussion
The set of 20 conformers representing the NMR structure of the SARS-CoV NAB protein (Serrano et al. 2009) after energy minimization with the software OPALp (Luginbühl et al. 1997; Koradi et al. 2000) (Fig. 1) was evaluated using the 13Cα chemical shift-based protocol by Vila and Scheraga (2009). Residues with significant differences between experimental and calculated 13Cα chemical shifts were selected to further investigate possible contributions from nearest-neighbor sequence effects and from limited conformational sampling.
Sequential nearest-neighbor effects on computed 13Cα chemical shifts
Figure 2 shows a histogram of the sequence distribution of the differences between observed and computed 13Cα chemical shifts, Δca,i, obtained with Eqs. (1) and (2) for the NAB ensemble. Here, we investigate sequential nearest-neighbor effects on the calculated shifts.
Fig. 2.

Histogram of the absolute values of the conformational-average difference per residue between the observed chemical shifts and the 〈13Cα〉i values, Δca,i, computed with Eqs. (1) and (2) for the published bundle of 20 NAB conformers (Serrano et al. 2009). The values of Δca,i are indicated using the following color code: red, α-helices; blue, 310-helices; green, β-strands; grey, non-regular secondary structure. Black bars indicate proline residues
In the standard calculation procedure of Vila et al. (2007b) each residue Xxx has Gly residues as sequential neighbors in the model peptides Ac-Gly-Xxx-Gly-NMe. For further refinement of the predictions we are interested in determining the magnitudes of the changes in Δca,i that may occur if the glycines in the model peptides are replaced by the actual nearest-neighbor residues in the protein sequence. Thus, we computed 13Cα chemical shifts for each residue Xxx of the 20 NAB conformers using the two model peptides Ac-Gly-Yyy-Xxx-Gly-NMe and Ac-Gly-Xxx-Yyy-Gly-NMe, where Yyy designates the preceding or subsequent residue-type, and the dihedral angles for the dipeptides -Yyy-Xxx- and -Xxx-Yyy- were taken from the 20 NMR conformers.
The actual investigation was carried out by first comparing the DFT-based 13Cα chemical-shift values of the Xxx residue in the model peptides Ac-Gly-Xxx-Yyy-Gly-NMe and Ac-Gly-Xxx-Gly-NMe. Consequently, for each Xxx residue i the second-order differences,  , were computed as
  , with
  and
and  given by Eq. (2), and
  and
and  being the averages of the computed 13Cα chemical shifts calculated for the model peptides Ac-Gly-Xxx-Yyy-Gly-NMe and Ac-Gly-Xxx-Gly-NMe, respectively. The amino acid composition of NAB is 9 Ala, 9 Pro, 8 Asp, 8 Phe, 14 Thr, 3 Arg, 4 Gln, 3 His, 10 Lys, 3 Trp, 7 Asn, 2 Glu, 4 Ile, 1 Met, 3 Tyr, 3 Cys, 3 Gly, 10 Leu, 7 Ser and 6 Val. For each residue-type Yyy we computed the average second-order difference on Xxx,
  (Fig. 3a). The result indicates that the influence of the C-terminally neighboring residue-type on the computed 13Cα chemical shifts is less than ± 0.50 ppm, with the sole exception of Pro, where, on average of the nine Xxx-Pro dipeptide segments in the NAB, a value of + 1.73 ppm was obtained. Inclusion of the “proline effect” in the validation of the published bundle of 20 NAB conformers (Serrano et al. 2009) leads to a significantly improved fit to the experimental chemical shifts for residues preceding proline (compare Fig. 4a with Fig. 2).
Fig. 3.
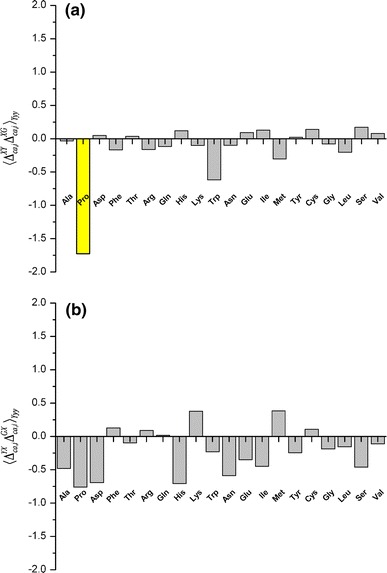
a Histogram of the average second-order differences,  , arising from the nature of the sequentially following residue-type (Yyy). Grey bars are used for all residues except proline, which is indicated as a yellow bar; b same as a for differences arising from the nature of the preceding residue-type, with no color distinction for proline
Fig. 4.

a Same as Fig. 2 after correction for proline sequential nearest-neighbor effects. b Histogram showing the number of NOE-derived distance constraints per residue along the amino acid sequence. Intraresidual, sequential and medium-range NOE constraints (Wüthrich 1986) are indicated in grey, and long-range constraints in black
We then computed the average second-order difference  arising from N-terminally neighboring residues by using the model peptides Ac-Gly-Yyy-Xxx-Gly-NMe and Ac-Gly-Xxx-Gly-NMe (Fig. 3b). A comparison with Fig. 3a indicates two important differences. First, none of the residue-types shows a significant nearest-neighbor effect. Second, except for Pro, the preceding residue-type shows slightly larger effects on the computed 13Cα chemical shifts of Xxx than that due to the subsequent residue-type.
Further investigation of the “proline effect”
The overestimation of 1.73 ± 1.27 ppm arising from the C-terminal Pro nearest-neighbor effect in the computation of the 13Cα chemical shifts is in line with empirical observations made with statistical-coil oligopeptides (Wishart et al. 1995a; Schwarzinger et al. 2001). These authors reported systematic chemical shift differences of about +2.0 ppm due to the presence of a subsequent proline in the sequence. The physical nature of this effect has been described by Wishart et al. (1995a) as “…an imide bond formed by an Xxx–Pro pairing is generally thought to be much less electron-withdrawing than an amide bond…”
Of the 9 residues immediately preceding proline in NAB, 6 are in coil segments (Gln-5, Gln-13, Leu-15, Lys-44, Phe-55 and Lys-83), 2 in β-strands (Val-10 and Lys-112), and 1 in an α-helix (Lys-99). If the proline effect is not taken into account during the DFT-based computation of the 13Cα chemical shifts, these residues experience an average overestimation of +2.85 ppm and +1.72 ppm when located in coils or β-strands, respectively, while the residue in the α-helix shows an underestimation of −0.51 ppm. These results are in agreement with a statistical analysis of the secondary structure influence on both the chemical shifts and the nearest-neighbor-residue effects in proteins by Wang and Jardetzky (2002). By using a database containing ~14,400 observed chemical shift values representing almost all possible nearest-neighbor pairs of amino acid residues in different conformations, these authors found that the 13Cα chemical shifts of residues immediately preceding proline experience average proline neighboring-residue effects of −2.04 ± 0.45 ppm, −1.63 ± 0.56 ppm and +0.51 ± 2.54 ppm for residues in coil, β-strand and α-helix segments, respectively.
Analysis of the structure NAB-13Cα
Figure 5 shows a histogram of the absolute values of the conformational-average difference per residue, Δca,i, for the NAB-13Cα ensemble, with the positions of prolines denoted by black bars. The Δca,i values were computed considering the proline-effect (grey bars) and without taking the proline-effect into account (red dots). An analysis of the differences between the grey bars and red dots indicates an average overestimation of 1.67 ± 1.30 ppm in the computed 13Cα chemical shifts for residues immediately preceding proline. This is in very good agreement with the value 1.73 ± 1.27 ppm obtained for the published NMR structure of the NAB (Serrano et al. 2009).
Fig. 5.
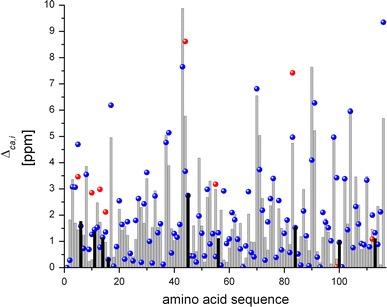
Histogram of Δca,i values. For the published NAB ensemble of 20 NMR conformers (Serrano et al. 2009) the values calculated with correction for the proline effect are indicated by blue dots. For the NAB-13Cα ensemble the data calculated with correction for the proline effect are given by the height of the grey bars, and those calculated without correction for the proline effect by red dots (indicated only for the 9 residues preceding Pro. The Pro positions are indicated by black bars)
In Fig. 5, blue dots represent the highest-values of the conformational-average difference per residue, Δca,i, obtained for the NAB ensemble, as seen in Fig. 4a. As judged by the differences between grey bars and blue dots, the largest values of Δca,i computed for the NAB protein for the majority of the residues, do not originate from local flaws in the structures, but are due to the limited sampling by the bundles of 20 conformers used here to represent the NMR structures, which corresponds to common practice (Wüthrich 1986). Conceivably, use of a larger number of conformers would enable one to demonstrate that the origin of all the differences between computed and observed 13Cα chemical shifts for the NAB protein are due to conformational-sampling effects. In fact, the ca-rmsd computed over all 20 conformers of protein NAB is 2.55 ppm while the ca-rmsd computed for randomly-selected sets from the bundle of 20, containing 10 and 5 conformers each is 2.77 ppm and 2.90 ppm, respectively. These results illustrate the impact of the number of conformers on the closeness of the fit between computed and observed 13Cα chemical shifts for the NAB protein.
At first sight the large value of +9.8 ppm for Δca,i of Thr43 (Fig. 5), which is located in a loop region of the molecule, appears to be out of range, although a similarly large difference +9.3 ppm can also be seen for the C-terminal Thr116 (Fig. 2). However, comparison of the results for Thr116 obtained with the NAB ensemble and NAB-13Cα set (Fig. 5) indicates that the origin of the large difference observed for this residue is likely due to limited conformational-sampling. In any case, the magnitudes of the computed conformational-average differences for Thr43 and Thr116 (Figs. 2, 5) are within the 9.2 ppm range of variation for the observed values of 13Cα chemical shifts among all 14 Thr residues in the NAB (BMRB id 15723).
13Cα-based structure validation of the NAB protein
We evaluated the quality of the NAB protein NMR structure in terms of the ca-rmsdL (Martin et al. 2010) after considering the proline nearest-neighbor effect. The ca-rmsdL provides an estimation of the quality of the overall structure and represents the normalized, size-independent ca-rmsd value that would be measured if the given structure under consideration contains L, rather than N, residues (Carugo and Pongor 2001). For the purpose of this work, we chose L = 76 as the reference residue number, with L representing the size of the ubiquitin protein, for which a highly-accurately-solved NMR structure is available (1D3Z; Cornilescu et al. 1998).
The normalized ca-rmsd76 value of 2.11 ppm for the NAB indicates that the published bundle of 20 conformers represents the experimental 13Cα chemical shifts in solution with similar or better accuracy than the following experimental structures that have previously been subjected to the same validation protocol: (1) A set of 10 conformers representing an NMR structure of the 76-residue α/β protein ubiquitin (Cornilescu et al. 1998), PDB 1D3Z), for which the ca-rmsd76 is 2.18 ppm [2.20 ppm per residue before considering the effects due to the 3 prolines in the sequence (Vila et al. 2007b)]. (2) The X-ray structure of ubiquitin solved at 1.8 Å resolution (Vijay-Kumar et al. 1987; PDB 1UBQ), for which the ca-rmsd76 is 2.58 ppm [2.60 ppm per residue before considering the effects due to the 3 prolines in the sequence (Vila et al. 2007b)]. (3) A set of 20 conformers representing an NMR structure of the 48-residue all-α YnzC protein from Bacillus subtilis that contains no prolines (Aramini et al. 2008; PDB 2JVD), for which the ca-rmsd76 is 2.72 ppm per residue (Vila et al. 2007b).
These results show that our standard approach, which does not account for proline nearest-neighbor effects, still provides a good estimate of the quality of the global structure, since only small differences are observed between the previous and current ca-rmsd76 values. The present inclusion of sequential nearest-neighbor effects into our method is therefore primarily driven by our interest in providing tools to identify local flaws in NMR structures of proteins.
Improving the CheShift server considering the pro effect
The 13Cα chemical shifts for Xxx in the model peptide Ac-Gly-Xxx-Gly-NMe have always been computed by using the exact dihedral angles found in the conformation of the protein under investigation, and considering that the surrounding Gly residues and the end-blocking groups are free to rotate about the single bonds (Vila et al. 2007b; Vila and Scheraga 2009). Adoption of this assumption was crucial for the development of the CheShift server (Vila et al. 2009), and is still reasonable for Gly as Yyy in light of the small values of 0.08 and 0.19 ppm, observed for  and
and  , respectively (Fig. 4). In other words, the influence of the backbone dihedral angles of the preceding or subsequent Gly residue on the computed 13Cα chemical shifts of Xxx is small.
Overall, the use of the Ac-Gly-Xxx-Gly-NMe model peptides for the computation of the 13Cα chemical shifts of the residue Xxx seems suitable, independent of the identity of the nearest-neighbor residues except when the subsequent residue is Pro. Consequently, this “proline effect” will now be introduced into our CheShift server.
Conclusions
The structure of the NAB protein, a 116-residue α/β protein with 50% of its residues in loops and turns, was chosen to further evaluate the origin of differences between computed and observed 13Cα chemical shifts, as well as to study the influence of the nearest-neighbor residues on the computed 13Cα chemical shifts. The results indicate that computation of the 13Cα chemical shifts of a given residue in the sequence of the NAB protein is not influenced significantly by the nature of the nearest-neighbor amino acids, except for residues immediately preceding proline. For such residues, proline must be considered during the computation of the 13Cα chemical shifts; otherwise, an overestimation of the computed 13Cα chemical shifts of about +1.7 ppm occurs, which is in good agreement with experimental evidence (Wishart et al. 1995a; Schwarzinger et al. 2001; Wang and Jardetzky 2002).
From the point of view of satisfying the NOE constraints, the NAB and the NAB-13Cα ensembles of 20 conformers are of comparable quality (data not shown), with some differences observed in loops and turns with scarce NOE-derived constraints (see Fig. 4b). From the fits of the 13Cα chemical shifts the two ensembles are also of similar quality. The validation of a given protein structure in terms of both the NOEs and the 13Cα chemical shifts should, according to the present data, be improved if based on the use of larger ensembles of conformers compatible with the available data.
Acknowledgements
This research was supported by grants from the National Institutes of Health (GM-14312, GM-24893), the National Science Foundation (MCB05-41633), and the Joint Center for Structural Genomics (NIH/NIGMS grant U54-GM074898). Support was also received from the CONICET, FONCyT-ANPCyT (PAV 22642-2), and from the Universidad Nacional de San Luis (P-328501), Argentina. P. S. was supported by a fellowship from the Spanish Ministry of Science and Education and by the Skaggs Institute of Chemical Biology. Kurt Wüthrich is the Cecil H. and Ida M. Green Professor of Structural Biology at TSRI. The research was conducted using the resources of a Beowulf-type cluster located at the Baker Laboratory of Chemistry and Chemical Biology, Cornell University, and the resources of Pople, a facility of the National Science Foundation Terascale Computing System at the Pittsburgh Supercomputer Center.
References
- Aramini JM, Sharma S, Huang YJ, Swapna GVT, Ho CK, Shetty K, Cunningham K, Ma L-C, Zhao L, Owens LA, Jiang M, Xiao R, Liu J, Baran MC, Acton TB, Rost B, Montelione GT. Solution NMR structure of the SOS response protein YnzC from Bacillus subtilis. Proteins Struct Funct Bioinformatics. 2008;72:526–530. doi: 10.1002/prot.22064. [DOI] [PubMed] [Google Scholar]
- Carugo O, Pongor S. A normalized root-mean distance for comparing protein three-dimensional structures. Protein Sci. 2001;10:1470–1473. doi: 10.1110/ps.690101. [DOI] [PMC free article] [PubMed] [Google Scholar]
- Chesnut DB, Moore KD. Locally dense basis-sets for chemical-shift calculations. J Comp Chem. 1989;10:648–659. doi: 10.1002/jcc.540100507. [DOI] [Google Scholar]
- Cornilescu G, Marquardt JL, Ottiger M, Bax A. Validation of protein structure from anisotropic carbonyl chemical shifts in a dilute liquid crystalline phase. J Am Chem Soc. 1998;120:6836–6837. doi: 10.1021/ja9812610. [DOI] [Google Scholar]
- de Dios AC, Pearson JG, Oldfield E. Secondary and tertiary structural effects on protein NMR chemical shifts: An ab initio approach. Science. 1993;260:1491–1496. doi: 10.1126/science.8502992. [DOI] [PubMed] [Google Scholar]
- Frisch MJ, Trucks GW, Schlegel HB, Scuseria GE, Robb MA,Cheeseman JR, Zakrzewski VG, Montgomery JA, Stratmann REJr, Burant JC, Dapprich S, Millam JM, Daniels AD, Kudin KN,Strain MC, Farkas O, Tomasi J, Barone V, Cossi M, Cammi R,Mennucci B, Pomelli C, Adamo C, Clifford S, Ochterski J,Petersson GA, Ayala PY, Cui Q, Morokuma K, Malick DK,Rabuck AD, Raghavachari K, Foresman JB, Cioslowski J, OrtizV, Baboul AG, Stefanov BB, Liu G, Liashenko A, Piskorz P,Komaromi I, Gomperts R, Martin RL, Fox DJ, Keith T, Al-Laham MA, Peng CY, Nanayakkara A, Gonzalez C, Chal-lacombe M, Gill PMW, Johnson B, Chen W, Wong MW, AndresJL, Gonzalez C, Head-Gordon M, Replogle ES, Pople JA (2004) Gaussian 03, Revision E.01, Gaussian, Inc., Wallingford CT
- Havlin RH, Le H, Laws DD, de Dios AC, Oldfield E. An ab initio quantum chemical investigation of carbon–13 NMR shielding tensors in glycine, alanine, valine, isoleucine, serine, and threonine: Comparisons between helical and sheet tensors, and effects of χ1 on shielding. J Am Chem Soc. 1997;119:11951–11958. doi: 10.1021/ja971796d. [DOI] [Google Scholar]
- Iwadate M, Asakura T, Williamson MP. Cα and Cβ carbon–13 chemical shifts in proteins from an empirical database. J Biomol NMR. 1999;13:199–211. doi: 10.1023/A:1008376710086. [DOI] [PubMed] [Google Scholar]
- Koradi R, Billeter M, Güntert P. Point-centered domain decomposition for parallel molecular dynamics simulation. Comp Physics Commun. 2000;124:139–147. doi: 10.1016/S0010-4655(99)00436-1. [DOI] [Google Scholar]
- Kuszewski J, Qin JA, Gronenborn AM, Clore GM. The impact on direct refinement against 13Cα and 13Cβ chemical shifts on protein structure determination by NMR. J Magn Reson B. 1995;106:92–96. doi: 10.1006/jmrb.1995.1017. [DOI] [PubMed] [Google Scholar]
- Laskowski RA, MacArthur MW, Moss DS, Thornton JM. PROCHECK: a program to check the stereochemical quality of protein structures. J Appl Cryst. 1993;26:283–291. doi: 10.1107/S0021889892009944. [DOI] [Google Scholar]
- Luginbühl P, Szyperski T, Wüthrich K. Statistical basis for the use of 13Cα chemical shift in protein structure determination. J Magn Reson. 1995;109:229–233. doi: 10.1006/jmrb.1995.0016. [DOI] [Google Scholar]
- Luginbühl P, Güntert P, Billeter M, Wüthrich K. The new program OPAL for molecular dynamics simulations and energy refinements of biological macromolecules. J Biomol NMR. 1997;8:136–146. doi: 10.1007/BF00211160. [DOI] [PubMed] [Google Scholar]
- Martin OA, Villegas ME, Vila JA, Scheraga HA. Analysis of 13Cα and 13Cβ chemical shifts of cysteine and cystine residues in proteins: a quantum chemical approach. J Biomol NMR. 2010;46:217–225. doi: 10.1007/s10858-010-9396-x. [DOI] [PMC free article] [PubMed] [Google Scholar]
- Némethy G, Gibson KD, Palmer KA, Yoon CN, Paterlini G, Zagari A, Rumsey S, Scheraga HA. Energy parameters in polypeptides. 10. Improved geometrical parameters and nonbonded interactions for use in the ECEPP/3 algorithm, with application to praline-containing peptides. J Phys Chem. 1992;96:11941–11950. doi: 10.1021/j100194a068. [DOI] [Google Scholar]
- Pearson JG, Le H, Sanders LK, Godbout N, Havlin RH, Oldfield EJ. Predicting chemical shifts in proteins: structure refinement of valine residues by using ab initio and empirical geometry optimizations. J Am Chem Soc. 1997;119:11951–11958. doi: 10.1021/ja971461w. [DOI] [Google Scholar]
- Schwarzinger S, Kroon GJA, Foss TR, Chung J, Wright PE, Dyson HJ. Sequence-dependent correction of random coil NMR chemical shifts. J Am Chem Soc. 2001;123:2970–2978. doi: 10.1021/ja003760i. [DOI] [PubMed] [Google Scholar]
- Serrano P, Johnson MA, Chatterjee A, Neuman B, Joseph JS, Buchmeier MJ, Kuhn P, Wüthrich K. NMR structure of the nucleic acid-binding domain of the SARS coronavirus nonstructural protein 3. J Virol. 2009;83:12998–13008. doi: 10.1128/JVI.01253-09. [DOI] [PMC free article] [PubMed] [Google Scholar]
- Spera S, Bax A. Empirical correlation between protein backbone conformation and Cα and Cβ 13C nuclear magnetic resonance chemical shifts. J Am Chem Soc. 1991;113:5490–5492. doi: 10.1021/ja00014a071. [DOI] [Google Scholar]
- Sun H, Sanders LK, Oldfield E. Carbon-13 NMR shielding in the twenty common amino acids: comparisons with experimental results in proteins. J Am Chem Soc. 2002;124:5486–5495. doi: 10.1021/ja011863a. [DOI] [PubMed] [Google Scholar]
- Vijay-Kumar S, Bugg CE, Cook WJ. Structure of ubiquitin refined at 1.8 Å resolution. J Mol Biol. 1987;194:531–544. doi: 10.1016/0022-2836(87)90679-6. [DOI] [PubMed] [Google Scholar]
- Vila JA, Scheraga HA. Factors affecting the use of 13Cα chemical shifts to determine, refine, and validate protein structures. Proteins: Struct, Funct, Bioinformatics. 2008;71:641–654. doi: 10.1002/prot.21726. [DOI] [PMC free article] [PubMed] [Google Scholar]
- Vila JA, Scheraga HA. Assessing the accuracy of protein structures by quantum mechanical computations of 13Cα chemical shifts (2009a) Acc Chem Res. 2009;42:1545–1553. doi: 10.1021/ar900068s. [DOI] [PMC free article] [PubMed] [Google Scholar]
- Vila JA, Ripoll DR, Scheraga HA. Use of 13Cα chemical shifts in protein structure determination. J Phys Chem B. 2007;111:6577–6585. doi: 10.1021/jp0683871. [DOI] [PMC free article] [PubMed] [Google Scholar]
- Vila JA, Villegas ME, Baldoni HA, Scheraga HA. Predicting 13Cα chemical shifts for validation of protein structures. J Biomol NMR. 2007;38:221–235. doi: 10.1007/s10858-007-9162-x. [DOI] [PubMed] [Google Scholar]
- Vila JA, Arnautova YA, Scheraga HA. Use of 13Cα chemical shifts for accurate determination of β-sheet structures in solution. Proc Natl Acad Sci USA. 2008;105:1891–1896. doi: 10.1073/pnas.0711022105. [DOI] [PMC free article] [PubMed] [Google Scholar]
- Vila JA, Baldoni HA, Scheraga HA. Performance of density functional models to reproduce observed 13Cα chemical shifts of proteins in solution. J Comp Chem. 2008;38:884–892. doi: 10.1002/jcc.21105. [DOI] [PMC free article] [PubMed] [Google Scholar]
- Vila JA, Arnautova YA, Martin OA, Scheraga HA. Quantum-Mechanics-Derived 13Cα Chemical Shift Server (CheShift) for protein structure validation. Proc Natl Acad Sci USA. 2009;106:16972–16977. doi: 10.1073/pnas.0908833106. [DOI] [PMC free article] [PubMed] [Google Scholar]
- Villegas ME, Vila JA, Scheraga HA. Effects of side–chain orientation on the 13C chemical shifts of antiparallel β–sheet model peptides. J Biomol NMR. 2007;37:137–146. doi: 10.1007/s10858-006-9118-6. [DOI] [PubMed] [Google Scholar]
- Wang Y, Jardetzky O. Investigation of the neighboring residue effects on protein chemical shifts. J Am Chem Soc. 2002;124:14075–14084. doi: 10.1021/ja026811f. [DOI] [PubMed] [Google Scholar]
- Wishart D, Bigam CG, Holm A, Hodges RS, Sykes BD. 1H, 13C and 15N random coil NMR chemical shifts of the common amino acids. I. Investigation of nearest-neigbor effects. J Biomol NMR. 1995;5:67–81. doi: 10.1007/BF00227471. [DOI] [PubMed] [Google Scholar]
- Wishart D, Bigam CG, Yao J, Abildgaard F, Dyson H, Oldfield E, Markley J, Sykes B. 1H, 13C and 15N chemical shift referencing in biomolecular NMR. J Biomol NMR. 1995;6:135–140. doi: 10.1007/BF00211777. [DOI] [PubMed] [Google Scholar]
- Wüthrich K. NMR of proteins and nucleic acids. USA: Wiley; 1986. [Google Scholar]
- Xu XP, Case DA. Automatic prediction of 15 N, 13Cα, 13Cβ and 13C′ chemical shifts in proteins using a density functional database. J Biomol NMR. 2001;21:321–333. doi: 10.1023/A:1013324104681. [DOI] [PubMed] [Google Scholar]