

Abstract
Voltage-sensor domains (VSDs) are specialized transmembrane segments that confer voltage sensitivity to many proteins such as ion channels and enzymes. The activities of these domains are highly dependent on both the chemical and physical properties of the surrounding membrane environment. To learn about VSD-lipid interactions, we used nuclear magnetic resonance (NMR) spectroscopy to determine the structure and phospholipid interface of the VSD from the voltage-dependent K+ channel KvAP. The solution structure of the KvAP VSD solubilized within phospholipid micelles is similar to a previously determined crystal structure solubilized by a non-ionic detergent and complexed with an antibody fragment. Two differences observed include a previously unidentified short amphipathic α-helix that precedes the first transmembrane helix and a subtle rigid body repositioning of the S3-S4 voltage-sensor paddle. Using 15N relaxation experiments, we show that most of the VSD, including the pronounced kink in S3 and the S3-S4 paddle, is relatively rigid on the ps–ns time scale. In contrast, the kink in S3 is mobile on the μs–ms time scale and may act as a hinge in the movement of the paddle during channel gating. We characterized the VSD-phospholipid micelle interactions using nuclear Overhauser effect spectroscopy and show that the micelle uniformly coats the KvAP VSD and approximates the chemical environment of a phospholipid bilayer. Using paramagnetically labeled phospholipids, we show that bilayer-forming lipids interact with the S3 and S4 helices more strongly than with S1 and S2.
Keywords: NMR spectroscopy, Ion channel, Protein-lipid interactions, Membrane protein structure, Membrane protein dynamics
Introduction
Voltage-sensor domains (VSDs) are one of the principal molecular devices used to detect electrical potentials across lipid bilayers. These domains are characterized by a periodic set of positively charged residues (usually Arg) that move in response to changes in the membrane electrical potential. Movement of these “gating charges” can be used to arbitrate proton permeation pathways within the VSD itself 1; 2; 3; 4, drive the opening and closing (gating) of coupled ion conducting pore domains 5, or modulate the activity of linked enzyme domains 6.
Crystal structures of voltage-dependent potassium-selective (Kv) channels consist of four VSDs that surround a central ion conduction pore 7; 8; 9; 10. Independent movement of the VSDs synergistically act to gate the channel 11. The overall structures of VSDs are well conserved and consist of four transmembrane segments, termed S1 through S4, with the gating charges located along S4. These domains appear largely exposed to the membrane and their function is highly dependent on the chemical and physical properties of the lipid environment 12; 13; 14; 15. The charged phosphate group is especially important, as membranes devoid of phospholipids cannot support Kv channel function 14; 15. Furthermore, tarantula toxins that are known to partition into the membrane 16 interact with this domain and influence channel activity 17; 18.
Despite the growing appreciation for the importance of protein-lipid interactions, there is still much to be learned. The crystal structure of the eukaryotic Kv1.2-Kv2.1 “paddle chimera” contains a bilayer-like arrangement of co-crystallized lipids between the VSDs and the pore and between adjacent VSDs, but lipids are largely absent over the entire outer perimeter 10. Lipid molecules are critical for the correct channel conformation, as crystal structures determined in the absence of lipids contain distortions within the VSDs 7; 8. The exposure to membrane lipids of a prokaryotic Kv from Aeropyrum pernix (KvAP) and its isolated VSD has been inferred from electron paramagnetic resonance (EPR) spectroscopy using conjugated nitroxide probes 19; 20. Four transmembrane helices were clearly identified; however, these experiments suffer from poor spatial resolution due to the long tether length of the attached probes (~7 Å) and their interpretation rests on the assumption that the mutated residues do not affect the protein structure.
Here, we used nuclear magnetic resonance (NMR) spectroscopy to characterize the solution structure and dynamics of the isolated KvAP VSD encapsulated in a phospholipid micelle. Using this structure as the basis for further analyses, we were able to provide an atomic resolution description of the aqueous, hydrophilic and hydrophobic boundaries of the micelle and found that the phospholipid micelle approximates the chemical environment of a phospholipid bilayer. Next, we further characterized the association of bilayer-forming phospholipids using paramagnetically labeled compounds and showed that long-chain lipids preferentially interact with the S3 and S4 helices of the VSD. A recent study investigated the secondary structure and dynamics of the KvAP VSD solubilized in a mixture of the detergents n-dodecylphosphocholine (DPC) and lauryldimethylamine-N-oxide (LDAO) 21. Our results on the secondary structure and dynamics are in overall agreement with that paper.
Results
Solution NMR Structure of the KvAP VSD
Initially, we sought to identify conditions suitable for NMR spectroscopy by recording 1H–15N heteronuclear single-quantum coherence (HSQC) spectra at 25 ºC on uniformly 15N-labeled (15N) KvAP VSD solubilized in a variety of detergents. Gel filtration chromatograms suggest that the KvAP VSD is relatively stable and monodisperse in many detergents; however, NMR spectra in these detergents showed a wide range of appearances as judged by both the number and dispersion of observed peaks (Figure S1). The maltosides and glucosides, in particular, exhibited poor spectral dispersion and many fewer peaks than expected. In earlier work 7, this protein was extracted from Esherichia coli membranes using n-decyl-β-D-maltoside (DM) and crystallized in n-octyl-β-D-glucoside (OG), suggesting that poor spectral quality in these detergents were not likely due to an inconvenient property of the protein (aggregation or conformational heterogeneity), but rather some property of the detergent micelle or protein-detergent interactions. One of the most promising detergents, the short-chain phospholipid 1,2-diheptanoyl-sn-glycerol-3-phosphocholine (D7PC), enabled high quality spectra, and the KvAP VSD was stable, even at 45 ºC, for approximately one week before significant loss of signal intensity began to occur. The higher temperature was chosen for further experiments because additional peaks were observed in 1H–15N HSQC spectra compared to 25 ºC.
Resonance assignments for backbone (1HN, 15N, 13C′ and 13Cα) and 13Cβ nuclei at 45 ºC and neutral pH were identified using transverse relaxation optimized spectroscopy (TROSY) HNCA, HNCO, HN(CO)CA, HNCACB and 15N-edited 1H–1H nuclear Overhauser effect spectroscopy (NOESY) experiments 22 recorded using deuterated KvAP VSD samples (see Materials and Methods). These spectra permitted the assignment of approximately 65 % of the backbone nuclei. To resolve ambiguities, HSQC, HNCA and HNCO experiments were recorded on samples with different combinations of labeled amino acids so specific amino acids and amino acid pairs could be distinguished in crowded regions of the spectra: (1) 13C,15N Arg; (2) 15N Ile, 1-13C Val, 2-13C Leu; and (3) 1-13C,15N Leu, 2-13C Gly, 2,3-13C Ala. Resonance assignments were extended along the side chains using HC(C)H-COSY, and 13C-edited and 15N-edited NOESY experiments. Most ambiguities present among the methyl resonances were resolved by repeating the 13C-edited NOESY using methyl-specific labeling on Ile, Leu and Val residues (see Materials and Methods) 23. Complete backbone resonance assignments have been determined for 107 of the 147 residues, while 38 residues are partially assigned. Most of the partially assigned residues miss only their 13C’ assignment such that almost complete 1HN (97 %), 15N (90 %) and 13Cα (95 %) assignments have been determined. Importantly, peaks for 135 residues have been identified in HSQC spectra of the amide or methyl regions, providing easily accessible probes for nearly every residue within the KvAP VSD (Figure 1).
Figure 1. Amide and methyl resonance assignments for KvAP VSD in D7PC micelles.

(A) 1H 15N HSQC spectrum (21.1 T, 45 ºC) of 15N KvAP VSD with assignments. Main chain amide peaks for 132 residues (out of 141 expected to be observed; 5 Pro) and N17δ, Q49ε, and W70ε, side chains have been assigned. The missing residues are R6-D10, L26, S38, V42 and R117. Peaks that are aliased in the 15N dimension are colored black (A100 and Argε). (B) Enlarged view of the congested area in (A) within the dotted square. (C) 1H 13C HSQC spectrum (21.1 T, 45 ºC) of the Ile δ1 methyl region of 2H,13Cmethyl-ILV KvAP VSD in 98 % (v/v) D2O with assignments. Methyl peaks for all 11 lle have been identified. (D) Leu/Val methyl region of the spectrum shown in (C). Peaks for 84 methyl groups (out of 92 peaks expected to be observed from 16 Val and 30 Leu residues) have been identified. Missing assignments include L5δ1/δ2, L8δ1/δ2, L29δ1, L102δ2, L103δ1, L105δ1, L128δ1 and L129δ2. Peaks from D7PC are colored black.
The largely α-helical nature of this protein was observed both in the characteristic pattern of local nuclear Overhauser effect (NOE) cross-peaks in NOESY spectra and backbone dihedral angles derived from chemical shifts 24. However, the inter-helical packing arrangement was uncertain, as many side chain contacts were highly ambiguous, especially those between methyl groups which exhibit highly degenerate chemical shifts. To overcome this ambiguity, we divided the structure calculation into two stages (see Materials and Methods for more details). In the first stage, we refined the individual secondary structural elements using only dihedral restraints and unambiguous local distance restraints (consisting of interatomic 1HN, 1Hα and 1Hβ distances less than five residues apart). From these calculations, four helical regions were clearly distinguished, corresponding to the transmembrane helices S1-S4. We then added unambiguous long-range distance restraints (primarily aromatic-methyl and methyl-methyl interactions) to obtain an ensemble of loosely folded protein structures. During our second stage, we gradually incorporated additional local and long-range distance restraints based on the previously determined set of structures. In this manner, we could steadily reduce or eliminate NOE ambiguities (Table 1 and Figure 2). The final set of solution KvAP VSD structures is well defined overall with an average root-mean-square deviation (r.m.s.d.) from the mean coordinates of 1.22 Å for α-carbons in residues P25-K147 (Figure 3).
Table 1.
NMR Structure and Refinement Statistics for KvAP VSD
|
NMR Restraints | |
| Distance restraints (NOE) | |
| Intraresidue (i = j) | 220 |
| Medium range (|i − j| ≤ 4) | 777 |
| Long range (|i − j| > 4) | 155 |
| Total | 1152 |
| Dihedral restraints (TALOS) | |
| φ | 126 |
| ϕ | 126 |
| Total | 252 |
|
Structure Statistics | |
| Ensemble r.m.s.d. (residues P25-K147) | |
| Backbone heavy atoms (Å) | 1.22 |
| All heavy atoms (Å) | 1.61 |
| NOE violationsa | |
| ≥ 0.1 Å | 42.2 ± 5.5 |
| ≥ 0.3 Å | 4.7 ± 2.2 |
| ≥ 0.5 Å | 0.0 ± 0.0 |
| R.m.s.d from experimental restraintsa | |
| Distances (Å) | 0.041 ± 0.003 |
| Dihedrals (°) | 0.3 ± 0.1 |
| R.m.s.d. from idealized geometrya | |
| Bond lengths (Å) | 0.004 ± 0.001 |
| Bond angles (°) | 0.48 ± 0.02 |
| Impropers (°) | 0.34 ± 0.02 |
| Ramachandran plotb (residues L11-R151) | |
| Most favorable (%) | 92.0 ± 1.3 |
| Additionally allowed (%) | 6.9 ± 1.5 |
| Generously allowed (%) | 0.8 ± 0.7 |
| Disallowed (%) | 0.1 ± 0.5 |
Xplor-NIH;
Procheck NMR
Figure 2. Summary of NMR restraints used to define the KvAP VSD structure.

Secondary structural elements (2º) are shown above the amino acid sequence (1º) and highlighted in grey. The VSD helices are identified by the pattern of secondary chemical shifts for 13C′, 13Cα and 13Cβ (Δδ(13CX); corrected for 2H isotope shifts 60 and graphed from −5 ppm to +5 ppm) 61 plotted below the amino acid sequence, and the sequential and medium-range NOE cross-peaks (dXY) indicated by black lines connecting the residues (the subscripts α = 1Hα, β = 1Hβ and N = 1HN indicate the atoms involved; for Pro residues, 1Hδ was used in place of 1HN). The long-range NOE cross-peaks (di,j) that define the tertiary fold are also shown. The total number of long-range (L; |i − j| > 4), medium-range (M; 1 < |i − j| ≤ 4) and sequential (S; |i − j| = 1) NOEs are plotted (graphed from 0 to 20 NOEs) above the ensemble r.m.s.d. from the mean coordinates (for residues L11-R151; graphed from 0 to 10 Å).
Figure 3. Solution structure of the KvAP VSD.

(A) Stereo image of the 20 lowest energy structures (α-carbon trace) superimposed using residues P25-K147. Helical segments are colored dark grey while loops are red. The first seven residues (L5-D10) are unconstrained (and unstructured in the ensemble) and have been removed for clarity. (B) A ribbon representation of the structure closest to the mean coordinates. The transmembrane (S1, S2, S3a, S3b, S4) and other helices (S0, S2/3) are labeled. This and all other structure figures were generated using the program PyMOL 62.
Comparison of VSD Structures
The solution structure (closest to the mean coordinates) of KvAP VSD in D7PC micelles closely resembles the crystal structure of KvAP VSD solubilized in OG and complexed to an antibody fragment (Figure 4A) 7. The first two transmembrane helices, S1 and S2, comprise the region that is the most similar between the two structures, with an r.m.s.d. of 1.41 Å for α carbons in residues H24-E45 (in S1) and Y59-Y78 (in S2). The largest deviation within this region is a tilt in the extracellular end of S2 by ~2 Å. Surprisingly, S1 and S2 superimpose much better onto the Kv1.2-Kv2.1 paddle chimera crystal structure 10, with an r.m.s.d. of 0.84 Å (residues A162-E183 and F223-F242) (Figure 4B). These helices are especially stable as amide protons from residues in both S1 (I40, V41, V43, V44) and S2 (V61-A77) are resistant to exchange with solvent when placed in a D2O buffer and are likewise absent or have reduced amplitude in spectra of deuterated samples (Figure S2).
Figure 4. Comparison of VSD structures.

(A) Superposition of KvAP VSDs determined by crystallography (chartreuse) and NMR spectroscopy (closest structure to the mean coordinates; red) using α-carbons of residues H24-E45 in S1 and Y59-Y78 in S2. (B) Superposition the KvAP VSD NMR structure and the Kv1.2-Kv2.1 paddle chimera VSD crystal structure (using α-carbons of residues A162-E183 and F223-F242). The Kv1.2 (light blue) and Kv2.1 (dark blue) portions of the chimera are colored separately.
Prior to S1, the NMR structure of KvAP VSD contains a short ~10 residue amphipathic α-helix (S0) that lays approximately perpendicular to the four transmembrane helices. This helix was not modeled in the crystal structure as no significant electron density was observed for the first 15 amino acids 7. The helical structure of this region is clearly identified by local NOEs; however, the precise position of this helix is not well determined as few long range NOEs were observed. Those that could be identified involve residues at the intracellular end of S2, suggesting that S0 likely resides in a similar position to an analogous helix in eukaryotic Kv channels (Figure 4B) 10. This helix is required for high-level KvAP VSD expression in E. coli as expression is barely detectable using a construct that begins at M22 (removing S0) but is only slightly reduced when only the first 10 residues that precede S0 are removed (data not shown). The amphipathic nature of this helix and its position at the edge of the VSD structure suggests that it interacts with the interfacial region of the D7PC micelle.
The largest difference between the solution and crystal structures occurs in the S3b-S4 “paddle” region. In the structure closest to the mean coordinates, S4 is shifted closer to S2 by ~3 Å while S3 is further from S1 by ~5 Å resulting in a ~23º twist in the orientation of the paddle with respect to S1 and S2 (Figure 4A). When compared to the NMR ensemble, the crystal structure paddle is an outlier (Figure S3) and the different paddle positions likely indicate genuine structural variation. The close association between S2 and S4 in solution is evidenced by the many NOEs observed between the side chains of residue Y46 (S2) and residues R126 and I127 (S4). For the crystal structure, the KvAP VSD was co-crystallized with an antibody fragment that binds to an epitope at the tip of the paddle 7; 25; 26; 27. The altered paddle position reflects the pliability of this region and suggests that the paddle may adopt slightly different conformations depending on the immediate lipid (or detergent) environment. The overall structure of the paddle remains similar (r.m.s.d. is 0.80 Å for residues A100-R126) suggesting that the paddle is repositioned as a nearly rigid unit. Notably, the positions of R133, K136 and the hydrophobic “phenylalanine gap” residue L69 between them near the center of the domain are in identical locations, suggesting that small changes at the periphery of the protein are not transferred to the central packed core.
Backbone Dynamics of KvAP VSD
Both the crystal and NMR structures of the KvAP VSD reveal a significant kink in the middle of S3 that divides this helix into two separate segments (S3a and S3b). This structural distinction is reflected by avidin accessibility to tethered biotin during KvAP channel activity 25; 26; 27. While residues in S3a remain static throughout the gating cycle, some residues in S3b are externally accessible only when the membrane is depolarized and the channel is open. This region contains a highly conserved Pro residue (P99) and has been suggested to serve as a hinge to permit movement of S3b and S4 during channel gating 27; 28.
To determine the inherent flexibility within the KvAP VSD, we probed the backbone dynamic properties using TROSY-detected 15N relaxation measurements at 14.1 T. Similar experiments have been performed on the KvAP VSD in DPC/LDAO micelles 21. Our dynamics data are in excellent agreement with those results. For a large protein-micelle system, the amide longitudinal 15N relaxation rate constants (R1) and {1H}–15N heteronucler nuclear Overhauser enhancements (hetNOE) are sensitive indicators of fast, picosecond-to-nanosecond (ps–ns) time scale motion. Residues at the N- and C-termini display larger R1 (>1 s−1) and lower hetNOE (<0.4), characteristic of highly flexible residues (Figure 5AB). The S0 helix is also highly mobile, consistent with its poor placement within the NMR ensemble. The S1-S2 loop contains some residues with low hetNOE (<0.6), but the remainder of the protein is relatively rigid and both the S2-S3 region and the break in S3 have relaxation characteristics similar to that of the transmembrane helical elements (average hetNOE is 0.73 for residues in S1 and S2). Thus, these regions are likely static elements of the structure with little flexibility. The rigidity of the S3 kink suggests that this extended structure is stable on the ps–ns time scale even in a micelle environment.
Figure 5. Backbone dynamic measurements.
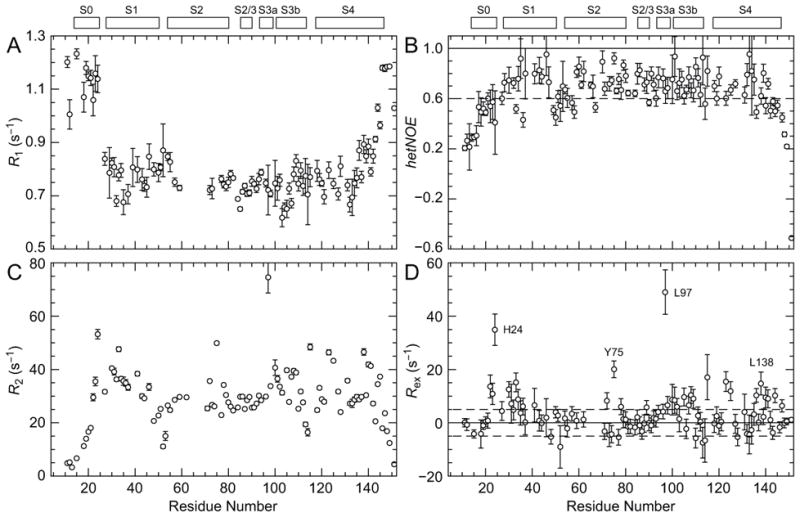
(A) R1, (B) hetNOE and (C) R2 backbone 15N relaxation measurements for 2H,15N KvAP VSD in D7PC micelles (14.1 T, 45 ºC) are plotted versus residue number. (D) Rex rates calculated using κ = 1.65 ± 0.19 is the average R2/ηxy ratio for residues not subject to chemical exchange line broadening. Select residues with large Rex are labeled. Secondary structural elements are depicted at the top of the figure.
One characteristic of the amide HSQC (Figure 1A) is that peaks have a wide range of signal intensities. Several residues within S3, notably L97 within the S3 kink, have significantly lower than average signal intensity. Chemical exchange provides an additional relaxation mechanism when a nuclear spin experiences a fluctuating environment and is a sensitive indicator of conformational changes on the microsecond-to-millisecond (μs–ms) time scale. To determine if reduced signal intensities are a result of peak broadening due to chemical exchange, we measured amide 15N transverse relaxation rate constants (R2). Like R1, R2 is sensitive to fast time scale motion as evidenced by the decreased R2 seen at the N- and C-termini (Figure 5C). However, large outlying R2 is observed for several residues throughout the VSD indicating these sites likely experience additional peak broadening.
We estimated the chemical exchange contribution to R2 (Rex) using a TROSY-based Hahn-echo transverse relaxation experiment 29. This method uses the transverse 1H–15N dipolar/15N chemical shift anisotropy interference rate constants (ηxy) to determine R2 rates that are independent of chemical exchange (see Materials and Methods and Figure S4). For most of the residues in KvAP VSD, Rex rates are close to zero (|Rex| < 5 s−1) indicating chemical exchange is not present (Figure 5D). Four regions, typified by the residues H24, Y75, L97 and L138, have large Rex (>10 s−1) and are mobile on the μs–ms time scale. L97 in particular has the largest Rex suggesting that the S3 kink may serve as a hinge in the movement of the paddle in response to changes in membrane voltage.
In the isolated VSD construct, residues R117 to K147 form a continuous helix, S4. However, in the full-length channel, S4 is expected to break and form the “S4-S5 linker” helix that connects the VSD to the ion conduction pore 8. In the Kv1.2-Kv2.1 paddle chimera crystal structure, this break occurs at residues H310-K312 10. In the VSD structural alignment (Figure 4B) these residues reside near L138, which exhibits chemical exchange peak broadening along with nearby residues. Thus, although the KvAP pore domain has been removed in the VSD construct, it appears that a vestige of the S4-S5 linker remains and the observed chemical exchange is likely due to transient helix breaks in this region.
Two other regions also exhibit elevated R2: around residues H24 and Y75. H24 is located in the short loop between S0 and S1, and Y75 is found at the C-terminal end of S2 and interacts with residues in S0. Thus, these two residues are expected to be sensitive to the position of S0. The chemical exchange peak broadening observed for H24 and Y75 is consistent with μs–ms time scale repositioning of S0. Combined with the high R1 and low hetNOE, this suggests that S0 exhibits mobility across multiple time scales, further supporting the hypothesis that S0 is dislodged in the absence of a membrane bilayer
Using the R2/R1 ratio for residues in the transmembrane helices, we determined that the KvAP VSD has an isotropic rotational correlation time of 19.8 ± 0.1 ns at 45 ºC. This value is close to the 18.4 ns calculated for KvAP VSD in DPC/LDAO (also at 45 ºC) 21, which suggests that the D7PC and DPC/LDAO micelles are of comparable size. Based on similar measurements on soluble globular proteins 30; 31, the KvAP VSD in D7PC micelles has an apparent particle size of approximately 50–60 kD. This is in agreement with the similarly sized β-barrel proteins OmpX 32, OmpA 33 and PagP 34 and suggests that the KvAP VSD is a monomer in the current conditions.
KvAP VSD-Micelle Interactions
The NOESY spectra used for calculating the NMR ensemble of structures also contains information regarding water and detergent molecules at the protein surface. In a D7PC micelle, the molecules form a continuous surface that surrounds the KvAP VSD and individual D7PC molecules cannot be distinguished. While many NOEs at the water resonance could be identified, D7PC resonances (Figure S8) are overlapped with protein resonances so unambiguous assignment of detergent NOEs was impossible for many residues. To overcome this limitation, we utilized a 13C-filtered NOESY experiment 35 whereby protons that are bound to 13C atoms are removed from our spectra. Thus, by using a 13C,15N KvAP VSD sample, we eliminated most protein NOEs, leaving only detergent NOEs in the aliphatic portion of the spectrum. Notably, we did not filter out signals from protons attached to 15N nuclei so that NOEs to amide 1HN could be used to confirm our assignment of the protein resonance.
Inspection of the water and detergent NOEs reveals a noticeably graded pattern (Figure 6). Consistent with the native transmembrane locale of the VSD, NOEs to water and the hydrophilic choline headgroup and glycerol backbone portions of D7PC are restricted to the intracellular and extracellular ends of the VSD (Figure 6A-C). NOEs at the water resonance may be a result of a direct interaction with water (either via NOE or the physical exchange of a proton) or a NOE to a nearby group that exchanges with water (a relayed NOE). In either case, water NOEs indicate regions of the protein that are near an aqueous environment. NOEs to the aliphatic tails of D7PC are distributed throughout much of the protein and are particularly dense along the transmembrane helices (Figure 6D, E). Many residues have NOEs to multiple D7PC protons, which is due to the dynamic nature of the micelle structure and 1H spin diffusion within individual D7PC molecules. Nevertheless, there is a subtle distinction between NOEs to the two aliphatic positions closest to the glycerol backbone (Figure 6D) and the last four positions that include the methyl tail (Figure 6E). Although many residues exhibit NOEs to both sets of aliphatic protons, residues near the ends of the helices typically have more intense NOEs to the first two positions, while the reverse is true for more centrally located residues.
Figure 6. VSD-micelle interactions.

NOE crosspeaks to (A) water, and to the D7PC (B) choline headgroup, (C) glycerol backbone, (D) first two aliphatic carbons and (E) last four aliphatic carbons are mapped onto the solution structure of KvAP VSD. The diagram highlights the regions of D7PC included in the mapping (not drawn to scale). For NOEs to D7PC, the peak intensities were normalized by the number of D7PC protons and the single most intense NOE is shown with a darker color. (F) Histogram of NOEs to the transmembrane helices (S1-S4) as a function of the distance from the center of the VSD.
Using only the transmembrane helices (S1-S4), the distribution of NOEs along the transmembrane axis of the KvAP VSD closely resembles the dimensions of a lipid bilayer (Figure 6F). NOEs to the aliphatic tails of D7PC are observed over a span of 30 Å, centered about the middle of the VSD (approximated by residues V39, I64, V98 and I131 in S1-S4, respectively). NOEs to the hydrophilic headgroup and backbone occur within a 10 Å segment on both sides of the VSD, overlapping 5 Å with the aliphatic NOEs, providing a total thickness of 40 Å. Consequently, the D7PC micelle approximates the dimensions and chemical environment of a membrane bilayer 36.
Paramagnetic phospholipid interactions
To investigate KvAP VSD interactions with bilayer-forming lipids, we initially added several different lipids into D7PC solubilized 15N KvAP VSD in a stepwise fashion. While we observed changes in many peak positions in HSQC spectra, incorporation of more than a few millimolar of lipid significantly reduced signal intensities and degraded the overall spectral quality. As an alternative approach to study long-chain lipid interactions, we chose to incorporate paramagnetically labeled lipids into KvAP VSD samples 37. Freely diffusing lipids have the opportunity to interact with the entire hydrophobic surface of the protein and the paramagnetic enhancement in spin relaxation (ε) is a combined function of both the average distance and residence time. A similar method, using paramagnetically labeled fatty acids, has been used successfully to study the lipid interacting surface of OmpX 38 and membrane-associated peptides 39; 40.
The stepwise addition of 1-palmitoyl-2-stearoyl-sn-glycero-3-phosphocholine (PSPC) with the paramagnetic group Doxyl incorporated at position 16 of the stearoyl chain (16-Doxyl PSPC) elicits a significant decay in signal intensities for many residues in the KvAP VSD (Figure 7A). To determine the relaxation enhancement, we used the peak intensity ratio from separate 16-Doxyl PSPC (IDOXYL) and PSPC (IPSPC) titrations. The PSPC titration was used to control for small, but measurable shifts in the peak positions and to account for any changes in the sample over time. We limited the amount of lipid to only a few lipid molecules per micelle so that the relaxation enhancement is proportional to the bulk concentration of lipid. Although the lipids are not likely bilayered in nature at these concentrations, the magnitude of ε provides a measure of the relative affinity for long-chain lipids at a given region of the protein.
Figure 7. Paramagnetic lipid titration.

(A) Measurement of paramagnetic relaxation enhancement, ε, for residues along S4 in the 15N-GSRKF KvAP VSD sample. (B) Relaxation enhancement values are plotted for all residues. Inset shows ε for selected side chains. For some peaks, indicated by a red asterisk, ε was too large to be measured and the bar is drawn to 8 mM−1. Secondary structural elements are depicted above the graph. (C) Data in (B) mapped onto the surface of the KvAP VSD using a linear gradient between white (ε = 0 mM−1) and red (ε ≥ 4 mM−1). Residues with unknown ε are colored grey. The left image is in the same orientation as Figure 3B.
Due to the large degree of overlap in 1H–15N HSQC spectra, we employed several samples with different combinations of labeled amino acids to adequately probe the VSD. Aside from a uniformly labeled 15N sample, we used 15N labeled Gly, Ser, Arg, Lys and Phe (15N-GSRKF), and 15N labeled Gly, Ser, Ala, Ile, Leu and Val (15N-GSAILV) samples. These were purified exactly the same way and contained sets of overlapping residues that exhibited matching relaxation enhancement (Figure S6), thus establishing the reproducibility of our measurements.
Titration data for residues in S4 illustrates the typical behavior for the transmembrane helices (Figure 6A): ε is close to zero near each end of the helix and gradually increases for residues deeper in the micelle. This basic mounded feature clearly distinguishes all four transmembrane helices and the apices identify the center of each helix (Figure 7B). In S4, G134 and S135 have the maximum relaxation enhancement where the signal is almost completely eliminated at our first data point (estimated to be ~1 lipid/micelle). When mapped onto the KvAP VSD solution structure (Figure 7C), the helical centers cluster to the middle of the domain and likely represent the most centrally located portion of the VSD when embedded in a membrane bilayer.
One prominent feature of the paramagnetic relaxation properties is that the maximal ε is not the same for each of the four transmembrane helices. For S1 and S2, the maximum ε is ~3 mM−1, whereas residues in both S3 and S4 have ε that is larger than what we could measure (~8 mM−1). This suggests that helices S3 and S4 interact more favorably with the spin-labeled PSPC than S1 and S2. This discrepancy between helical segments is not due to the Doxyl group alone, as a similar titration using a Doxyl-labeled fatty acid did not show such a pronounced difference in relaxation enhancements (Figure S7).
Discussion
The goal of this study was to provide a comprehensive description of a VSD within the context of a phospholipid environment. Although a high-resolution crystal structure of the KvAP VSD had already been determined 7, it was unclear whether this structure represents the native membrane-embedded conformation since it was solubilized in a non-ionic detergent and complexed with an antibody. Antibodies to the paddle inhibit KvAP activity by locking the VSD in a conformation that presumably resembles an inactivated state of the channel 11; 26. It has been shown that KvAP cannot function in the absence of phospholipids, and the addition of intermediate-chain 1,2-didecanoyl-sn-glycerol-3-phosphocholine (D10PC) is sufficient to restore channel function 14. In our present case, the phospholipid environment is micellar in nature so the physical properties of a membrane bilayer are not entirely native but the chemical features surrounding the KvAP VSD should be similar to those of a membrane. This proved to be a fruitful approach as the solution and crystal structures exhibit several differences throughout the VSD. By comparing these two structures, we can provide insight into the natural conformational variability found within this domain.
An emerging theme in Kv channel structure is the conformational freedom of the S3b-S4 paddle 41. This region occupies a diverse set of conformations relative to the rest of the domain in crystal structures of Kv VSDs 7; 8; 10 and other related channels 42. This region is unique because it exists outside the set of co-evolved residues in the Kv family 28 and this segment can be transferred among Kv (and related) channels while maintaining function 43. The slightly different conformations observed in solution and crystal experimental conditions provide further support for its inherent mobility. The different paddle positions observed in other Kv and related channels is not solely due to differences in the amino acid composition of this region, but also appears due to its flexibility as a unit.
One significant similarity between the solution and crystal structures is the presence of the kink in S3. This elongated structure persists over four residues (L97-A100) that reside in the middle of the micelle. Residues at each end of this extended sequence (V98 and L102) are some of the most strongly affected by the spin-labeled lipid and are expected to reside at the center of the membrane. The fact that this extended conformation exists in both structures and is relatively ordered on the ps–ns time scale signifies its stability in a micelle environment. The irregularity of this structure and the presence of a highly conserved Pro residue have led to the suggestion that this region acts as a hinge in the movement of the paddle. Chemical exchange peak broadening observed for L97 (Figure 4B), which is consistent with motion on the μs–ms time scale, provides experimental support for this hypothesis.
The solution structure identified an additional α-helix in the KvAP VSD at the N-terminus, S0, which is also observed in the Kv1.2-Kv2.1 paddle chimera structure 10. This helix was not modeled in the KvAP VSD crystal structure, perhaps because of its flexibility across multiple time scales prevented significant electron density to be observed. S0 is roughly positioned between the intracellular ends of S1 and S2, and the mix of NOEs to water, hydrophilic and hydrophobic D7PC resonances establish its interfacial location. This helix is conserved among other VSDs and, in the context of a membrane bilayer, this helix may perform a structural role in supporting S1 and S2. This helix-forming segment is required for high-level KvAP VSD expression and we suggest it is an integral part of the VSD overall fold.
Using the solution structure as our reference, we characterized the protein-phospholipid micelle interactions at atomic detail. We observed an expected pattern of NOE crosspeaks: water and hydrophilic D7PC NOEs were observed only for the most intracellular and extracellular portions of the VSD and the transmembrane segments were encircled by NOEs to the aliphatic D7PC chains. The hydrophobic boundary identified by these experiments is ~33 Å which is similar to the hydrophobic thickness of a membrane but is much longer than the hydrophobic tails of D7PC (~7 Å). A similar incongruity was observed for OmpX within 1,2-dihexanoyl-sn-glycerol-3-phosphocholine (D6PC) micelles 32 and suggests that the hydrophobic surface of the protein determines the micelle size. This analysis provides a clear description of the micellar environment that surrounds the VSD and suggests that, under these conditions, the solution structure of the VSD approximates a membrane-embedded conformation. This conclusion is further supported by the similarity in amide peak positions in HSQC spectra between this sample and the KvAP VSD embedded in lipid-protein nanoparticles 44.
Using paramagnetically labeled phospholipids, we identified the primary interaction sites for bilayer-forming lipids. In a native membrane, closely associated lipids engulf the entire outer perimeter of the VSD. Indeed, EPR accessibility studies suggest that all four transmembrane helices are equally exposed to the lipid environment in the isolated KvAP VSD 19. However, the experiments shown here suggest that these lipids will not interact uniformly along the transmembrane surface of the KvAP VSD.
The larger apparent affinity for PSPC along S3 and S4 might reflect greater actual affinity for phospholipids near this region. Although it is unknown which segment of PSPC would be specifically recognized by the VSD, the phosphatidylcholine headroup and glycerol backbone are likely candidates due to the abundance of specific interactions that are possible. As KvAP channel activity is abolished in the absence of a phospholipid membrane, Arg-phosphate interactions along S4 could provide a mechanism for increased phospholipid affinity in this region. In this case, D7PC molecules might also bind to this site but remain undetected in the absence of a Doxyl group. The association of lipid molecules is expected to be intermediate to fast on the chemical shift time scale since separate lipid chemical shifts are not observed in NOESY spectra for residues S3 and S4. This time scale is consistent with the small, but significant, Rex values observed for many residues in S3b and S4 (Figure 5D).
Alternatively, instead of a specific lipid binding site, PSPC might compete less effectively with D7PC along S1 and S2 than along S3 and S4. The surface hydrophobicity is similar among the four transmembrane helices in the KvAP VSD, with the regions most strongly affected by Doxyl PSPC being slightly hydrophilic (Figure S9). The S1 and S2 helices might present a generic hydrophobic surface that is more equally satisfied by detergents and long-chain lipids. These are stable helices that are immobile during the gating cycle of Kv channels and may buttress the VSD during movement of the paddle and other regions of the protein 27; 28. This may be a general feature of similar supporting helices in that their conformation and dynamic properties are less connected to the membrane milieu. In contrast, S3 and S4 could have less uniform hydrophobic surfaces that might partially be a result of irregular structure within the membrane. Although S4 is fully α-helical in the KvAP VSD structures determined to date, a 10 residue segment of S4 exists as a 310-helix in the Kv1.2-Kv2.1 paddle chimera crystal structure, and an α-to-310 transition has been proposed to move the gating charges across the lipid bilayer 10
While we do not know the precise mechanism by which PSPC asymmetrically interacts along the transmembrane surface, it appears that S3 and S4 have a more specific interaction with phospholipids. Thus, these helices are more sensitive to the immediate lipid environment and may be responsible for the altered channel behavior in the presence of different lipids and different mechanical states of the membrane. Further experiments are needed to delineate the specific mechanisms by which the KvAP VSD interacts with the lipid environment.
NMR spectroscopy has become a valuable technique for the study of integral membrane proteins. Here we used NMR to determine structure and dynamics of a VSD and characterize its interactions with short- and long-chain phospholipids in the context of a phospholipid micelle. The atomic description of the micelle environment and the difference in affinity for membrane lipids along the protein surface likely could not have been obtained using other methods. The approach used here is broadly applicable, and is expected to provide additional insight into the structure, dynamics and lipid interactions of other integral membrane proteins.
Materials and Methods
KvAP VSD sample preparation
To produce uniform isotopically-enriched KvAP VSD samples, XL-1 Blue cells (Stratagene), transformed with an expression vector 7, were grown in LB broth at 37 ºC until the optical density (measured at 600 nm) reached ~0.8. The cells were then centrifuged for 10 min at 3,000 g and resuspended in a half-volume of M9 minimal medium (concentrating the cells two-fold) supplemented with 1 g/L of ISOGRO (Sigma-Aldrich) and 10 mg/L thiamine using the appropriate isotopic enrichment as needed. After 1 h, protein expression was induced by the addition of 0.5 mM isopropyl-β-D-thiogalactopyranoside (IPTG) and the cells were harvested 12–16 h later. By comparing spectra of deuterated and non-deuterated samples, the average deuterium incorporation was estimated to be ~50 % at non-exchangeable sites but greater than 90 % at the alpha positions.
For amino acid-specific and methyl-specific labeling patterns, a similar expression procedure was employed. To specifically label amino acids, the ISOGRO supplement was omitted and the isotopically enriched amino acid (sodium salt) was included in the M9 media at 50–100 mg/L and all non-labeled amino acids were included at 100–200 mg/L. Similarly, to specifically label Ileδ1 and/or Leuδ/Valγ groups (denoted 13Cmethyl), 50 mg/L of sodium 2-keto-4-13C-butyrate (for Ile) and 100 mg/L of sodium 2-keto-3-methyl-d3-4-13C butyrate (for Leu/Val) were added in lieu of their respective amino acids 23. It should be noted that for Leuδ and Valγ methyl groups labeled in this manner, one group within the pair is 13CH3 while the other 12CD3.
For all samples, KvAP VSD was purified essentially as described 7, with the desired detergent and buffer components adjusted during the final Superdex 200 gel filtration purification step. Initial screening of detergent conditions used 20 mM Tris, pH 8.0, 100 mM KCl and detergent concentrations at least twice the critical micelle concentration. The optimized conditions consisted of 20 mM 4-(2-hydroxyethyl)-1-piperazine ethanesulfonic acid (HEPES), pH 7.0, 20 mM KCl, 5 mM D7PC. Fractions containing KvAP VSD were concentrated to between 0.1 and 0.5 mM, and 10 mM 4,4-dimethyl-4-silapentane-1-sulfonic acid (DSS) was added as an internal reference. For samples purified in H2O, 10 % (v/v) D2O was also added. For all samples, the detergent concentration listed is that of the gel filtration buffer. The final KvAP VSD samples consist of 147 residues: L5-K147 from KvAP plus a remnant of the thrombin site (LVPR) attached to the C-terminus. We note that a Leu (L5) replaces the first five residues in the KvAP coding sequence, MARFR 7.
NMR Data Collection and Analysis
NMR experiments were performed using Bruker Avance or Avance II instruments at the New York Structural Biology Center, operating at static magnetic field strengths of 14.1, 18.8 and 21.1 T, equipped with z-shielded gradient triple resonance TCI or TXI cryogenic probes. The sample temperature was maintained at 25 ºC during the initial screening of detergent and buffer conditions, and 45 ºC for all other experiments. NMR spectra were processed using the NMRPipe software package 46 and analyzed using the program Sparky 47.
Chemical Shift Assignments
Resonance assignments for backbone 1HN, 15N, 13C′ and 13Cα, and 13Cβ nuclei were identified using three-dimensional (3D) TROSY HNCA (at 21.1 T), HNCO, HN(CO)CA and HNCACB (at 18.8 T) experiments 22; 48 performed using 0.3 mM 2H,13C,15N samples. Also, 2D TROSY HSQC and 3D 15N-edited NOESY (mixing times, τmix = 80 and 200 ms) experiments (at 21.1 T) were recorded on a 0.3 mM 2H,15N sample. In addition to uniformly labeled samples, 2D HSQC, HNCA and HNCO experiments (at 18.8 T) were recorded on 0.3 mM samples with varied amino acid-specific labeling patterns designed to eliminate ambiguities: (1) 13C,15N Arg; (2) 15N Ile, 1-13C Val, 2-13C Leu; and (3) 1-13C,15N Leu, 2-13C Gly, 2,3-13C Ala. For the 3D experiments, 1024 × 25–32 complex points were collected in the observed 1H × 15N dimensions with spectral widths of 12.5 × 25.6 ppm. In the 13C dimensions, 64, 64, 50 and 48 complex points with 15, 23, 16 and 10 ppm spectral widths were used for the HNCA, HNCACB, HN(CO)CA and HNCO, respectively. The NOESY experiments also used 128 complex points and 12.5 ppm spectral widths in the indirect 1H dimensions. The 2D experiments using specific amino acid labels were acquired with approximately two-fold more complex points in the indirectly detected dimensions.
Side-chain resonance assignments were based on 3D HC(C)H-COSY, 13C-edited (aromatic and aliphatic) and 15N-edited NOESY (τmix = 80 ms) experiments (at 21.1 T) recorded on 0.5 mM 13C,15N samples in 99.9 % (v/v) D2O and a 3D 15N-edited 1H–1H NOESY (τmix = 80 ms) experiment (at 21.1 T) recorded using a 0.5 mM 15N sample. To improve resolution within the Val and Leu methyl regions, a 3D 13C-edited NOESY (τmix = 100 ms) experiment was recorded on a 13Cmethyl-LV sample. The HC(C)H-COSY was acquired with 512 × 96 × 64 complex points and 7.8 × 7.8 × 44 ppm spectral widths in the observed 1H × indirect 1H × 13C dimensions. The NOESY experiments used 1024 × 256 complex points and 12.5 × 10–12.5 ppm spectral widths in the observed × indirect 1H dimensions, and 32, 64, 48 and 32 complex points for the 13C (aromatic), 13C (aliphatic), 15N, and 13C methyl dimensions with spectral widths of 22, 30, 25.6 and 15 ppm, respectively. Stereochemical assignments for Leu and Val methyl groups were determined using 2D 1H–13C constant-time HSQC experiments (at 21.1 T), with constant-time periods set to 13.3 ms (≈ 1/1JCC) and 26.6 ms (≈ 2/1JCC), recorded on a 10 %-13C fractionally labeled sample in 99 % (v/v) D2O 49. The same HC(C)H-COSY and 13C-edited NOESY experiments were also used to assign the D7PC resonances (see Figure S8).
Structure Calculations
Structure calculations were carried out using the simulated annealing protocol in Xplor-NIH 50; 51 and chemical shift-derived dihedral and NOE-derived distance restraints. Backbone φ and ϕ dihedral restraints were determined from 15N, 13C′, 13Cα and 13Cβ chemical shifts using the program TALOS 24. Unambiguous (“good”) matches were used and the error for the dihedral restraint was adjusted to be at least 20 degrees. Internuclear 1H–1H distance restraints were determined from the signal intensities in NOESY spectra. A wide range of peak amplitudes was observed where residues that reside within the hydrophobic interior of the micelle generally exhibiting significantly reduced signal intensity. To reduce underestimation of interproton distances, the NOE peaks were first divided into two groups of residues based on their signal intensities in 2D spectra: one group consisted of residues from the four transmembrane helices and short intervening loops; the other contained residues from the N- and C-termini, S0, and residues between S2 and S3b. Within each set of residues, signal intensities were corrected for the number of protons contributing to the peak and then, based on peaks arising from known distances, categorized as strong, medium, weak and very weak corresponding to distance ranges of 1.8–2.8, 1.8–3.5, 1.8–4.5 and 1.8–5.5 Å, respectively. Distance restraints were represented by a (Σr−6)−1/6 sum over all contributing protons.
The structure calculation process was divided into two stages. Initially, beginning from an extended structure, secondary structural elements were defined using only backbone dihedral angle and unambiguous local distance restraints (among 1HN, 1Hα and 1Hβ atoms less than five residues apart). A loosely folded set of structures was obtained by the addition of unambiguous long-range distance restraints. In these calculations, the temperature was set to 3,500 K for 20 ps (time step = 10 fs) with the following force constants (k): k(bond angle) = 0.4 kcal mol−1 degree−1; k(improper) = 0.4 kcal mol−1 degree−2; k(backbone dihedrals) = 5 kcal mol−1 rad−1; k(NOE) = 20 kcal mol−1 Å−1. The physical energy term constants were ramped during an additional 2 ps: k(atom radii) = 0.4- to 0.8-fold; k(van der Waals) = 0.004 to 4 kcal mol−1 Å−2 k(bond angle) = 0.4 to 1.0 kcal mol−1 degree−1; k(impropers) = 0.4 to 1.0 kcal mol−1 degree−2. In the subsequent cooling steps, the temperature was lowered to 100 K in 25 K decrements while the NOE potential constant was ramped from 20 to 30 kcal mol−1 Å−2 and the dihedral angle force constant was set to 200 kcal mol−1 rad−1. Each round of calculations produced 100 structures and the 20 lowest energy structures were chosen to represent the ensemble.
The tertiary fold was gradually refined using successive rounds of calculations with additional local and long-range distance restraints. Each round of calculations was performed beginning from the lowest energy structure determined in the first stage. Additional “unambiguous” restraints were added only if a single assignment was present within 7 A in the structure ensemble. We also incorporated ambiguous restraints with up to three possible assignments. After each round of calculations, the NOE assignments were reevaluated and adjusted as necessary. These calculations were performed in a similar manner as described above with the following modifications. The initial high temperature was 3,000 K for 10 ps (2 fs time step) and cooled to 25 K in 12.5 K decrements. The van der Waals terms were used throughout the calculation with radii force constants beginning at 0.9-fold and ramped to 0.8-fold during the cooling steps. Additional torsion angle 52 (ramped 0.002 to 1) and hydrogen bonding potentials 53 were also added. Although the second round of calculations were performed starting from a partially folded structure, an equivalent set of structures is obtained using the final set of restraints starting from an extended structure (the r.m.s.d. for α-carbons in P25-K147 is 1.2 Å between the two lowest energy structures).
Relaxation Rate and Diffusion Measurements
Amide relaxation measurements used 0.3 mM 2H,15N KvAP VSD samples (at 14.1 T). R1 and R2 relaxation rates and hetNOE were measured using standard sequences modified for TROSY-based detection of the signal 22 with 512 × 150 complex points and 12.5 × 25.6 ppm spectral widths in the 1H × 15N dimensions. Nine R1 experiments incorporated relaxation delays between 0.02–1.5 s while ten R2 experiments used delays between 8–92 ms with a τcp = 1 ms interval between the centers of nitrogen pulses in the Carr-Purcell-Meiboom-Gill pulse train. R1 and R2 rate constants were determined by the best single exponential fit to the signal intensities using the program Curvefit 54. Uncertainties in the rate constants were estimated using a Monte-Carlo algorithm with the error in signal intensity approximated by the baseline noise. The proton-saturated and unsaturated hetNOE experiments were collected in an interleaved manner. Four experiments were acquired with the average and standard error taken as the hetNOE and uncertainty, respectively.
The ηxy rate constants were measured using a TROSY-based Hahn-echo sequence 29 with 512 × 150 complex points and 12.5 × 25.6 ppm spectral widths for the 1H × 15N dimensions and a relaxation delay of 21.6 ms. Four experiments were acquired with the average and standard error taken as the rate constant and uncertainty, respectively. The chemical exchange contribution was determined as Rex = R2−κηxy where κ = 1.65 ± 0.19 is the average R2/ηxy ratio for residues not subject to chemical exchange line broadening (generally residues with R2 < 35 s−1; see Figure S4).
R2/R1 ratios for residues within helical segments were used to calculate the rotational diffusion time using the local diffusion approach 55 implemented in the program r2r1_diffusion 54. An isotropic diffusion model was assumed as little improvement was observed using an axially symmetric model.
D7PC NOE Measurement
The 3D 13C-filtered NOESY experiment (at 18.8 T) was recorded on a 0.5 mM 13C,15N sample in 10 % (v/v) D2O with 1024 × 200 × 64 complex points and 12 × 12 × 43 ppm spectral widths in the observed 1H × indirect 1H × 13C dimensions. The joint composite-rotation adiabatic-sweep pulse sequence was used 35 with τa = 4.8 ms, and a longer mixing time (τmix = 200 ms) to accentuate long distance interactions. WURST-20 adiabatic pulses 56 were used with an 80 kHz frequency sweep and τp = 2.1358 ms 57. Where present, NOE crosspeaks to amide protons were used to confirm the protein assignment.
Paramagnetic Lipid Titrations
A single batch of purified KvAP VSD was split into two equal samples after concentration to 0.3 mM. Paramagnetic 16-Doxyl PSPC and diamagnetic PSPC lipids (Avanti Polar Lipids, Inc.), dissolved in chloroform, were aliquoted and dried under an argon stream. The dried lipid film was resuspended by the D7PC solubilized KvAP VSD and incubated at room temperature for 30 min prior to data collection. Fast HSQC 58 spectra were acquired (at 18.8 T) using INEPT delays of 5.5 ms, a 3-9-19 WATERGATE pulse element 59 and 512 × 150 complex points with 12.5 × 25.6 ppm spectral widths in the 1H × 15N dimensions. Lipid concentrations were limited to ≤2 mM to minimize simultaneous interactions with multiple paramagnetic agents so that the paramagnetic relaxation enhancement is proportional to the bulk concentration of lipid. The relaxation enhancement ε was determined from single exponential fits to the IDOXYL/IPSPC peak intensity ratios using Curvefit 54 according to the relation IDOXYL/IPSPC = exp(−εc) where c is the concentration of lipid (see ref. 38). The baseline noise was used as the uncertainty in peak intensity and the error in ε was estimated using a Monte-Carlo algorithm. Results from three samples (15N, 15N-GSRKF, 15N-GSAILV) were combined and the average value and standard error were used for residues with multiple data points.
Accession Numbers
Chemical shift assignments have been deposited in the BioMagResBank under accession number 16957. Coordinates for the NMR ensemble of structures have been deposited in the Protein Data Bank under accession code 2KYH.
Supplementary Material
Acknowledgments
We thank members of the MacKinnon lab for helpful suggestions throughout the course of this project, M. Whorton and A. Palmer for comments on the manuscript, and the staff at the New York Structural Biology Center for assistance with the spectrometers. The New York Structural Biology Center was supported by National Institutes of Health (NIH) grant P41 GM66354 and the 900 MHz spectrometers were purchased with funds from the NIH, USA, the Keck Foundation, New York State, and the NYC Economic Development Corporation. This work was directly supported by NIH grant GM43939 (awarded to R.M). R.M. is an investigator of the Howard Hughes Medical Institute.
Footnotes
Publisher's Disclaimer: This is a PDF file of an unedited manuscript that has been accepted for publication. As a service to our customers we are providing this early version of the manuscript. The manuscript will undergo copyediting, typesetting, and review of the resulting proof before it is published in its final citable form. Please note that during the production process errors may be discovered which could affect the content, and all legal disclaimers that apply to the journal pertain.
References
- 1.Lee SY, Letts JA, Mackinnon R. Functional reconstitution of purified human Hv1 H+ channels. J Mol Biol. 2009;387:1055–60. doi: 10.1016/j.jmb.2009.02.034. [DOI] [PMC free article] [PubMed] [Google Scholar]
- 2.Tombola F, Ulbrich MH, Isacoff EY. The voltage-gated proton channel Hv1 has two pores, each controlled by one voltage sensor. Neuron. 2008;58:546–56. doi: 10.1016/j.neuron.2008.03.026. [DOI] [PMC free article] [PubMed] [Google Scholar]
- 3.Ramsey IS, Moran MM, Chong JA, Clapham DE. A voltage-gated proton-selective channel lacking the pore domain. Nature. 2006;440:1213–6. doi: 10.1038/nature04700. [DOI] [PMC free article] [PubMed] [Google Scholar]
- 4.Sasaki M, Takagi M, Okamura Y. A voltage sensor-domain protein is a voltage-gated proton channel. Science. 2006;312:589–92. doi: 10.1126/science.1122352. [DOI] [PubMed] [Google Scholar]
- 5.Hille B. Ion channels of excita. 3. Sinauer; Sunderland, MA: 2001. [Google Scholar]
- 6.Murata Y, Iwasaki H, Sasaki M, Inaba K, Okamura Y. Phosphoinositide phosphatase activity coupled to an intrinsic voltage sensor. Nature. 2005;435:1239–43. doi: 10.1038/nature03650. [DOI] [PubMed] [Google Scholar]
- 7.Jiang Y, Lee A, Chen J, Ruta V, Cadene M, Chait BT, Mackinnon R. X-ray structure of a voltage-dependent K+ channel. Nature. 2003;423:33–41. doi: 10.1038/nature01580. [DOI] [PubMed] [Google Scholar]
- 8.Lee SY, Lee A, Chen J, Mackinnon R. Structure of the KvAP voltage-dependent K+ channel and its dependence on the lipid membrane. Proc Natl Acad Sci USA. 2005;102:15441–6. doi: 10.1073/pnas.0507651102. [DOI] [PMC free article] [PubMed] [Google Scholar]
- 9.Long SB, Campbell EB, Mackinnon R. Voltage sensor of Kv1.2: structural basis of electromechanical coupling. Science. 2005;309:903–8. doi: 10.1126/science.1116270. [DOI] [PubMed] [Google Scholar]
- 10.Long SB, Tao X, Campbell EB, Mackinnon R. Atomic structure of a voltage-dependent K+ channel in a lipid membrane-like environment. Nature. 2007;450:376–82. doi: 10.1038/nature06265. [DOI] [PubMed] [Google Scholar]
- 11.Schmidt D, Cross S, Mackinnon R. A gating model for the archeal voltage-dependent K+ channel KvAP in DPhPC and POPE:POPG decane lipid bilayers. J Mol Biol. 2009;390:902–912. doi: 10.1016/j.jmb.2009.05.062. [DOI] [PMC free article] [PubMed] [Google Scholar]
- 12.Ramu Y, Xu Y, Lu Z. Enzymatic activation of voltage-gated potassium channels. Nature. 2006;442:696–9. doi: 10.1038/nature04880. [DOI] [PubMed] [Google Scholar]
- 13.Schmidt D, Mackinnon R. Voltage-dependent K+ channel gating and voltage sensor toxin sensitivity depend on the mechanical state of the lipid membrane. Proc Natl Acad Sci USA. 2008;105:19275–19280. doi: 10.1073/pnas.0810187105. [DOI] [PMC free article] [PubMed] [Google Scholar]
- 14.Schmidt D, Jiang QX, Mackinnon R. Phospholipids and the origin of cationic gating charges in voltage sensors. Nature. 2006;444:775–9. doi: 10.1038/nature05416. [DOI] [PubMed] [Google Scholar]
- 15.Xu Y, Ramu Y, Lu Z. Removal of phospho-head groups of membrane lipids immobilizes voltage sensors of K+ channels. Nature. 2008;451:826–9. doi: 10.1038/nature06618. [DOI] [PMC free article] [PubMed] [Google Scholar]
- 16.Lee SY, Mackinnon R. A membrane-access mechanism of ion channel inhibition by voltage sensor toxins from spider venom. Nature. 2004;430:232–5. doi: 10.1038/nature02632. [DOI] [PubMed] [Google Scholar]
- 17.Ruta V, Mackinnon R. Localization of the voltage-sensor toxin receptor on KvAP. Biochemistry. 2004;43:10071–9. doi: 10.1021/bi049463y. [DOI] [PubMed] [Google Scholar]
- 18.Swartz KJ. Tarantula toxins interacting with voltage sensors in potassium channels. Toxicon. 2007;49:213–30. doi: 10.1016/j.toxicon.2006.09.024. [DOI] [PMC free article] [PubMed] [Google Scholar]
- 19.Chakrapani S, Cuello LG, Cortes DM, Perozo E. Structural dynamics of an isolated voltage-sensor domain in a lipid bilayer. Structure. 2008;16:398–409. doi: 10.1016/j.str.2007.12.015. [DOI] [PMC free article] [PubMed] [Google Scholar]
- 20.Cuello LG, Cortes DM, Perozo E. Molecular architecture of the KvAP voltage-dependent K+ channel in a lipid bilayer. Science. 2004;306:491–5. doi: 10.1126/science.1101373. [DOI] [PubMed] [Google Scholar]
- 21.Shenkarev ZO, Paramonov AS, Lyukmanova EN, Shingarova LN, Yakimov SA, Dubinnyi MA, Chupin VV, Kirpichnikov MP, Blommers MJJ, Arseniev AS. NMR structural and dynamical investigation of the isolated voltage-sensing domain of the potassium channel KvAP: implications for voltage gating. J Am Chem Soc. 2010;132:5630–5637. doi: 10.1021/ja909752r. [DOI] [PubMed] [Google Scholar]
- 22.Cavanagh J, Fairbrother WJ, Palmer AG, Skelton NJ. Protein NMR spectroscopy: principles and practice. Academic Press; San Diego, CA: 1996. [Google Scholar]
- 23.Tugarinov V, Kanelis V, Kay LE. Isotope labeling strategies for the study of high-molecular-weight proteins by solution NMR spectroscopy. Nat Protoc. 2006;1:749–54. doi: 10.1038/nprot.2006.101. [DOI] [PubMed] [Google Scholar]
- 24.Cornilescu G, Delaglio F, Bax A. Protein backbone angle restraints from searching a database for chemical shift and sequence homology. J Biomol NMR. 1999;13:289–302. doi: 10.1023/a:1008392405740. [DOI] [PubMed] [Google Scholar]
- 25.Banerjee A, Mackinnon R. Inferred motions of the S3a helix during voltage-dependent K+ channel gating. J Mol Biol. 2008;381:569–80. doi: 10.1016/j.jmb.2008.06.010. [DOI] [PMC free article] [PubMed] [Google Scholar]
- 26.Jiang Y, Ruta V, Chen J, Lee A, Mackinnon R. The principle of gating charge movement in a voltage-dependent K+ channel. Nature. 2003;423:42–8. doi: 10.1038/nature01581. [DOI] [PubMed] [Google Scholar]
- 27.Ruta V, Chen J, Mackinnon R. Calibrated measurement of gating-charge arginine displacement in the KvAP voltage-dependent K+ channel. Cell. 2005;123:463–75. doi: 10.1016/j.cell.2005.08.041. [DOI] [PubMed] [Google Scholar]
- 28.Lee SY, Banerjee A, Mackinnon R. Two separate interfaces between the voltage sensor and pore are required for the function of voltage-dependent K+ channels. PLoS Biol. 2009;7:e47. doi: 10.1371/journal.pbio.1000047. [DOI] [PMC free article] [PubMed] [Google Scholar]
- 29.Wang C, Rance M, Palmer AG. Mapping chemical exchange in proteins with MW > 50 kD. J Am Chem Soc. 2003;125:8968–9. doi: 10.1021/ja035139z. [DOI] [PubMed] [Google Scholar]
- 30.Hwang PM, Skrynnikov NR, Kay LE. Domain orientation in beta-cyclodextrin-loaded maltose binding protein: diffusion anisotropy measurements confirm the results of a dipolar coupling study. J Biomol NMR. 2001;20:83–8. doi: 10.1023/a:1011226512421. [DOI] [PubMed] [Google Scholar]
- 31.Shan X, Gardner KH, Muhandiram DR, Rao NS, Arrowsmith CH, Kay LE. Assignment of 15N, 13Cα, 13Cβ, and HN resonances in an 15N, 13C, 2H labeled 64 kDa trp repressor-operator complex using triple-resonance NMR spectroscopy and 2H-decoupling. J Am Chem Soc. 1996;118:6570–6579. [Google Scholar]
- 32.Fernández C, Hilty C, Wider G, Wüthrich K. Lipid-protein interactions in DHPC micelles containing the integral membrane protein OmpX investigated by NMR spectroscopy. Proc Natl Acad Sci USA. 2002;99:13533–7. doi: 10.1073/pnas.212515099. [DOI] [PMC free article] [PubMed] [Google Scholar]
- 33.Liang B, Arora A, Tamm LK. Fast-time scale dynamics of outer membrane protein A by extended model-free analysis of NMR relaxation data. Biochim Biophys Acta. 2009;1798:68–76. doi: 10.1016/j.bbamem.2009.07.022. [DOI] [PMC free article] [PubMed] [Google Scholar]
- 34.Hwang PM, Choy WY, Lo EI, Chen L, Forman-Kay JD, Raetz CRH, Privé GG, Bishop RE, Kay LE. Solution structure and dynamics of the outer membrane enzyme PagP by NMR. Proc Natl Acad Sci USA. 2002;99:13560–5. doi: 10.1073/pnas.212344499. [DOI] [PMC free article] [PubMed] [Google Scholar]
- 35.Valentine ER, Ferrage F, Massi F, Cowburn D, Palmer AG. Joint composite-rotation adiabatic-sweep isotope filtration. J Biomol NMR. 2007;38:11–22. doi: 10.1007/s10858-006-9131-9. [DOI] [PMC free article] [PubMed] [Google Scholar]
- 36.White SH, Wimley WC. Membrane protein folding and stability: physical principles. Ann Rev Biophys Biomol Struct. 1999;28:319–65. doi: 10.1146/annurev.biophys.28.1.319. [DOI] [PubMed] [Google Scholar]
- 37.Vogel A, Scheidt HA, Huster D. The distribution of lipid attached spin probes in bilayers: application to membrane protein topology. Biophys J. 2003;85:1691–701. doi: 10.1016/S0006-3495(03)74599-8. [DOI] [PMC free article] [PubMed] [Google Scholar]
- 38.Hilty C, Wider G, Fernández C, Wüthrich K. Membrane protein-lipid interactions in mixed micelles studied by NMR spectroscopy with the use of paramagnetic reagents. Chembiochem. 2004;5:467–73. doi: 10.1002/cbic.200300815. [DOI] [PubMed] [Google Scholar]
- 39.Jarvet J, Danielsson J, Damberg P, Oleszczuk M, Gräslund A. Positioning of the Alzheimer Aβ(1–40) peptide in SDS micelles using NMR and paramagnetic probes. J Biomol NMR. 2007;39:63–72. doi: 10.1007/s10858-007-9176-4. [DOI] [PubMed] [Google Scholar]
- 40.Jarvet J, Zdunek J, Damberg P, Gräslund A. Three-dimensional structure and position of porcine motilin in sodium dodecyl sulfate micelles determined by 1H NMR. Biochemistry. 1997;36:8153–63. doi: 10.1021/bi970193b. [DOI] [PubMed] [Google Scholar]
- 41.Swartz KJ. Sensing voltage across lipid membranes. Nature. 2008;456:891–7. doi: 10.1038/nature07620. [DOI] [PMC free article] [PubMed] [Google Scholar]
- 42.Clayton GM, Altieri S, Heginbotham L, Unger VM, Morais-Cabral JH. Structure of the transmembrane regions of a bacterial cyclic nucleotide-regulated channel. Proc Natl Acad Sci USA. 2008;105:1511–5. doi: 10.1073/pnas.0711533105. [DOI] [PMC free article] [PubMed] [Google Scholar]
- 43.Alabi AA, Bahamonde MI, Jung HJ, Kim JI, Swartz KJ. Portability of paddle motif function and pharmacology in voltage sensors. Nature. 2007;450:370–5. doi: 10.1038/nature06266. [DOI] [PMC free article] [PubMed] [Google Scholar]
- 44.Shenkarev ZO, Lyukmanova EN, Paramonov AS, Shingarova LN, Chupin VV, Kirpichnikov MP, Blommers MJJ, Arseniev AS. Lipid-protein nanodiscs as reference medium in detergent screening for high-resolution NMR studies of integral membrane proteins. J Am Chem Soc. 2010;132:5628–5629. doi: 10.1021/ja9097498. [DOI] [PubMed] [Google Scholar]
- 45.Powl AM, East JM, Lee AG. Different effects of lipid chain length on the two sides of a membrane and the lipid annulus of MscL. Biophys J. 2007;93:113–22. doi: 10.1529/biophysj.107.105130. [DOI] [PMC free article] [PubMed] [Google Scholar]
- 46.Delaglio F, Grzesiek S, Vuister GW, Zhu G, Pfeifer J, Bax A. NMRPipe: a multidimensional spectral processing system based on UNIX pipes. J Biomol NMR. 1995;6:277–93. doi: 10.1007/BF00197809. [DOI] [PubMed] [Google Scholar]
- 47.Goddard TD, DGK . Sparky. p. 3. [Google Scholar]
- 48.Loria JP, Rance M, Palmer AG. Transverse-relaxation-optimized (TROSY) gradient-enhanced triple-resonance NMR spectroscopy. J Magn Reson. 1999;141:180–4. doi: 10.1006/jmre.1999.1891. [DOI] [PubMed] [Google Scholar]
- 49.Neri D, Szyperski T, Otting G, Senn H, Wüthrich K. Stereospecific nuclear magnetic resonance assignments of the methyl groups of valine and leucine in the DNA-binding domain of the 434 repressor by biosynthetically directed fractional 13C labeling. Biochemistry. 1989;28:7510–6. doi: 10.1021/bi00445a003. [DOI] [PubMed] [Google Scholar]
- 50.Schwieters C, Kuszewski J, Marius Clore G. Using Xplor NIH for NMR molecular structure determination. Prog NMR Spect. 2006;48:47–62. [Google Scholar]
- 51.Schwieters CD, Kuszewski JJ, Tjandra N, Clore GM. The Xplor–NIH NMR molecular structure determination package. J Magn Reson. 2003;160:65–73. doi: 10.1016/s1090-7807(02)00014-9. [DOI] [PubMed] [Google Scholar]
- 52.Kuszewski J, Gronenborn AM, Clore GM. Improvements and extensions in the conformational database potential for the refinement of NMR and X-ray structures of proteins and nucleic acids. J Magn Reson. 1997;125:171–7. doi: 10.1006/jmre.1997.1116. [DOI] [PubMed] [Google Scholar]
- 53.Grishaev A, Bax A. An empirical backbone-backbone hydrogen-bonding potential in proteins and its applications to NMR structure refinement and validation. J Am Chem Soc. 2004;126:7281–92. doi: 10.1021/ja0319994. [DOI] [PubMed] [Google Scholar]
- 54.Palmer AG. ( www.palmer.hs.columbia.edu)
- 55.Tjandra N, Feller S, Pastor R, Bax A. Rotational diffusion anisotropy of human ubiquitin from 15N NMR relaxation. J Am Chem Soc. 1995;117:12562–12566. [Google Scholar]
- 56.Kupce E, Freeman R. Adiabatic pulses for wide-band inversion and broad-band decoupling. J Magn Reson Ser A. 1995;115:273–276. [Google Scholar]
- 57.Zwahlen C, Legault P, Vincent S, Greenblatt J, Konrat R, Kay L. Methods for measurement of intermolecular NOEs by multinuclear NMR spectroscopy: Application to a bacteriophage lambda N-peptide/boxB RNA complex. J Am Chem Soc. 1997;119:6711–6721. [Google Scholar]
- 58.Mori S, Abeygunawardana C, Johnson MO, van Zijl PC. Improved sensitivity of HSQC spectra of exchanging protons at short interscan delays using a new fast HSQC (FHSQC) detection scheme that avoids water saturation. J Magn Reson Ser B. 1995;108:94–8. doi: 10.1006/jmrb.1995.1109. [DOI] [PubMed] [Google Scholar]
- 59.Sklenar V, Piotto M, Leppik R, Saudek V. Gradient-tailored water suppression for 1H-15N HSQC experiments optimized to retain full sensitivity. J Magn Reson Ser A. 1993;102:241–245. [Google Scholar]
- 60.Venters RA, Farmer BT, Fierke CA, Spicer LD. Characterizing the use of perdeuteration in NMR studies of large proteins: 13C, 15N and 1H assignments of human carbonic anhydrase II. J Mol Biol. 1996;264:1101–16. doi: 10.1006/jmbi.1996.0699. [DOI] [PubMed] [Google Scholar]
- 61.Wishart DS, Case DA. Use of chemical shifts in macromolecular structure determination. Meth Enzymol. 2001;338:3–34. doi: 10.1016/s0076-6879(02)38214-4. [DOI] [PubMed] [Google Scholar]
- 62.PyMOL. The PyMOL Molecular Graphics System. Schrödinger, LLC; ( www.pymol.org) [Google Scholar]
Associated Data
This section collects any data citations, data availability statements, or supplementary materials included in this article.