

Abstract
Growth is an integrative trait that responds to environmental factors and is crucial for plant fitness. A major environmental factor influencing plant growth is nutrient supply. In order to explore this relationship further, we quantified growth-related traits, ion content, and other biochemical traits (protein, hexose, and chlorophyll contents) of a recombinant inbred line population of Arabidopsis (Arabidopsis thaliana) grown on different levels of potassium and phosphate. Performing an all subsets multiple regression analyses revealed a link between growth-related traits and mineral nutrient content. Based on our results, up to 85% of growth variation can be explained by variation in ion content, highlighting the importance of ionomics for a broader understanding of plant growth. In addition, quantitative trait loci (QTLs) were detected for growth-related traits, ion content, further biochemical traits, and their responses to reduced supplies of potassium or phosphate. Colocalization of these QTLs is explored, and candidate genes are discussed. A QTL for rosette weight response to reduced potassium supply was identified on the bottom of chromosome 5, and its effects were validated using selected near isogenic lines. These lines retained over 20% more rosette weight in reduced potassium supply, accompanied by an increase in potassium content in their leaves.
Plants in natural environments face abiotic constraints limiting growth and ultimately affecting their fitness. In response to such constraints, flowering time (Korves et al., 2007) and seed dormancy (Donohue et al., 2005) as well as vegetative growth (Barto and Cipollini, 2005; Milla et al., 2009) are the main traits controlling fitness (for review, see Alonso-Blanco et al., 2009). These traits are under the control of complex networks integrating genetic (G) and environmental (E) factors as well as their interaction (G × E). Due to the implications for food and renewable energy sources, dissecting the genetic architecture that underlies plant growth is becoming a priority for plant science (Rengel and Damon, 2008; Carroll and Somerville, 2009; Gilbert, 2009).
Plant growth is highly dependent on mineral nutrient uptake (Clarkson, 1980; Sinclair, 1992). Minerals can be distinguished into two categories based on the amount required by plants: micronutrients, which are found in relatively small amounts in the plant (such as copper and iron), and macronutrients, which constitute between 1,000 and 15,000 μg g−1 plant dry weight (such as potassium and phosphate; Marschner, 1995, Buchanan et al., 2002). Phosphate is an important structural and signaling molecule with an essential role in photosynthesis, energy conservation, and carbon metabolism. Its deficiency leads to a reduction of growth and an increase of pathogen susceptibility (Marschner, 1995; Williamson et al., 2001; Abel et al., 2002; López-Bucio et al., 2005; Poirier and Bucher, 2008; Vijayraghavan and Soole, 2010). Potassium is not incorporated into any organic substances but acts as the major osmoticum of the cell, controlling cell expansion, plasma membrane potential and transport, pH value, and many other catalytic processes (Maathuis and Sanders, 1996; Armengaud et al., 2004; Christian et al., 2006; Di Cera, 2006). Potassium deficiency leads to reduced plant growth, a loss of turgor, increased susceptibility to cold stress and pathogens, and the development of chlorosis and necrosis (Marschner, 1995; Véry and Sentenac, 2003; Ashley et al., 2006; Amtmann et al., 2008). To cope with changes in nutrient availability, plants have evolved different mechanisms of adaptation, such as changes in ion transporter expression and activity (Ashley et al., 2006; Jung et al., 2009), morphological changes, such as an increase in root growth to explore more soil volume (Marschner, 1995; Shirvani et al., 2001; Jiang et al., 2007; Jordan-Meille and Pellerin, 2008), or acidification of the surrounding soil in order to mobilize more mineral nutrients (for review, see Ryan et al., 2001). Although these adaptations are well known, the mechanisms involved in sensing and signaling low mineral nutrient status are less well understood, despite significant progress in this area being made (Doerner, 2008; Jung et al., 2009; Luan et al., 2009; Wang and Wu, 2010).
One approach to identify genes that are involved in plant responses to environmental factors is to perform a quantitative trait locus (QTL) analysis on a mapping population grown in contrasting environments, allowing the identification of QTL-environment (QTL × E) interactions. Some QTLs for growth-related traits in response to environmental changes were cloned already. For example, the differential response of root growth of some Arabidopsis (Arabidopsis thaliana) accessions to phosphate starvation led to the identification of allelic differences responsible for this phenotype (Reymond et al., 2006; Svistoonoff et al., 2007). Other studies have identified QTLs for shoot dry matter under changing nitrogen supply (Rauh et al., 2002; Loudet et al., 2003). In parallel to natural variation for growth, natural variation for ion content has also been reported. In Arabidopsis, considerable variation in the content of mineral nutrients exists both in seeds (Vreugdenhil et al., 2004; Waters and Grusak, 2008) and in leaves (Harada and Leigh, 2006; Rus et al., 2006; Baxter et al., 2008a; Morrissey et al., 2009). Furthermore, changes in mineral nutrient homeostasis have also been reported to be associated with characteristic multivariate changes in the leaf ionome, the mineral nutrient and trace element composition of an organism or an organ (Baxter et al., 2008b). Due to higher throughput and lower costs, such “omics” analyses examining alterations of large numbers of certain molecules at once have recently become available for mapping purposes. Some QTL studies have linked the variations of these omics data to variation of growth or other physiological traits. For instance, Meyer et al. (2007) and Schauer et al. (2008) linked plant growth or morphological traits to a synergistic network of metabolomic compounds in Arabidopsis and tomato (Solanum lycopersicum), respectively. In addition, Sulpice et al. (2009) associated differences in growth with starch content using a set of Arabidopsis accessions. Compiling the importance of ions in the process of cell division (Lai et al., 2007; Sano et al., 2007) or cell expansion (Philippar et al., 1999; Elumalai et al., 2002), ionomics appears to be a major unexplored field for understanding growth.
In this study, we focus on variation in plant growth, the root and leaf ionomes, and their response to varying supplies of potassium and phosphate. Studying variations for these traits among recombinant inbred lines (RILs) in Arabidopsis enabled us to detect QTL and QTL × E interactions for all of these traits. To understand the observed variation in plant growth, predictors that explained a high percentage of variation of growth-related traits have been selected especially among the root and leaf ionomes. The colocalization between growth-related trait QTLs and QTLs for their predictors allowed us to point out genetic regions of possible causality. In addition, the effect of a growth-response QTL on reduced potassium supply was validated with selected near isogenic lines (NILs) that maintained a higher rosette weight when grown in reduced potassium supply. This growth advantage went along with significant changes in ion contents that further emphasize the impact of the ionome in plant growth variations.
RESULTS
Correlations between the Quantified Growth-Related Traits
Selected lines of the Landsberg erecta (Ler) × Kashmir-2 (Kas-2) RIL population (El-Lithy et al., 2006) were grown under different nutrient regimes (control [C], reduced potassium [K−], and reduced phosphate [P−] media) using a hydroponic cultivation system (Tocquin et al., 2003). Different growth-related traits were quantified, such as rosette weight, root weight, and root length of plants, 32 d after transfer to the growth cabinet (DAT; see “Materials and Methods”). In addition, the relative growth rate (RGR; see “Materials and Methods”) of the projected rosette area was quantified between 7 and 22 DAT. Rosette weight and root weight were strongly and significantly correlated (r values between 0.79 and 0.89; Table I), as were, to a lesser extent, root weight and root length (r values between 0.32 and 0.4; Table I). No significant correlations were observed between rosette weight and root length, nor between root length and RGR, in any of the nutrient regimes. The correlations between rosette weight, root weight, and root length were not affected by nutrient regime (Table I). Rosette weight and root weight were correlated with RGR (r values between 0.46 and 0.6 in C and P−), and these correlations were less pronounced in the K− regime (r = 0.29 and 0.2).
Table I. Correlation of all growth-related traits.
The Pearson’s correlation coefficients (r) and P values for the correlation of all growth-related traits, rosette weight, root weight, root length, and RGR, are reported for each treatment (C, K−, and P−).
| Trait | Treatment | Rosette Weight | Root Weight | Root Length | |||
| r | P | r | P | r | P | ||
| g | g | cm | |||||
| Root weight (g) | C | 0.79 | 3.1E-29 | ||||
| K− | 0.89 | 4.9E-46 | |||||
| P− | 0.86 | 7.8E-40 | |||||
| Root length (cm) | C | 0.15 | 9.6E-02 | 0.40 | 2.9E-06 | ||
| K− | 0.20 | 2.0E-02 | 0.38 | 1.2E-05 | |||
| P− | 0.22 | 1.4E-02 | 0.32 | 2.5E-04 | |||
| RGR (d−1) | C | 0.52 | 2.1E-10 | 0.46 | 4.3E-08 | 0.11 | 2.3E-01 |
| K− | 0.29 | 7.6E-04 | 0.20 | 2.0E-02 | −0.07 | 4.2E-01 | |
| P− | 0.55 | 2.4E-11 | 0.60 | 1.0E-13 | 0.13 | 1.4E-01 | |
Linking the Variation of Growth-Related Traits and the Variation of Ionomic Traits
A multiple regression analysis (all subset multiple regression; see “Materials and Methods”) was performed to examine to what extent the variation of the growth-related traits can be explained by that of chlorophyll, protein, and hexose content, ionomics (of the rosette [_rs] or the root [_rt]), and leaf number (leaf number at 22 DAT [L22] or leaf number at 32 DAT [L32]). Hence, a set of predictors were selected that significantly explained the variation of the growth-related traits or the variation of the growth responses to the different mineral nutrient regimes (Table II). All together, 10 to 13 predictors and their correlations (Table II; Supplemental Fig. S1) explained from 66.2% to 84.7% of the rosette weight and root weight variance in the different nutrient regimes (C, K−, and P−). RGR and root length were explained by four to 13 predictors, which together explained between 40.8%, and 55.3% (Table II). A small percentage of the variance in the growth-related traits for response to nutrient supply (change in the percentage of a trait in the reduced nutrient supply compared with the control [Kresp and Presp]) was explained by predictors. However, this is not the case for the response of root length to the low-phosphate regime (Presp), where a combination of 13 predictors explained up to 54.1% of the variation of this trait.
Table II. Predictors for growth-related traits.
Selected predictors (ionomic content in the rosette [_rs] or in the root [_rt], biochemical and developmental traits) for the growth-related traits (rosette weight, RGR, root weight, and root length) and the percentage of trait variance each predictor explains on its own and altogether (total). The prediction was done for each growth-related trait in the C, K−, and P− conditions and for the response of the trait to potassium (Kresp) and phosphate (Presp) reduction.
| Predictor | Rosette Weight | RGR | Root Weight | Root Length | ||||||||||||||||
| C | K− | P− | Kresp | Presp | C | K− | P− | Kresp | Presp | C | K− | P− | Kresp | Presp | C | K− | P− | Kresp | Presp | |
| Chlorophyll a | 0.7 | 0.4 | ||||||||||||||||||
| Chlorophyll b | 13.0 | 18.5 | 4.8 | 6.5 | 0.5 | |||||||||||||||
| Proteins | 7.1 | 4.3 | 5.4 | |||||||||||||||||
| Hexoses | ||||||||||||||||||||
| B_rs | 12.2 | 6.0 | 2.3 | |||||||||||||||||
| B_rt | 16.6 | |||||||||||||||||||
| Ca_rs | 2.3 | 1.4 | 8.0 | 5.3 | 5.9 | 0.4 | ||||||||||||||
| Ca_rt | 3.3 | 13.1 | 2.7 | 7.6 | 5.5 | 15.5 | 3.0 | |||||||||||||
| Cd_rs | ||||||||||||||||||||
| Cd_rt | ||||||||||||||||||||
| Co_rs | ||||||||||||||||||||
| Co_rt | 1.3 | 8.6 | ||||||||||||||||||
| Cu_rs | 6.5 | |||||||||||||||||||
| Cu_rt | 2.5 | 2.4 | 0.0 | 4.8 | 5.7 | |||||||||||||||
| Fe_rs | 18.9 | 5.7 | 0.8 | |||||||||||||||||
| Fe_rt | 25.1 | 12.1 | 10.9 | 8.9 | 6.0 | 1.7 | 20.7 | 6.6 | 0.7 | 0.2 | 6.2 | |||||||||
| K_rs | 38.2 | 39.1 | 21.9 | 7.6 | 0.8 | 14.1 | 0.0 | 17.5 | 13.6 | 0.1 | 3.4 | |||||||||
| K_rt | 3.5 | 14.4 | 3.0 | 11.2 | 16.8 | 15.6 | 4.6 | 6.4 | ||||||||||||
| Mg_rs | 2.6 | 0.0 | ||||||||||||||||||
| Mg_rt | 4.6 | 1.7 | 1.7 | 1.3 | 1.3 | |||||||||||||||
| Mn_rs | 0.1 | |||||||||||||||||||
| Mn_rt | 13.7 | 2.7 | 24.8 | |||||||||||||||||
| Mo_rs | 0.6 | 0.8 | 0.6 | 1.4 | 2.0 | |||||||||||||||
| Mo_rt | 7.7 | 3.6 | 2.1 | 6.7 | 5.9 | 0.8 | 6.7 | 4.7 | ||||||||||||
| Na_rs | 12.1 | 1.9 | 6.0 | |||||||||||||||||
| Na_rt | 0.1 | 3.4 | 0.9 | |||||||||||||||||
| Ni_rs | 0.1 | |||||||||||||||||||
| Ni_rt | ||||||||||||||||||||
| P_rs | 2.2 | 1.8 | 20.7 | 1.3 | 2.0 | 16.1 | 17.2 | 11.9 | ||||||||||||
| P_rt | 19.8 | 17.1 | 6.0 | 7.5 | 0.8 | 6.8 | 0.5 | 10.7 | 1.5 | 7.4 | ||||||||||
| Rb_rs | 10.3 | 13.0 | 0.0 | |||||||||||||||||
| Rb_rt | 0.3 | |||||||||||||||||||
| S_rs | 5.3 | 7.2 | 5.8 | 10.9 | 14.0 | 5.8 | 6.4 | 11.7 | ||||||||||||
| S_rt | 13.5 | 0.4 | 0.9 | 3.8 | 11.0 | |||||||||||||||
| Zn_rs | 0.1 | 11.7 | 5.4 | 4.1 | ||||||||||||||||
| Zn_rt | 4.3 | 8.7 | 20.1 | 1.4 | 9.3 | 27.0 | 11.7 | 15.3 | 33.6 | 4.3 | 16.7 | |||||||||
| L22 | 8.1 | 4.4 | 15.9 | 10.4 | 3.4 | 1.2 | 1.2 | 6.7 | 0.2 | |||||||||||
| L32 | 1.3 | 0.5 | 1.0 | 0.4 | 3.9 | 0.7 | ||||||||||||||
| Total | 82.3 | 84.7 | 83.9 | 64.4 | 48.1 | 40.8 | 42.0 | 55.3 | 3.4 | 23.5 | 66.2 | 73.9 | 78.2 | 28.4 | 18.9 | 47.7 | 47.4 | 54.1 | 28.0 | 46.7 |
The previously described correlations between the different growth-related traits (Table I) are reflected in the number of common predictors. Root weight and rosette weight were highly correlated and shared the highest number of predictors (six for C, eight for K−, and seven for P−; Table II). The correlations between root length and rosette weight, respectively, RGR and root length were lower than between root weight and rosette weight, as were the number of common predictors. Furthermore, root length was explained by few predictors, most of which also explained the variation of root weight, which is in accordance with the correlation between these traits (Table I).
QTL Mapping of Growth-Related Traits
Fifty-six QTLs involved in the variation of all growth-related traits were detected in all three nutrient regimes. For each QTL, the presence of a significant environmental interaction (Q × E) was then tested against the control condition, for QTLs detected in K− and P− and against K− and P− for the QTL detected in the control condition (see “Materials and Methods”). These QTLs are presented according to their location in 31 bins (comprising 15 centimorgan [cM] of the genetic map from the Kas-2 × Ler mapping population) along the five chromosomes (1-1 to 1-7 for chromosome 1, 2-1 to 2-6 for chromosome 2, 3-1 to 3-6 for chromosome 3, 4-1 to 4-5 for chromosome 4, and 5-1 to 5-7 for chromosome 5; Fig. 1). The 56 QTLs for growth-related traits explained between 3% and 22.3% of the phenotypic variation of the traits (Supplemental Table S1). For one-quarter of these QTLs, their effect was significantly different between nutrient regimes (G × E; Fig. 1). In addition, we identified three QTLs for the responses of growth-related traits to the reduced nutrient regimes (Presp, root length and RGR; Kresp, rosette weight). The response QTL to reduced potassium supply (Fig. 1B, bin 5-5) explained 9.3% of the variation of the rosette weight response, with the Ler alleles increasing the rosette weight response (Supplemental Table S1). This is the only QTL detected for the growth response to K− among the growth-related traits quantified.
Figure 1.

QTL mapping for growth-related traits (rosette weight [rs w], RGR, root weight [rt w], and root length [rt l]), for chlorophyll (Chla, Chlb), protein, hexose, and ionomic traits, and for leaf number (at day 22 [L22] and day 32 [L32]). The five chromosomes of Arabidopsis are presented above each panel (chromosomes 1 to 5 from left to right). The genetic positions of the markers that were used to elaborate the genetic map are reported by vertical bars on each chromosome. The ionomic traits are represented by their element abbreviations, and the examined tissues are the rosette (_rs) and the root (_rt). The chromosomes were divided into bins of 15 cM (for more detailed characterization of these QTLs, see Supplemental Table S1). A, QTL detection for the traits quantified in the C (black boxes), K− (orange boxes), and P− (red boxes) hydroponic solutions. For each trait, the QTL models obtained in each condition were tested in the other conditions, and significant QTL × E interactions are shown (see “Materials and Methods”). For the QTLs detected in the control condition, orange and red rims around the QTL boxes indicate that a significantly different effect was detected between C and K− and between C and P− conditions, respectively. QTLs reported with blue rims indicate that a significantly different effect of this QTL was found between C and both K− and P− conditions. For the QTLs detected in the K− or P− conditions, black rims indicate a significantly different effect of this QTL when compared with the control condition. B, QTL detection for trait responses to the K− (orange) and P− (red) regimes.
In accordance with the correlations between the quantified growth-related traits (Table I), colocalizations of QTLs of different growth-related traits have been observed: QTLs for root weight and root length were detected in all treatments on the top of chromosome 1 (Fig. 1, bin 1-3). At this position is a G × E effect for the root length QTL between C and P−, and accordingly, a QTL for the response of root length to P− has also been detected there. Another example of colocalizing QTLs of correlated growth-related traits is on chromosome 2 (in the vicinity of the marker Erecta, bin 2–4): QTLs of rosette and root weight were detected in all nutrient regimes.
QTL Mapping of Chlorophyll, Protein, Hexose, Ionomic Traits, and Leaf Number
The contents of leaf chlorophyll a, chlorophyll b, proteins, and hexoses as well as 15 mineral nutrient elements in rosette and root material at 32 DAT and the number of leaves at 22 DAT and 32 DAT were quantified. Overall, 277 QTLs were detected for these traits in the three nutrient regimes, comprising 16 major QTLs that explained more than 25% of the trait variance (Fig. 1; Supplemental Fig. S2). Sixty-eight percent of these QTLs had an effect significantly different between the nutrient regimes tested (G × E). In addition, 33 and 12 response QTLs were detected for the reduced potassium and phosphate supplies, respectively. One of these response QTLs explained over 25% of the variation observed in molybdenum content in the rosette in response to the lowered phosphate supply. QTLs for some traits were observed in all conditions, although their effect was condition dependent. This is the case for QTLs for molybdenum content (Mo_rs and Mo_rt in bin 2-4; Fig. 1A), for phosphate and for magnesium content (P_rs and Mg_rt in bin 3-1), for sodium content (Na_rs in bin 4-2/4-3), and for potassium and rubidium content (K_rs and Rb_rs in bin 5-5/5-6).
Colocalization of QTLs for Growth-Related Traits and Predictors
Because variation of growth-related traits has been partially and significantly explained by the variation of chlorophyll, protein, hexose, ionomic traits. or leaf number, we investigated colocalization between QTLs of growth-related traits and predictors to reveal common genetic bases between them. These colocalizations of QTLs for predictors were on average 11.5% more frequent than for nonpredictors, and this difference was highly significant (χ2 test; P < 0.0005) for each growth-related trait and condition. In fact, QTLs of root weight and root length on top of chromosome 1 were present in all nutrient regimes and colocated with several predictor QTLs (bin 1-3; Fig. 1A). Among them were QTLs for root iron content (Fe_rt) that were present in all conditions. Another growth QTL for the response of root length to P− was located close to this position (bin 1-2) and colocated with the root phosphate content QTL for the response to the P− regime. Close to the Erecta marker on chromosome 2, major QTLs of molybdenum content were detected (bin 2-4). Several growth-related trait QTLs were detected at the Erecta locus that explained a high variation of rosette weight and root weight in all nutrient regimes. On the top of chromosome 3, QTLs for phosphate content were detected in almost all conditions (bin 3-1). This hotspot of phosphate content QTLs coincided with QTLs for rosette weight, RGR, and root weight, which were only present in the control and/or P− regime. The only response QTL in the K− regime (bin 5-5) colocated with response QTLs for the rosette potassium content (K_rs), which is a predictor of the rosette weight response to K− (Table II). Furthermore, not only the response of rosette potassium content is a predictor for rosette weight response, but the rosette potassium content in all single conditions (C, K−, P−) is also a predictor for rosette weight. In accordance with this, we detected in this bin (bin 5-5/5-6) QTLs for rosette weight and QTLs for rosette potassium content (in all conditions). However, large effect QTLs for nonpredictor traits colocalized with growth-related traits (Fig. 1A; Supplemental Fig. S2). This is the case for QTLs for rosette sodium content, which were detected in all conditions (bin 4-2/4-3) and colocalized with root length QTLs (bin 4-3/4-4), even though rosette sodium content is not a predictor for root length.
Validation of the Rosette Weight Response QTL to the K− Regime and Accompanying Ion Changes
Some of the detected QTLs described above colocated with previously cloned QTLs for similar traits (Alonso-Blanco et al., 2009; see “Discussion”), and it is most probable that the previously cloned genes are also the ones underlying the effects of the QTLs in this study (see “Discussion”). However, the QTL for rosette weight response on the bottom of chromosome 5 has not been described before. Although QTLs for rosette weight have been detected at this locus in all the nutrient regimes tested, its effect is significantly different in the K− regime than in the other conditions (Fig. 1; Supplemental Fig. S2; Supplemental Table S1). In accordance, a response QTL for rosette weight has been detected at this locus (bin 5-5). To validate the presence of this QTL, three NILs carrying the alleles of Kas-2 at the bottom of chromosome 5 in an otherwise Ler background were selected (Fig. 2A), and responses of rosette weight to lowered potassium supply were quantified and compared with the response of Ler (Fig. 2B). Whereas the rosette weight was decreased by 34.3% in Ler grown in the reduced potassium medium compared with the control, the rosette weight of the three selected NILs was much less affected (10.7%–15.3%). These significant differences between the NILs and Ler confirmed the presence of the detected rosette weight response QTL on the bottom of chromosome 5.
Figure 2.

Validation of the rosette weight response QTL for the K− regime. A, Graphic representation of the genotypes of Ler and the selected NILs carrying an introgression of Kas-2 alleles on the bottom of chromosome 5 (for detailed genotyping, see Supplemental Fig. S3). B, Response of rosette weight to lowered potassium supply for the lines represented in A (mean ± se; n = 3 experiments). Values with differing letters are significantly different at P < 0.05.
In addition, we investigated the alterations in ion content due to the presence of Kas-2 alleles at this locus. In the control and the reduced potassium conditions, 29 ionomic QTLs have been detected on the bottom of chromosome 5 (Supplemental Table S1). Validations of these QTLs were also performed by comparing the ion content of Ler and one selected NIL (NIL3; Fig. 3). The QTLs for potassium content in the rosette (predictor for rosette weight) detected in both the control and the reduced potassium regimes have been validated, and as expected, the Kas-2 alleles increased the potassium content in NIL3. Nine other ion content QTLs have been validated using NIL3 (in C, P_rt, Rb_rs (twice); and in K−, Co_rt, Cu_rs, Na_rs, P_rt, Rb_rs, Zn_rs; Fig. 3). One QTL has been validated but with an opposite allelic effect (magnesium content in the rosette for the K− regime; Fig. 3B). In contrast, 14 QTLs were not validated using this approach. Nonetheless, although the differences between NIL3 and Ler were not significant for these ion contents, the observed tendencies in ion content differences between Ler and NIL3 were as expected from the QTL analysis in nearly all cases (except in K−, Mo_rt, Na_rt, Ni_rt). Furthermore, six other significant differences between the ion content of NIL3 and Ler have been revealed that were not expected from the QTL analysis (in C, B_rt, Fe_rs, Na_rt, Ni_rt; and in K−, Co_rs, Mn_rt; Fig. 3).
Figure 3.

Ion content of a selected NIL. Ion content of NIL3 (Fig. 2A) grown in C medium (A) or in K− medium (B). The ion content in the rosette (_rs) and the root (_rt) is expressed as a percentage change compared with the that of Ler (set as 100%). Significant differences between the NIL and Ler are indicated (* P < 0.05, ** P < 0.005, *** P < 0.001). The arrows indicate the presence of a detected QTL for the corresponding ion content, and the direction indicates if the Kas-2 alleles have a positive or negative effect on this ion content (up and down arrows, respectively). In some cases, QTLs for the same trait and with the same allelic effect colocated (in C, K_rs, Rb_rs, Zn_rs; in K−, K_rs); these QTLs are indicated by only one arrow here.
Several QTLs for predictors of rosette weight were validated with Ler and NIL3 in the control (K_rs and P_rt) or in the reduced potassium supply (Cu_rs, K_rs, Na_rs, and P_rt) regime, respectively. In the control, these predictors explained between 20% and 38% of the variation of rosette weight, and in K− they explained between 12% and 39% (except for Cu_rs, which explained 7%; Table II).
DISCUSSION
A set of Ler × Kas-2 RILs (El-Lithy et al., 2006) was grown hydroponically in three different mineral nutrient regimes: C, K−, and P−. Growth-related traits (rosette weight, root weight, root length, and RGR) of all the lines were measured in each condition as well as ionomic and biochemical traits. Variation among these traits in each condition enabled us to detect a total of 327 QTLs, spread over the entire genome of Arabidopsis.
We detected QTLs for each growth-related trait in plants grown in C, K−, and P− media. Some of the QTLs detected in our study explained up to 22% of the phenotypic variation. However, most of them explained only a small percentage of this variation. This low number of major growth-related QTLs is in accordance with the idea that variation of complex traits like growth is governed by many small-effect QTLs (Kroymann and Mitchell-Olds, 2005). Nonetheless, we identified 16 major QTLs, which explained between 25% and 62% of the ionomic variation. The detection of QTLs showed that the different nutrient regimes had an impact on the genetic determinism for most of the quantified traits, and a significant G × E interaction effect has been revealed for 60% of the QTLs. This environmental effect was confirmed through the detection of QTLs for the trait responses to environment, with response expressed as change in the percentage of a trait in the reduced nutrient supply compared with the control. Most of these response QTLs colocated with G × E QTLs and explained between 6.1% and 22.1% of phenotypic variation, with the exception of molybdenum content in response to reduced phosphate supply, which explained 40.9%.
In addition, a successful attempt to link growth-related traits and ionomic/biochemical/developmental traits was performed across different mineral regimes. Although previous studies have shown a high correlation between several carbohydrates and growth (Meyer et al., 2007; Sulpice et al., 2009), in our study total hexose content of the rosette was not found to be significantly associated with any of the variation of growth-related traits. We found a strong correlation between the variation of growth-related and ionomic traits, especially for the root and the rosette weight, for which ionomic variation explained between 70% and 85% of the variation, respectively. Correlations between the growth-related traits concurred with the number of common predictors found for these traits, emphasizing the impact of common predictors on growth per se.
Furthermore, QTLs of growth-related traits were found to colocate with QTLs of their predictors, and candidate genes responsible for these traits can be suggested within these genomic regions. For instance, the phosphate response QTL on the top of chromosome 1, which influenced variation in root length in reduced phosphate medium, colocated with a QTL for primary root growth arrest in response to phosphate starvation (Reymond et al., 2006). The QTL for primary root growth arrest has previously been cloned and identified as the gene LPR1, a multicopper oxidase that is involved in the perception of low phosphate status in the root cap (Svistoonoff et al., 2007). Ward et al. (2008) suggested that the primary root growth arrest could also be due to iron toxicity caused by a greater availability of iron in a reduced phosphate medium, implicating a role of LPR1 in iron distribution or uptake rather than in phosphate sensing. Interestingly, we detected a QTL for iron content colocating with the root length QTL at the LPR1 position.
Moreover, we detected QTLs for most growth-related traits as well as molybdenum content at the Erecta locus on chromosome 2 in all nutrient regimes. The studied RIL population is derived from a laboratory strain (Ler) for which the Erecta gene is mutated (Ungerer et al., 2002; Koornneef et al., 2004). This mutation is segregating among the RILs. Erecta encodes a receptor-like kinase involved in leaf, stem, and flower development (Torii et al., 1996; van Zanten et al., 2009). Also, for other populations derived from Ler, growth QTLs at this locus have already been reported (Ungerer et al., 2002; El-Lithy et al., 2004; Tisné et al., 2008). Therefore, the Erecta gene itself is a good candidate to explain the growth-related trait QTLs detected in all these studies, including ours. Baxter et al. (2008a) showed that variation in molybdenum content across several accessions of Arabidopsis is controlled by a putative molybdenum transporter (MOT1), which is located close to the locus of Erecta. Therefore, the variation of growth and the variation of molybdenum content are correlated, probably due to genetic linkage of Erecta and MOT1.
The group of QTLs at the top of chromosome 3, containing a major QTL for phosphate content, colocated with several growth-related traits that were only detected either in the control and/or reduced phosphate regime. QTLs for phytate and phosphate content in seeds and leaves have been previously identified at a similar position on chromosome 3 (Bentsink et al., 2003; using a Ler × Cape Verde Islands RIL population), and a vacuolar membrane ATPase subunit was considered to be a likely candidate underlying the effect of this QTL. Studies in the Ler × Antwerp-1 RIL population have also identified a phosphate concentration QTL on the top of chromosome 3 (Ghandilyan et al., 2009).
The QTL for sodium content on chromosome 4 colocated with a sodium transporter gene, AtHKT1, which is known to cause sodium content changes between several natural accessions of Arabidopsis (Rus et al., 2006). Our study revealed that the sodium QTL colocated with growth QTLs of root length. This transporter is known to function in the root to control both root and shoot sodium content (Mäser et al., 2002), and variation at this locus, therefore, could be implicated in the length variation we observed. However, sodium rosette content does not predict root length, and this colocalization could be due to the linkage of different genes.
Although some QTLs detected in our study colocalized with already known and cloned QTLs in Arabidopsis, most of them, to our knowledge, have never been reported. This is the case for the rosette weight response QTLs located on the bottom of chromosome 5, for which also a significant QTL × E interaction has been detected. In addition, this QTL is the only significant growth-related QTL in response to the K− regime. As a response QTL, it may be involved in the adaptation of the plant to reduced potassium availability. Because this QTL was of rather low effect (R2 = 9.3%), it was necessary to validate its effect by selecting suitable NILs (Alonso-Blanco and Koornneef, 2000; Reymond et al., 2007). The phenotypes of the NILs clearly validated the presence of the detected QTL for the response of rosette weight to the reduced potassium regime. We found that the NILs retained more than 20% fresh weight in the reduced potassium supply than Ler, and the Kas-2 allele on the bottom of chromosome 5 conferred a growth advantage to the plants under these conditions.
This QTL colocated with 29 ion content QTLs, among them QTLs for potassium content for plants grown in both the control and the reduced potassium regimes. Ion contents of NIL3 have been quantified in order to confirm this result. The ion content QTLs were generally of low effect. Low-effect QTLs are difficult to validate due to the complex genetics of those traits (Kroymann and Mitchell-Olds, 2005); therefore, it is not surprising that several ion content QTLs could not be validated, but only insignificant tendencies in ion content differences were observed between the lines. However, NIL3 showed a significantly higher potassium content in the rosette compared with Ler. Additionally, the rubidium content was also significantly higher in the NIL than in Ler (Fig. 3). Rubidium is a well-established chemical analog of potassium, and plant physiologists have used radioactive 86Rb for a long time to measure potassium uptake (Läuchli and Epstein, 1970; Pyo et al., 2010). Thus, rubidium quantification offers an independent replication of the potassium quantification. Subsequently, QTLs for rosette potassium and rubidium content colocalized on the bottom of chromosome 5 (Fig. 1), and elevated potassium and rubidium contents quantified in NIL3 validated these QTLs. The fact that the NIL had higher potassium content than Ler might contribute to its growth advantage in the reduced potassium supply condition.
Additionally, it is worth noting that major predictors for rosette weight in both control and K− regimes have been detected on the bottom of chromosome 5. Quantification of those predictors in NIL3 and Ler, which showed different growth patterns, not only enabled us to validate these QTLs but also support our choice of predictors (Table II), as variation in predictors went along with differential growth effects between the lines.
CONCLUSION
Overall, we were able to explain up to 85% of phenotypic variation in growth primarily with ionomic predictors. Our study highlights the importance of broader phenotypic quantification, with a particular focus on ionomic traits as being important drivers of growth. One of the detected growth-response QTLs was validated with NILs that retained over 20% more rosette weight in reduced potassium supply. This growth advantage was in accordance with a significant change in ionomic predictors that explain a high percentage of the variation in rosette weight. Further studies focusing on the identification of both molecular mechanisms underlying the relationship between the ionome and plant growth will provide new insights into the cellular biochemistry of growth.
MATERIALS AND METHODS
Plant Material
A total of 125 Arabidopsis (Arabidopsis thaliana) RILs derived from a cross between Ler (from Poland) and Kas-2 (from Kashmir; El-Lithy et al., 2006) were used for the QTL detection. Eighty-nine polymorphic markers were used to genotype all the RILs and to build a genetic map (JoinMap4; Kyazama). The length of the genetic map was 431.17 cM, and the average distance between markers was 4.84 cM (the maximum distance between markers being 13.88 cM, between snp204 and snp97 on chromosome 5). Three NILs were selected among the F2 population obtained from a back-cross between Ler and RIL 138. For the genotypic characterization of the NILs (Supplemental Fig. S3), new simple sequence length polymorphism and cleaved amplified polymorphic sequence markers were designed (Supplemental Table S2) based on polymorphism information from the Multiple SNP Query Tool (http://msqt.weigelworld.org).
Growth Conditions
Plants were sown on top of agar (0.65% Daishin agar; Duchefa Biochemie)-filled 0.5-mL microtubes with the tip removed. The tubes were soaked in nutrient solution containing one of the following: (1) Control (C), KNO3 2,000 μm, CaCl2·2H2O 300 μm, MgSO4·7H2O 150 μm, KH2PO4 150 μm, H3BO3 10 μm, MnSO4·H2O 15 μm, ZnSO4·7H2O 3 μm, KI 0.5 μm, Na2MoO4·2H2O 0.1 μm, CuSO4·5H2O 0.01 μm, CoCl2·6H2O 0.01 μm, FeSO4·7H2O 22.4 μm, Na2EDTA 22.3 μm, Ca(NO3)2·4H2O 1,000 μm; (2) reduced potassium supply (K−), KNO3 0 μm, CaCl2·2H2O 300 μm, MgSO4·7H2O 150 μm, KH2PO4 150 μm, H3BO3 10 μm, MnSO4·H2O 15 μm, ZnSO4·7H2O 3 μm, KI 0.5 μm, Na2MoO4·2H2O 0.1 μm, CuSO4·5H2O 0.01 μm, CoCl2·6H2O 0.01 μm, FeSO4·7H2O 22.4 μm, Na2EDTA 22.3 μm, Ca(NO3)2·4H2O 2,000 μm; or (3) reduced phosphate supply (P−), KNO3 2,000 μm, CaCl2·2H2O 300 μm, MgSO4·7H2O 150 μm, KH2PO4 32 μm, H3BO3 10 μm, MnSO4·H2O 15 μm, ZnSO4·7H2O 3 μm, KI 0.5 μm, Na2MoO4·2H2O 0.1 μm, CuSO4·5H2O 0.01 μm, CoCl2·6H2O 0.01 μm, FeSO4·7H2O 22.4 μm, Na2EDTA 22.3 μm, KCl 118 μm, Ca(NO3)2·4H2O 1,000 μm.
The solutions were buffered with 2.39 mm MES (adjusted to a pH of 6.00 with KOH). The final pH of the solutions was 5.80. After a 4-d cold treatment, the tubes containing the plants were transferred to a climate-controlled cabinet (AR95L; Percival Scientific). The plants were grown in an 81-hole tray suspended in nutrient solution (Tocquin et al., 2003). They were kept in 8 h of light and 16 h of dark with an average intensity of 15,000 lux (with additional 15 min of light provided by bulbs of 200 lux before and after the onset of the light), with a temperature of 22°C and a humidity of approximately 60% during the light period and a temperature of 18°C and a humidity of approximately 80% during the dark period. For the mapping experiments, nine replicates were grown for each RIL.
For the validation of the potassium response QTL, the same growth conditions mentioned above have been applied but with a lower potassium supply for the K− nutrient regime: KNO3 0 μm, KH2PO4 107 μm, Ca(NO3)2·4H2O 2,000 μm, Ca(H2PO4)2·H2O 21.5 μm (the other ion concentrations did not vary from the control solution). The solution was buffered with 2.39 mm MES (adjusted to a pH of 6.00 with NaOH), and the plants were grown in a randomized sowing scheme with five, 10, or 11 replicates depending on the experiment.
Quantification of the Traits
Photographs of the trays were taken at 7, 10, 15, 17, 20, and 22 DAT from the 4°C stratification treatment into the light, and projected leaf area (cm2) for each plant, and for each date, was quantified using Image Pro Analyzer 6.0 (Mediacybernetics). The RGR was calculated based on the projected leaf area and represents the slope of the exponential change in projected leaf area over time. The leaf number was scored at 22 and 32 DAT. Plants were harvested at 32 DAT, and the fresh weight of the rosette and the roots as well as root length (complete length of the root apparatus stretched out on a straight surface) of each plant were quantified. The response of a trait was calculated as the percentage change of the trait observed in plants grown in the nutrient solution with lowered mineral nutrient supply compared with plants grown in the control solution: ((traitin control − traitin K−/P−)/traitin control) × 100.
In addition, the leaves were also analyzed for hexose, protein, and chlorophyll contents. Approximately 300 to 500 mg of fresh leaf material was ground, and the cell debris was washed three times with 500 μL of 80% ethanol and heated at 80°C for 10 min to extract sugars and chlorophylls. Half of the extraction (750 μL) was kept on ice in opaque 2-mL microtubes (Sigma-Aldrich) followed by the colorimetric analysis at three different wavelengths (646, 663, and 750 nm). The levels of chlorophyll a (Chla) and b (Chlb) were calculated as followed:
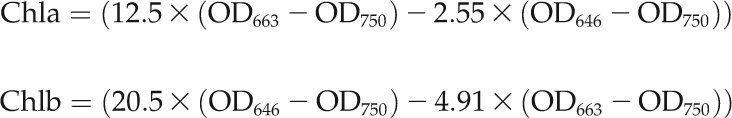 |
where OD represents optical density.
The amount of chlorophyll was divided by the quantity of used fresh weight and the volume of extract used for the colorimetric analysis. The other half of the sample (750 μL) was dried overnight in a rotary evaporator. The pellet was dissolved in 500 μL of deionized water, and the quantification of total hexoses was performed according to Viola and Davies (1992). Protein extraction was performed by washing cell debris of 300 to 500 mg of crushed, fresh leaf material three times with 300 μL of 0.1 m Tris-HCl/0.1% Triton X-100, pH 7, by vortexing it for 10 min. Protein quantification was done on 96-well microtiter plates using Coomassie Plus Protein Assay Reagent (Thermo Scientific).
For the analysis of mineral nutrients in plant tissues, approximately 2 to 8 mg of dried powdered lyophilized tissue was placed into 100- × 16-mm Pyrex tubes and digested with 0.7 mL of concentrated HNO3 (Mallinckrodt; AR Select grade) at 110°C for 4 h. Each sample was diluted to 6.0 mL with 18 MΩ water and analyzed on a Perkin-Elmer Elan DRCe inductively coupled plasma mass spectrometry. Indium (EM Science) was used as an internal standard. National Institute of Standards and Technology traceable calibration standards (ULTRAScientific) were used for the calibration. For each genotype, three samples containing pooled plant material of three individual plants were used for the QTL detection. Plant material from four experiments was used for obtaining rosette material for the ionomic quantification of NIL3 and Ler, whereas plant material from two experiments was used for obtaining root material. Three samples per genotype and condition were quantified, with each sample containing on average the root material of three individual plants or the rosette material of four individual plants.
Statistical Analyses
Phenotypic Data Analysis
For each trait in each of the three treatments (C, K−, P−), adjusted entry means were calculated for all RILs based on the model
where yij is the phenotypic observation of the ith RIL in the jth block, μ is the general mean, RILi is the effect of the ith RIL (regarded as fixed), and eij is the residual. Furthermore, heritability on an entry mean basis was calculated, where σ2g was the genotypic variance and was the mean phenotypic variance of the difference between two adjusted entry means (Holland et al., 2003), based on the following formula:
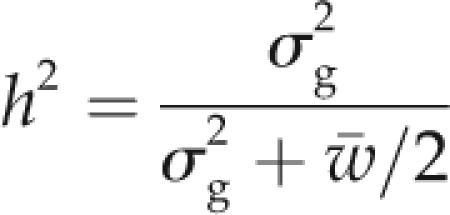 |
For each of the growth-related traits (rosette weight, root weight, root length, and RGR), we performed separately all subset multiple regressions based on the Schwarz (1978) Bayesian criterion to select those traits from the following list that best explain the variation: B_rs, B_rt, Ca_rs, Ca_rt, Cd_rs, Cd_rt, Co_rs, Co_rt, Cu_rs, Cu_rt, Fe_rs, Fe_rt, K_rs, K_rt, Mg_rs, Mg_rt, Mn_rs, Mn_rt, Mo_rs, Mo_rt, Na_rs, Na_rt, Ni_rs, Ni rt, P_rs, P_rt, Rb_rs, Rb_rt, S_rs, S_rt, Zn_rs, Zn_rt (with “rs” being the respective ion content in the rosette and “rt” in the roots), chlorophyll a and b, total leaf proteins, total leaf hexoses, leaf number at 22 DAT (L22), and leaf number at 32 DAT (L32). These calculations were performed using R package leaps. Furthermore, we used multivariate all subset multiple regression in order to identify the traits best explaining the variation of all growth-related traits together. The traits selected are called “predictors.” To test whether the occurrence of colocalization for growth-related trait QTLs and their predictor QTLs is higher than for the nonpredictor QTLs, a χ2 test was performed. The test compared the frequency of the colocalizing and the noncolocalizing QTLs for predictors and nonpredictors for each growth-related trait in each condition.
QTL Analyses
For each trait, the values per RIL were averaged, and a QTL analysis was performed with MapQTL 5.0 (Van Ooijen, 2004; Kyazama) using the Multiple QTL Models procedure. This approach consists first of selecting cofactors, which are markers selected to take over the role of nearby putative QTLs. Markers used as cofactors have been chosen by backward selection, and for each QTL detected, a marker near the QTL has been used as a cofactor in the final model (Supplemental Table S1). With this Multiple QTL Models mapping, a one-dimensional search over the genome is performed by testing for segregating QTLs as in interval mapping while simultaneously fitting the selected cofactors (Jansen and Stam, 1994). Incompatible lines (Alcázar et al., 2009) were removed from the QTL analysis in order to avoid confusion of effects on growth-related traits. A permutation test using 1,000 permutations of the original data resulted in a genome-wide 95% logarithm of the odds (LOD) threshold of 2.4 on average over all the traits (2.417 ± 0.137). The length of the QTL was determined according to a LOD − 1 support interval. Analysis of QTL × E interactions has been performed using the statement E in PLABQTL version 1.2 (H.F. Utz and A.E. Melchinger, unpublished data) on the set of previously detected QTLs.
For comparison of the selected NILs with the Ler parental line, the se between the responses of three independent experiments was calculated and the statistical significance was tested with a Student-Newman-Keuls test.
For the ionomic comparison between NIL3 and Ler, the significance was tested with an ANOVA (univariate linear model; using SPSS 13.0 for Windows).
Supplemental Data
The following materials are available in the online version of this article.
Supplemental Figure S1. Correlations of the selected predictors for the growth-related traits.
Supplemental Figure S2. QTL mapping for growth-related traits (rosette weight, RGR, root weight, and root length), for chlorophyll (Chla, Chlb), protein, hexose, and ionomic traits (for rosette [rs] and root [rt] tissue), and for leaf number at 22 DAT (L22) and 32 DAT (L32).
Supplemental Figure S3. Graphic presentation of the genotypes of Ler, RIL138, and the NILs.
Supplemental Table S1. List of all detected QTLs.
Supplemental Table S2. Primers designed for genotyping of the NILs.
Supplementary Material
Acknowledgments
We are grateful to Maarten Koornneef for critical comments. We also thank Barbara Eilts for her meticulous technical support and Regina Gentges for highly valued help in the greenhouse. We acknowledge Bjorn Pieper for sharing F1 seeds from the cross between RIL138 and Ler. We also thank Alexis Walker for grammatical and spelling corrections to the manuscript.
References
- Abel S, Ticconi CA, Delatorre CA. (2002) Phosphate sensing in higher plants. Physiol Plant 115: 1–8 [DOI] [PubMed] [Google Scholar]
- Alcázar R, García AV, Parker JE, Reymond M. (2009) Incremental steps toward incompatibility revealed by Arabidopsis epistatic interactions modulating salicylic acid pathway activation. Proc Natl Acad Sci USA 106: 334–339 [DOI] [PMC free article] [PubMed] [Google Scholar]
- Alonso-Blanco C, Aarts MG, Bentsink L, Keurentjes JJ, Reymond M, Vreugdenhil D, Koornneef M. (2009) What has natural variation taught us about plant development, physiology, and adaptation? Plant Cell 21: 1877–1896 [DOI] [PMC free article] [PubMed] [Google Scholar]
- Alonso-Blanco C, Koornneef M. (2000) Naturally occurring variation in Arabidopsis: an underexploited resource for plant genetics. Trends Plant Sci 5: 22–29 [DOI] [PubMed] [Google Scholar]
- Amtmann A, Troufflard S, Armengaud P. (2008) The effect of potassium nutrition on pest and disease resistance in plants. Physiol Plant 133: 682–691 [DOI] [PubMed] [Google Scholar]
- Armengaud P, Breitling R, Amtmann A. (2004) The potassium-dependent transcriptome of Arabidopsis reveals a prominent role of jasmonic acid in nutrient signaling. Plant Physiol 136: 2556–2576 [DOI] [PMC free article] [PubMed] [Google Scholar]
- Ashley MK, Grant M, Grabov A. (2006) Plant responses to potassium deficiencies: a role for potassium transport proteins. J Exp Bot 57: 425–436 [DOI] [PubMed] [Google Scholar]
- Barto EK, Cipollini D. (2005) Testing the optimal defense theory and the growth-differentiation balance hypothesis in Arabidopsis thaliana. Oecologia 146: 169–178 [DOI] [PubMed] [Google Scholar]
- Baxter I, Muthukumar B, Park HC, Buchner P, Lahner B, Danku J, Zhao K, Lee J, Hawkesford MJ, Guerinot ML.et al (2008a) Variation in molybdenum content across broadly distributed populations of Arabidopsis thaliana is controlled by a mitochondrial molybdenum transporter (MOT1). PLoS Genet 4: e1000004. [DOI] [PMC free article] [PubMed] [Google Scholar]
- Baxter IR, Vitek O, Lahner B, Muthukumar B, Borghi M, Morrissey J, Guerinot ML, Salt DE. (2008b) The leaf ionome as a multivariable system to detect a plant’s physiological status. Proc Natl Acad Sci USA 105: 12081–12086 [DOI] [PMC free article] [PubMed] [Google Scholar]
- Bentsink L, Yuan K, Koornneef M, Vreugdenhil D. (2003) The genetics of phytate and phosphate accumulation in seeds and leaves of Arabidopsis thaliana, using natural variation. Theor Appl Genet 106: 1234–1243 [DOI] [PubMed] [Google Scholar]
- Buchanan BB, Gruissem W, Jones RJ. (2002) Biochemistry and Molecular Biology of Plants. John Wiley * Sons, West Sussex, UK [Google Scholar]
- Carroll A, Somerville C. (2009) Cellulosic biofuels. Annu Rev Plant Biol 60: 165–182 [DOI] [PubMed] [Google Scholar]
- Christian M, Steffens B, Schenck D, Burmester S, Böttger M, Lüthen H. (2006) How does auxin enhance cell elongation? Roles of auxin-binding proteins and potassium channels in growth control. Plant Biol (Stuttg) 8: 346–352 [DOI] [PubMed] [Google Scholar]
- Clarkson DT. (1980) The mineral nutrition of higher plants. Annu Rev Plant Physiol 31: 239–298 [Google Scholar]
- Di Cera E. (2006) A structural perspective on enzymes activated by monovalent cations. J Biol Chem 281: 1305–1308 [DOI] [PubMed] [Google Scholar]
- Doerner P. (2008) Phosphate starvation signaling: a threesome controls systemic P(i) homeostasis. Curr Opin Plant Biol 11: 536–540 [DOI] [PubMed] [Google Scholar]
- Donohue K, Dorn L, Griffith C, Kim E, Aguilera A, Polisetty CR, Schmitt J. (2005) Environmental and genetic influences on the germination of Arabidopsis thaliana in the field. Evolution 59: 740–757 [PubMed] [Google Scholar]
- El-Lithy ME, Bentsink L, Hanhart CJ, Ruys GJ, Rovito D, Broekhof JLM, van der Poel HJA, van Eijk MJT, Vreugdenhil D, Koornneef M. (2006) New Arabidopsis recombinant inbred line populations genotyped using SNPWave and their use for mapping flowering-time quantitative trait loci. Genetics 172: 1867–1876 [DOI] [PMC free article] [PubMed] [Google Scholar]
- El-Lithy ME, Clerkx EJM, Ruys GJ, Koornneef M, Vreugdenhil D. (2004) Quantitative trait locus analysis of growth-related traits in a new Arabidopsis recombinant inbred population. Plant Physiol 135: 444–458 [DOI] [PMC free article] [PubMed] [Google Scholar]
- Elumalai RP, Nagpal P, Reed JW. (2002) A mutation in the Arabidopsis KT2/KUP2 potassium transporter gene affects shoot cell expansion. Plant Cell 14: 119–131 [DOI] [PMC free article] [PubMed] [Google Scholar]
- Ghandilyan A, Barboza L, Tisné S, Granier C, Reymond M, Koornneef M, Schat H, Aarts MG. (2009) Genetic analysis identifies quantitative trait loci controlling rosette mineral concentrations in Arabidopsis thaliana under drought. New Phytol 184: 180–192 [DOI] [PubMed] [Google Scholar]
- Gilbert N. (2009) Environment: the disappearing nutrient. Nature 461: 716–718 [DOI] [PubMed] [Google Scholar]
- Harada H, Leigh RA. (2006) Genetic mapping of natural variation in potassium concentrations in shoots of Arabidopsis thaliana. J Exp Bot 57: 953–960 [DOI] [PubMed] [Google Scholar]
- Holland J, Nyquist W, Cervantes-Martinez C. (2003) Estimating and interpreting heritability for plant breeding: an update. Plant Breed Rev 22: 9–112 [Google Scholar]
- Jansen RC, Stam P. (1994) High resolution of quantitative traits into multiple loci via interval mapping. Genetics 136: 1447–1455 [DOI] [PMC free article] [PubMed] [Google Scholar]
- Jiang C, Gao X, Liao L, Harberd NP, Fu X. (2007) Phosphate starvation root architecture and anthocyanin accumulation responses are modulated by the gibberellin-DELLA signaling pathway in Arabidopsis. Plant Physiol 145: 1460–1470 [DOI] [PMC free article] [PubMed] [Google Scholar]
- Jordan-Meille L, Pellerin S. (2008) Shoot and root growth of hydroponic maize (Zea mays L.) as influenced by K deficiency. Plant Soil 304: 157–168 [Google Scholar]
- Jung JY, Shin R, Schachtman DP. (2009) Ethylene mediates response and tolerance to potassium deprivation in Arabidopsis. Plant Cell 21: 607–621 [DOI] [PMC free article] [PubMed] [Google Scholar]
- Koornneef M, Alonso-Blanco C, Vreugdenhil D. (2004) Naturally occurring genetic variation in Arabidopsis thaliana. Annu Rev Plant Biol 55: 141–172 [DOI] [PubMed] [Google Scholar]
- Korves TM, Schmid KJ, Caicedo AL, Mays C, Stinchcombe JR, Purugganan MD, Schmitt J. (2007) Fitness effects associated with the major flowering time gene FRIGIDA in Arabidopsis thaliana in the field. Am Nat 169: E141–E157 [DOI] [PubMed] [Google Scholar]
- Kroymann J, Mitchell-Olds T. (2005) Epistasis and balanced polymorphism influencing complex trait variation. Nature 435: 95–98 [DOI] [PubMed] [Google Scholar]
- Lai F, Thacker J, Li Y, Doerner P. (2007) Cell division activity determines the magnitude of phosphate starvation responses in Arabidopsis. Plant J 50: 545–556 [DOI] [PubMed] [Google Scholar]
- Läuchli A, Epstein E. (1970) Transport of potassium and rubidium in plant roots: the significance of calcium. Plant Physiol 45: 639–641 [DOI] [PMC free article] [PubMed] [Google Scholar]
- López-Bucio J, Hernández-Abreu E, Sánchez-Calderón L, Pérez-Torres A, Rampey RA, Bartel B, Herrera-Estrella L. (2005) An auxin transport independent pathway is involved in phosphate stress-induced root architectural alterations in Arabidopsis: identification of BIG as a mediator of auxin in pericycle cell activation. Plant Physiol 137: 681–691 [DOI] [PMC free article] [PubMed] [Google Scholar]
- Loudet O, Chaillou S, Merigout P, Talbotec J, Daniel-Vedele F. (2003) Quantitative trait loci analysis of nitrogen use efficiency in Arabidopsis. Plant Physiol 131: 345–358 [DOI] [PMC free article] [PubMed] [Google Scholar]
- Luan S, Lan W, Chul Lee S. (2009) Potassium nutrition, sodium toxicity, and calcium signaling: connections through the CBL-CIPK network. Curr Opin Plant Biol 12: 339–346 [DOI] [PubMed] [Google Scholar]
- Maathuis FJM, Sanders D. (1996) Mechanisms of potassium absorption by higher plant roots. Physiol Plant 96: 158–168 [Google Scholar]
- Marschner H. (1995) Mineral Nutrition of Higher Plants, Ed 2. Academic Press, London [Google Scholar]
- Mäser P, Eckelman B, Vaidyanathan R, Horie T, Fairbairn DJ, Kubo M, Yamagami M, Yamaguchi K, Nishimura M, Uozumi N, et al. (2002) Altered shoot/root Na+ distribution and bifurcating salt sensitivity in Arabidopsis by genetic disruption of the Na+ transporter AtHKT1. FEBS Lett 531: 157–161 [DOI] [PubMed] [Google Scholar]
- Meyer RC, Steinfath M, Lisec J, Becher M, Witucka-Wall H, Törjék O, Fiehn O, Eckardt A, Willmitzer L, Selbig J.et al (2007) The metabolic signature related to high plant growth rate in Arabidopsis thaliana. Proc Natl Acad Sci USA 104: 4759–4764 [DOI] [PMC free article] [PubMed] [Google Scholar]
- Milla R, Escudero A, Iriondo JM. (2009) Inherited variability in multiple traits determines fitness in populations of an annual legume from contrasting latitudinal origins. Ann Bot (Lond) 103: 1279–1289 [DOI] [PMC free article] [PubMed] [Google Scholar]
- Morrissey J, Baxter IR, Lee J, Li L, Lahner B, Grotz N, Kaplan J, Salt DE, Guerinot ML. (2009) The ferroportin metal efflux proteins function in iron and cobalt homeostasis in Arabidopsis. Plant Cell 21: 3326–3338 [DOI] [PMC free article] [PubMed] [Google Scholar]
- Philippar K, Fuchs I, Luthen H, Hoth S, Bauer CS, Haga K, Thiel G, Ljung K, Sandberg G, Bottger M.et al (1999) Auxin-induced K+ channel expression represents an essential step in coleoptile growth and gravitropism. Proc Natl Acad Sci USA 96: 12186–12191 [DOI] [PMC free article] [PubMed] [Google Scholar]
- Poirier Y, Bucher M. (2008) Phosphate transport and homeostasis in Arabidopsis. The Arabidopsis Book. American Society of Plant Biologists, Rockville, MD, doi/10.1199/tab.0024, http://www.aspb.org/publications/arabidopsis/ [DOI] [PMC free article] [PubMed] [Google Scholar]
- Pyo Y, Gierth M, Schroeder JI, Cho MH. (2010) High-affinity K+ transport in Arabidopsis: AtHAK5 and AKT1 are vital for seedling establishment and postgermination growth under low K+ conditions. Plant Physiol 153: 863–875 [DOI] [PMC free article] [PubMed] [Google Scholar]
- Rauh L, Basten C, Buckler S., IV (2002) Quantitative trait loci analysis of growth response to varying nitrogen sources in Arabidopsis thaliana. Theor Appl Genet 104: 743–750 [DOI] [PubMed] [Google Scholar]
- Rengel Z, Damon PM. (2008) Crops and genotypes differ in efficiency of potassium uptake and use. Physiol Plant 133: 624–636 [DOI] [PubMed] [Google Scholar]
- Reymond M, Pieper B, Barbier H, Ihnatowicz A, El-Lithy M, Vreugdenhil D, Koornneef M. (2007) Genetic and molecular analysis of growth responses to environmental factors using Arabidopsis thaliana natural variation. Spiertz JHJ, Struik PC, van Laar HH, , Scale and Complexity in Plant Systems Research: Gene-Plant-Crop Relations, Wageningen UR Frontis Series, Vol 21 Springer, Dordrecht, The Netherlands, pp 3–13 [Google Scholar]
- Reymond M, Svistoonoff S, Loudet O, Nussaume L, Desnos T. (2006) Identification of QTL controlling root growth response to phosphate starvation in Arabidopsis thaliana. Plant Cell Environ 29: 115–125 [DOI] [PubMed] [Google Scholar]
- Rus A, Baxter I, Muthukumar B, Gustin J, Lahner B, Yakubova E, Salt DE. (2006) Natural variants of AtHKT1 enhance Na+ accumulation in two wild populations of Arabidopsis. PLoS Genet 2: e210. [DOI] [PMC free article] [PubMed] [Google Scholar]
- Ryan PR, Delhaize E, Jones DL. (2001) Function and mechanism of organic anion exudation from plant roots. Annu Rev Plant Physiol Plant Mol Biol 52: 527–560 [DOI] [PubMed] [Google Scholar]
- Sano T, Becker D, Ivashikina N, Wegner LH, Zimmermann U, Roelfsema MR, Nagata T, Hedrich R. (2007) Plant cells must pass a K+ threshold to re-enter the cell cycle. Plant J 50: 401–413 [DOI] [PubMed] [Google Scholar]
- Schauer N, Semel Y, Balbo I, Steinfath M, Repsilber D, Selbig J, Pleban T, Zamir D, Fernie AR. (2008) Mode of inheritance of primary metabolic traits in tomato. Plant Cell 20: 509–523 [DOI] [PMC free article] [PubMed] [Google Scholar]
- Schwarz G. (1978) Estimating the dimension of a model. Ann Stat 6: 461–464 [Google Scholar]
- Shirvani T, Samedova A, Jangirova S, Salayeva K, Piriyev I, Huseinova N. (2001) Adaptive strategy of plants for survival under N, P, K limitation. Horst WJ, Schenk MK, Bürkert A, Claassen N, Flessa H, Frommer WB, Goldbach H, Olfs H-W, Römheld V, Sattelmacher B, Schmidhalter U, Schubert S, Wirén NV, Wittenmayer L, , Plant Nutrition. Kluwer Academic Publishers, Dordrecht, The Netherlands, pp 170–171 [Google Scholar]
- Sinclair TR. (1992) Mineral nutrition and plant growth response to climate change. J Exp Bot 43: 1141–1146 [Google Scholar]
- Sulpice R, Pyl ET, Ishihara H, Trenkamp S, Steinfath M, Witucka-Wall H, Gibon Y, Usadel B, Poree F, Piques MC, et al. (2009) Starch as a major integrator in the regulation of plant growth. Proc Natl Acad Sci USA 106: 10348–10353 [DOI] [PMC free article] [PubMed] [Google Scholar]
- Svistoonoff S, Creff A, Reymond M, Sigoillot-Claude C, Ricaud L, Blanchet A, Nussaume L, Desnos T. (2007) Root tip contact with low-phosphate media reprograms plant root architecture. Nat Genet 39: 792–796 [DOI] [PubMed] [Google Scholar]
- Tisné S, Reymond M, Vile D, Fabre J, Dauzat M, Koornneef M, Granier C. (2008) Combined genetic and modeling approaches reveal that epidermal cell area and number in leaves are controlled by leaf and plant developmental processes in Arabidopsis. Plant Physiol 148: 1117–1127 [DOI] [PMC free article] [PubMed] [Google Scholar]
- Tocquin P, Corbesier L, Havelange A, Pieltain A, Kurtem E, Bernier G, Périlleux C. (2003) A novel high efficiency, low maintenance, hydroponic system for synchronous growth and flowering of Arabidopsis thaliana. BMC Plant Biol 3: 2. [DOI] [PMC free article] [PubMed] [Google Scholar]
- Torii KU, Mitsukawa N, Oosumi T, Matsuura Y, Yokoyama R, Whittier RF, Komeda Y. (1996) The Arabidopsis ERECTA gene encodes a putative receptor protein kinase with extracellular leucine-rich repeats. Plant Cell 8: 735–746 [DOI] [PMC free article] [PubMed] [Google Scholar]
- Ungerer MC, Halldorsdottir SS, Modliszewski JL, Mackay TF, Purugganan MD. (2002) Quantitative trait loci for inflorescence development in Arabidopsis thaliana. Genetics 160: 1133–1151 [DOI] [PMC free article] [PubMed] [Google Scholar]
- Van Ooijen JW. (2004) MapQTL®5, Software for mapping of quantitative loci in experimental populations. Kyazma B.V., Wageningen, The Netherlands [Google Scholar]
- van Zanten M, Snoek LB, Proveniers MCG, Peeters AJM. (2009) The many functions of ERECTA. Trends Plant Sci 14: 214–218 [DOI] [PubMed] [Google Scholar]
- Véry AA, Sentenac H. (2003) Molecular mechanisms and regulation of K+ transport in higher plants. Annu Rev Plant Biol 54: 575–603 [DOI] [PubMed] [Google Scholar]
- Vijayraghavan V, Soole K. (2010) Effect of short- and long-term phosphate stress on the non-phosphorylating pathway of mitochondrial electron transport in Arabidopsis thaliana. Funct Plant Biol 37: 455–466 [Google Scholar]
- Viola R, Davies HV. (1992) A microplate reader assay for rapid enzymatic quantification of sugars in potato tubers. Potato Res 35: 55–58 [Google Scholar]
- Vreugdenhil D, Aarts MGM, Koornneef M, Nelissen H, Ernst WHO. (2004) Natural variation and QTL analysis for cationic mineral content in seeds of Arabidopsis thaliana. Plant Cell Environ 27: 828–839 [Google Scholar]
- Wang Y, Wu WH. (2010) Plant sensing and signaling in response to K+-deficiency. Mol Plant 3: 280–287 [DOI] [PubMed] [Google Scholar]
- Ward JT, Lahner B, Yakubova E, Salt DE, Raghothama KG. (2008) The effect of iron on the primary root elongation of Arabidopsis during phosphate deficiency. Plant Physiol 147: 1181–1191 [DOI] [PMC free article] [PubMed] [Google Scholar]
- Waters BM, Grusak MA. (2008) Quantitative trait locus mapping for seed mineral concentrations in two Arabidopsis thaliana recombinant inbred populations. New Phytol 179: 1033–1047 [DOI] [PubMed] [Google Scholar]
- Williamson LC, Ribrioux SPCP, Fitter AH, Leyser HMO. (2001) Phosphate availability regulates root system architecture in Arabidopsis. Plant Physiol 126: 875–882 [DOI] [PMC free article] [PubMed] [Google Scholar]
Associated Data
This section collects any data citations, data availability statements, or supplementary materials included in this article.