

Abstract
Endothelial cells establish an instructive vascular niche that reconstitutes haematopoietic stem and progenitor cells (HSPCs) through release of specific paracrine growth factors, known as angiocrine factors. However, the mechanism by which endothelial cells balance the rate of proliferation and lineage-specific differentiation of HSPCs is unknown. Here, we demonstrate that Akt activation in endothelial cells, through recruitment of mTOR, but not the FoxO pathway, upregulates specific angiocrine factors that support expansion of CD34−Flt3− KLS HSPCs with long-term haematopoietic stem cell (LT-HSC) repopulation capacity. Conversely, co-activation of Akt-stimulated endothelial cells with p42/44 MAPK shifts the balance towards maintenance and differentiation of the HSPCs. Selective activation of Akt1 in the endothelial cells of adult mice increased the number of colony forming units in the spleen and CD34−Flt3− KLS HSPCs with LT-HSC activity in the bone marrow, accelerating haematopoietic recovery. Therefore, the activation state of endothelial cells modulates reconstitution of HSPCs through the upregulation of angiocrine factors, with Akt–mTOR-activated endothelial cells supporting the self-renewal of LT-HSCs and expansion of HSPCs, whereas MAPK co-activation favours maintenance and lineage-specific differentiation of HSPCs.
Acute injury to the bone marrow microenvironment, after treatment with chemotherapy and irradiation, or myelotoxin, suppresses haematopoiesis, which results in the depletion of HSPCs and the development of life-threatening pancytopenias. The interaction of the surviving HSPCs with the bone marrow niche cells rapidly reconstitutes haematopoiesis, rescuing the host from complications associated with long-term bone marrow suppression. Bone marrow niches orchestrate maintenance, expansion and trafficking of HSPCs1–5. The osteogenic niche modulates the quiescence of the HSPCs1–2, whereas the vascular niche, demarcated by the bone marrow sinusoidal endothelial cells (SECs), regenerates and replenishes the HSPC population after myeloablation6–8. Bone marrow SECs also provide a cellular platform for the differentiation of lineage-committed progenitors, such as megakaryocytic progenitor cells9. Hence, endothelial cells not only contribute to maintenance of the HSPCs, but also reconstitute multi-lineage haematopoiesis. However, the molecular pathways activated in endothelial cells that modulate the differential self-renewal and maturation of the HSPCs remain unknown. One mechanism by which endothelial cells regulate the homeostasis of HSPCs might be mediated through the production of specific endothelial-cell-derived paracrine trophogens, known as angiocrine factors10–12. The expression of angiocrine factors is dependent on the physiological context, and how endothelial cells are activated. For example, infection or hypoxia induces endothelial cells to express adhesion molecules and chemokines that modulate the recruitment of immune cells to the inflamed or injured tissues10,13–15. Similarly, during haematopoietic recovery the release of angiogenic factors within the bone marrow microenvironment, such as Akt and p42/44 mitogen-activated protein kinase (MAPK) in SECs, may activate signalling pathways that promote the timely reconstitution of haematopoiesis. Specifically, following bone marrow suppression, release of the prototypical angiogenic factor vascular endothelial growth factor-A (VEGF-A) stimulates the expression of Notch ligands by the bone marrow SECs, which prevent the exhaustion of HSPCs12. Here, we have developed in vitro and in vivo angiogenic models to demonstrate that Akt-activated endothelial cells replenish the depleted population of HSPCs through upregulation of a specific set of angiocrine factors, accelerating reconstitution of mature lineages of haematopoietic cells and preventing prolonged bone marrow suppression.
Results
Endothelial cells support both self-renewal and lineage-specific differentiation of HSPCs
Studying the role of primary human endothelial cells (PECs) in the regulation of haematopoiesis has been hampered by the need for growthfactor deprivation during culture, which leads to apoptosis of PECs. Supplementation with serum and angiogenic factors, such as VEGF-A and basic-fibroblast growth factor (FGF2), are therefore necessary to maintain PECs for co-culture with HSPCs. However, serum inhibits the self-renewal of HSPCs, whereas FGF2 promotes self-renewal of HSPCs16, rendering it difficult to assess the cell-autonomous capacity of PECs to support HSPC homeostasis. To circumvent this problem, PECs can be transduced with an adenovirus gene, early region 4 encoded open reading frame-1 (E4ORF1), which leads to constitutive activation of Akt and enables co-culturing of PECs with HSPCs in serum- and growth factor-free medium for weeks, while maintaining their angiogenic attributes17. This co-culture model allows for the identification of angiocrine factors produced by activated endothelial cells that modulate homeostasis of HSPCs.
E4ORF1-transduced PECs expand repopulating cKit+Lineage−Sca1+ (KLS) HSPCs12, but their role in the generation of lineage-specific mature haematopoietic cells remains unknown. We isolated haematopoietic lineage-negative (Lin−) HSPCs from mouse bone marrow, followed by co-culture with or without human umbilical cord vein endothelial cells (HUVECs) transduced with E4ORF1 (E4–PECs). E4–PECs supported expansion of Lin− cells and also Lin+ mature haematopoietic cells (Supplementary Information, Fig. S1a, b). Conversely, without E4–PECs, or on co-culture with paraformaldehyde-fixed E4–PECs, both Lin− and Lin+ cell number decreased. The presence of serum in the co-culture also decreased Lin− cell number. Competitive repopulation assay showed that the Lin− cells expanded on E4–PECs had long-term (> 3 months) engraftment potential in all transplanted mice (Supplementary Information, Fig. S1c), demonstrating that E4–PECs induce proliferation of repopulating HSPCs. Therefore, E4–PECs regenerate HSPCs and mature haematopoietic cells, probably by expressing angiocrine factors.
Akt-activated endothelial cells support HSPC expansion more effectively than MAPK-activated endothelial cells
As transduction of PECs with E4ORF1 activates Akt, but not MAPK17, we hypothesized that E4–PECs expand HSPCs through activation of the Akt pathway. However, a previous study found that MAPK-activated endothelial cells, proliferating during bone marrow regeneration, promote maturation of megakaryocyte progenitors9. This suggests that the extent of Akt versus MAPK activation, two main signalling pathways involved in angiogenesis18–20, might also balance the rates of expansion and differentiation of HSPCs by modulating the expression of various endothelial cell-derived angiocrine factors. To determine the mechanism by which differential Akt and MAPK activation of endothelial cells modulates the homeostasis of HSPCs, Akt-activated PECs (Akt–PECs), MAPK-activated PECs (MAPK–PECs), and both Akt- and MAPK-co-activated PECs (Akt + MAPK–PECs) were generated by transducing the following genes into HUVECs (Fig. 1a): E4ORF1 (E4) or constitutively active Akt1 (myristoylated Akt; myrAkt) for Akt–PECs, constitutively active c-RAF (CA-Raf) for MAPK–PECs, or both E4ORF1 and CA-Raf (E4 + Raf) for Akt + MAPK–PECs. To define the role of oncogenes that are commonly used to immortalize endothelial cells, constitutively active K-RAS (K-Ras(V12)) and polyoma virus middle-T antigen (PymT), which activate both Akt and MAPK, were also introduced into PECs. All of the activated PECs had a typical morphological contact-inhibited cobblestone monolayer phenotype (Fig. 1b) and survived in serum- and growth factor-free medium beyond 10 days (Fig. 1c). In all the PECs, Akt and MAPK had the expected phosphorylation status (Fig. 1d). Furthermore, these PECs expressed endothelial cell-specific genes (Supplementary Information, Table S1) and maintained angiogenic activity (Fig. 1e). The PECs therefore approximate a prototypical vascular niche, enabling unbiased assessment of the role of PECs in HSPC expansion.
Figure 1.
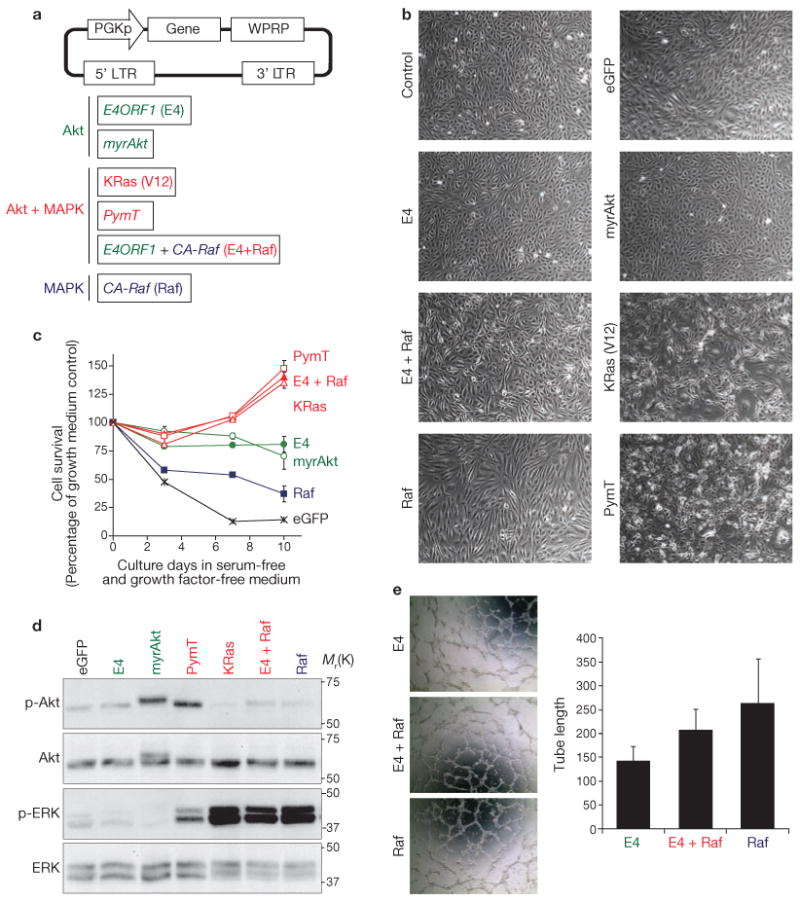
Establishment of Akt- or MAPK-activated PECs. (a) Schematic representations of the pCCL.PGK lentiviral vector (top) and genes used (bottom) for generation of Akt- and/or MAPK-activated endothelial cells. HUVECs were transduced with lentiviruses containing vectors with these genes. PECs transduced with E4ORF1 are referred as E4–PECs, PECs transduced with CA-Raf as Raf–PECs, and PECs transduced with both E4ORF1 and CA-Raf as E4 + Raf–PECs. E4–PECs and myrAkt–PECs represent Akt-activated PECs. Raf–PECs represent MAPK-activated PECs. PymT–PECs, KRas(V12)–PECs, and E4 + Raf–PECs represent PECs in which both Akt and MAPK are activated. (b) Representative phase contrast microscopy images of the indicated PECs. (c) Survival of different PECs in serum- and growth factor-free medium. Confluent cells were cultured in the serum- and growth factor-free medium for the indicated days. Data are means ± s.d. (n = 3) and are represented as a percentage of growth, compared with the eGFP-expressing control at 0 days. (d) Phosphorylation of Akt and the MAPKs, ERK1 and ERK2 (ERK), in the indicated PECs was analysed by western blotting. (e) Angiogenic activity was measured by the tube formation assay. Left: representative phase contrast microscopy images of the indicated PECs. Right: length of tubes formed by the indicated PECs. Data are means ± s.d. (n = 3). Uncropped images of blots are shown in Supplementary Information, Fig. SXX.
To define the mechanism by which Akt- or MAPK-activated PECs differentially modulate expansion of HSPCs, mouse Lin− cells were co-cultured on Akt–PECs, MAPK–PECs or Akt + MAPK–PECs for 20 days (Fig. 2a). E4–PECs and myrAkt–PECs supported a 520.9- and 236.7-fold expansion of Lin− cells, respectively. In contrast, CA-Raf–PECs (Raf–PECs) and K-Ras(V12)–PECs only induced a 6.3- and 3.5-fold expansion of Lin− cells, respectively. Co-activation of both Akt and MAPK (E4 + Raf–PECs) decreased Lin− cell expansion, compared with PECs activated with only Akt (E4–PECs). Notably, the number of phenotypically marked CD34−Flt3− KLS HSPCs (Fig. 2b) and the percentage of KLS cells per total haematopoietic cells (Fig. 2c) were higher when co-cultured with Akt–PECs, compared with those propagating on the MAPK–PECs. Thus, compared with MAPK–PECs, Akt–PECs are more effective in stimulating HSPC expansion than differentiation. Lin+ cells generated on PECs were primarily composed of Gr-1+/CD11b+ myeloid lineage cells, and smaller percentages of CD41+ megakaryocytes, CD19+ B cells and CD3+ T cells. Notably, more CD3+ T cells were proliferating on Akt–PECs than on MAPK–PECs (Fig. 2d).
Figure 2.
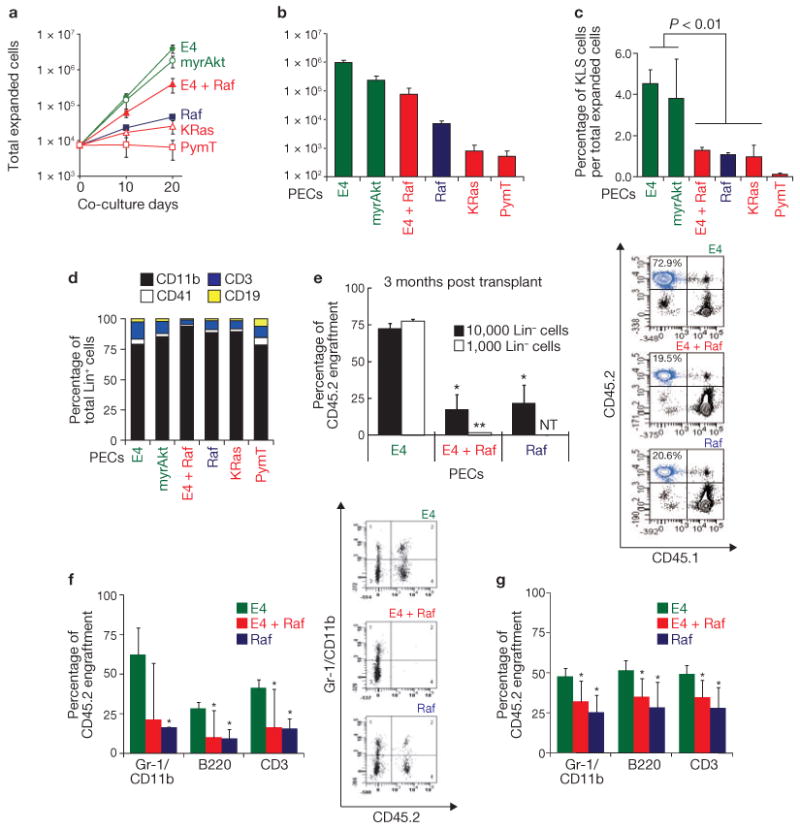
Akt-activated PECs are more efficient than MAPK-activated PECs in expanding HSPCs. (a) Lin− cells were co-cultured on the indicated PECs over 20 days, and expansion of the Lin− cells was measured. (b) Total number of CD34−Flt3− KLS HSPCs after 20 days co-culture of Lin− cells with the indicated PECs. Data are means ± s.d. (n = 3). (c) Percentage of KLS cell population over the total expanded haematopoietic cells (Lin− and Lin+) after 10 day co-culture with the indicated PECs. Data are means ± s.d. (n = 3). (d) Composition of Lin+ cells generated after co-culture on the indicated PECs. (e) Competitive repopulation assay. Left: 10,000 or 1,000 CD45.2 Lin− cells (co-cultured on E4–PECs, E4 + Raf–PECs or Raf–PECs), and 500,000 freshly prepared CD45.1 competitive whole bone marrow mononuclear cells, were transplanted into lethally irradiated mice, and percentage of engraftment by CD45.2 cells was analysed by antibody staining and FACS of peripheral blood after 3 months. Right: representative FACS dot plot of CD45.1 and CD45.2 expression in cells isolated from the blood of transplanted mice. Percentage of cells expressing CD45.2 is indicated at the top left. n.t.; not tested. Data are means ± s.d. (n = 3, asterisks indicate P < 0.05, compared with cells from mice transplanted with Lin− cells co-cultured on E4–PECs). (f) Left: 10,000 CD45.2 Lin− cells co-cultured on the indicated PECs, and 500,000 freshly prepared CD45.1 competitive whole bone marrow mononuclear cells, were transplanted into lethally irradiated mice, and percentage of long-term multi-lineage engraftment (4 months) by the haematopoietic cells expressing the indicated markers was assayed by FACS. Right: representative FACS dot plot of Gr-1/CD11b and CD45.2 expression of cells isolated from the blood of transplanted mice. Data are means ± s.d. (n = 3, asterisks indicate P < 0.05, compared with Gr-1/CD11b-expressing cells from mice transplanted with Lin− cells co-cultured on E4–PECs). (g) Whole bone marrow mononuclear cells were isolated from mice that had been long-term engrafted (as in e) and were transplanted into lethally irradiated secondary recipients. Engraftment of cells expressing the indicated markers was quantified in the secondary recipient by FACS 8 months after transplant. Data are mean ± s.d. (n = 4, P < 0.05).
To determine if Lin− cells cultured on activated endothelial cells still maintain their long-term haematopoietic stem cell activity (LT-HSC), competitive transplantation assays were performed. CD45.2 Lin− cells, co-cultured on E4–PECs, E4 + Raf–PECs, or Raf–PECs, were transplanted with 500,000 competitive whole bone marrow cells from CD45.1 mice into lethally irradiated CD45.1 mice. Although the Lin− cells were capable of long-term (> 3 months) multi-lineage engraftment in transplanted mice, those Lin− cells cultured on E4–PECs maintained significantly higher LT-HSC activity than those cultured on either E4 + Raf–PECs or Raf–PECs (Fig. 2e, f). Serial transplantation studies were also performed, whereby bone marrow cells were isolated from primary engrafted mice and were then transplanted into lethally irradiated secondary recipients. Both the primary and secondary transplanted mice demonstrated long-term, multi-lineage (LT-HSC) engraftment (Fig. 2g). Therefore, although Akt–PECs and MAPK–PECs can expand both HSPCs and mature haematopoietic cells, the potential to self-renew LT-HSCs is much higher in co-cultures with Akt–PECs than with MAPK–PECs.
Direct cellular interaction with endothelial cells maintains quiescence and expansion of HSPCs
Cell-cycle analysis indicated that KLS HSPCs expanding on E4–PECs maintained higher G0–G1 and lower G2–M populations than those co-cultured on E4 + Raf–PECs (P < 0.01) or Raf–PECs (P < 0.01; Fig. 3a). Colony formation assay used to quantify the number of the progenitors demonstrated that in a short-term culture period of 4 days, both Akt–PECs and MAPK–PECs had similar numbers of colony forming units (CFUs), whereas after 7 days Akt–PECs, but not MAPK–PECs, sustained the generation of significantly higher numbers of CFUs (Fig. 3b, c). Thus, Akt–PECs, and to a lesser degree MAPK–PECs, sustain long-tem proliferation of the progenitors by preventing exhaustion of cycling HSPCs.
Figure 3.

HSPC expansion on PECs requires direct cellular interaction. (a) Cell-cycle analysis of KLS cells, expanding on differentially activated PECs, cultured without PECs, or freshly purified from bone marrow (fresh BM). Data are means ± s.d. (n = 3). Right: representative plots of cell-cycle analysis of KLS cells co-cultured on the indicated PECs by FACS and treated with propidium iodide (PI) to stain DNA. (b) Colony formation assay of KLS HSPCs co-cultured on the indicated PECs over 4 and 7 days. (c) Quantification of CFU-GEMM and CFU-GM of KLS cells after 7 days co-culture with indicated PECs. (d, e) Effects of conditioned medium from different PECs on generation of Lin+ cells (d) and CD34−Flt3− KLS HSPCs expansion (e). Mouse Lin− cells were co-cultured with or without E4–PECs in the presence of conditioned media from E4–PECs, E4 + Raf–PECs, Raf–PECs, or control serum and growth factor-free X-vivo20 medium (vehicle) for 8 days. Data are mean ± s.d. (n = 3).
The differences between Akt- and MAPK-activated PECs in self-renewing HSPCs could be explained by their differential capacity to produce different sets of membrane-bound and soluble HSPC-active angiocrine factors. Thus, conditioned medium harvested from E4–PEC, E4+Raf–PEC and Raf–PEC cultures were used to assess the role of soluble factors in HSPC expansion. Without feeder E4–PECs, Lin+ cells expanded when cultured with the conditioned medium of E4–PECs and E4 + Raf–PECs, whereas conditioned medium of Raf–PECs and control medium failed to expand Lin+ cells (Fig. 3d). Importantly, addition of conditioned medium from E4 + Raf–PECs and Raf–PECs to the E4–PEC/HSPC co-culture suppressed expansion of HSPCs, but maintained Lin+ cell generation (Fig. 3d, e). Furthermore, none of the conditioned media expanded CD34−Flt3− KLS HSPCs (Fig. 3e). Therefore, conditioned medium from both Akt- and MAPK-activated PECs contains angiocrine factors that support Lin+ cell generation, but fail to propagate HSPCs. These data indicate that direct cellular contact to endothelial cells is essential for self-renewal of LT-HSCs and reconstitution of HSPCs.
Akt- and MAPK-activated endothelial cells modulate HSPC expansion and differentiation through upregulation of distinct angiocrine factors
To identify the angiocrine factors produced by activated PECs, we performed microarray analyses. Similarities in gene profile between Akt- and MAPK-activated PECs were determined by using a cluster analysis approach. Genes present in any one of the analysed conditions (Supplementary Information, Fig. S2) or genes differentially regulated between Akt–PECs and MAPK–PECs (Fig. 4a) were identified and used for the analysis. Global cluster analyses demonstrated that E4–PECs and myrAkt–PECs were clustered into similar branches, whereas Raf–PECs, E4 + Raf–PECs, and K-Ras(V12)–PECs were grouped in the other branches (Fig. 4a). Thus, the gene expression profile of E4–PECs is similar to myrAkt–PECs and distinct from MAPK–PECs. PymT–PECs had a different gene expression profile from Akt–PECs or MAPK–PECs, probably because of the activation of JNK and PKC pathways.
Figure 4.

Activation state of the PECs determines the expression pattern of HSPC-active genes. (a) Hierarchical clustering, using 2,404 probe-sets, of genes that had over a 2-fold difference when comparing Akt–PECs (E4–PECs and myrAkt–PECs) and MAPK–PECs (Raf–PECs, K-Ras(V12)–PECs, and E4 + Raf–PECs). Red and green in the heatmap graphs represent higher and lower expression, compared with the median for that particular gene, as indicated in the scale on the right. Colour intensity is related to the difference with the median (black). Clustering of the different PECs is indicated on the left. (b) Change in the expression profile of representative Akt- or MAPK-regulated genes. Based on microarray results, genes statistically (P < 0.05) induced or decreased by Akt (E4 and myrAkt PECs), Akt and MAPK (E4 + Raf and K-Ras PECs), and MAPK (Raf PECs) were coloured yellow or blue, as indicated. The values indicate fold-change of expression level, compared with control eGFP+ PECs. (c, d, e) Expression of representative Akt-dominant genes (FGF2, IGFBP2 and DHH; c), MAPK-dominant genes (Ang2, IGFBP3 and IL6; d), and Notch ligands (e) in the indicated PECs were quantified by quantitative PCR. Data are mean ± s.d. (n = 3). (f–i) Expansion of CD34−Flt3− KLS HSPCs on E4–PECs with knockdown of IGFBP2 (f) or FGF2 (g), and on E4 + Raf–PECs with knockdown of Jagged-1 (h) or Ang2 (i). Knockdown efficacy was confirmed by quantitative PCR (Supplementary Information, Fig. S6a). Data are means ± s.d. (n = 3, asterisk indicates P < 0.05, compared with control).
Cluster analysis for gene sets known to regulate the homeostasis of HSPCs demonstrated that Akt–PECs and MAPK–PECs were clustered into different branches (Supplementary Information, Figs S3 and S4). Hence, differential expression of a defined set of angiocrine factors by Akt- and MAPK-activated PECs is the major determinant of the differences in HSPC self-renewal and differentiation kinetics observed during co-culture with PECs. Although Akt-activation in PECs did not induce the expression of several known HSPC-active cytokines, including IL3, thrombopoietin21, WNT5a22, FGF1 (ref. 16) and angiopoietin-like-5 (ref. 23; Supplementary Information, Fig. S3), there was a marked upregulation of a specific set of HSPC-active angiocrine factors, including FGF2, IGFBP2, angiopoietin-1 (Ang1), BMP4 and DHH in Akt-activated PECs. Importantly, the expression of HSPC inhibitory factors, including angiopoietin-2 (Ang2) and DKK1 was suppressed in Akt-activated PECs. In contrast, MAPK-activation induced the expression of progenitor-active genes, including Ang2 and IL6, while suppressing the expression of FGF2, BMP4 and DKK1 (Fig. 4b, c, d). Thus, Akt activation upregulates the expression of HSPC-active angiocrine factors, whereas MAPK activation stimulates the expression of factors that promote differentiation of the HSPCs.
Notch ligands were expressed in both Akt- and MAPK-activated PECs, with DLL1 primarily expressed in the Akt-activated PECs, whereas DLL4 and Jagged-1 were upregulated in the MAPK-activated PECs (Fig. 4e). Jagged-2 was constitutively expressed in both Akt- and MAPK-activated PECs. The finding that various Notch ligands are expressed by both Akt- and MAPK-activated PECs suggests that PECs are inherently programmed to prevent HSPC exhaustion12. To determine whether these patterns of angiocrine-factor expression by PEC activation is only a feature of HUVECs, HSPC proliferation was analysed in PECs derived from human bone marrow (HBMEC), aorta (HAEC) and skin (HMVEC). Akt- or MAPK-activation in these cells resulted in patterns of gene expression similar to HUVECs (Supplementary Information, Fig. S5a, b). HAEC and HMVEC transduced with E4ORF1 supported both HSPC and Lin+ cell expansion to the same extent as HUVECs (Supplementary Information, Fig. S5c, d). Therefore, through activation of Akt or MAPK, organ-specific PECs can be regulated to express common set of genes that support HSPC homeostasis.
To determine the contribution of Akt- or MAPK-regulated angiocrine factors to expansion and differentiation of HSPCs, shRNA was used to downregulate these genes (Supplementary Information, Fig. 6a). Knockdown of IGFBP2 or FGF2 impaired the capacity of E4–PECs to expand CD34−Flt3− KLS HSPCs (Fig. 4f, g). In E4 + Raf–PECs, downregulation of Jagged-1, but not Ang2, reduced HSPC expansion (Fig. 4h, i). Hence, constitutive activation of Akt and MAPK in the PECs differentially turns on a unique repertoire of HSPC-active angiocrine factors that balance the maintenance and reconstitution of HSPCs.
Figure 6.
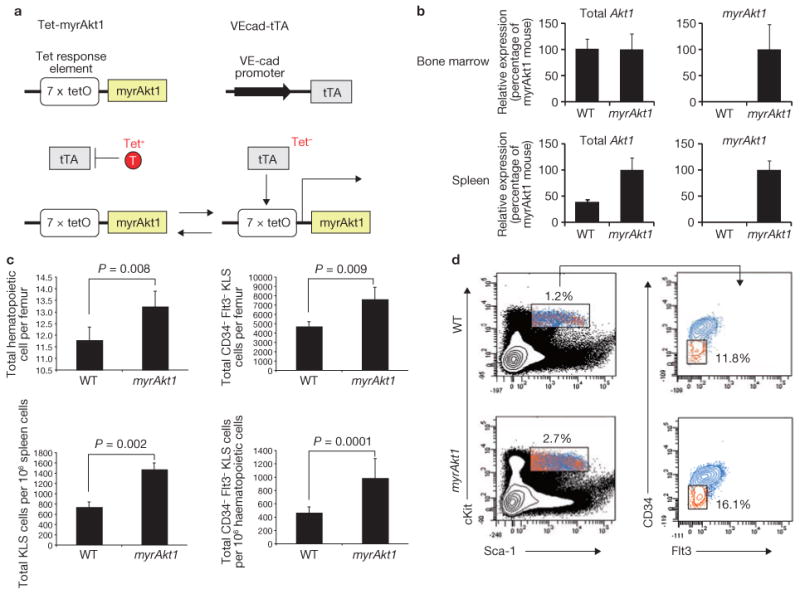
Endothelial-specific expression of constitutively active Akt1 (myrAkt) in the adult mice augments HSPC generation and accelerates haematopoiesis. (a) Schematic representation of the tetracycline-off expression system used in adult mice to control expression of constitutively active Akt1 in an endothelial-cell-specific manner. Top: myrAkt1 transcription is controlled by a tetracycline-responsive element promoter complex (left). An endothelial-cell-specific VE-cadherin promoter drives the expression of the tetracycline-transactivator (right). Bottom: addition (left) or removal (right) of tetracycline can be used to control expression of myrAkt1. (b) Total endogenous Akt1 (left) and specifically myrAkt1 transgene (right) expression were quantified and compared by quantitative PCR in the whole bone marrow (top) or spleen (bottom) of wild-type mice or VEcad-tTA/Tet-myrAkt1 mice after withdrawal of tetracycline from. For Akt1 detection primer sets recognize endogenous Akt1 and myrAkt1, whereas for myrAkt1 detection, primer sets that only recognize the myrAkt1 transgene were used. Data are means ± s.d. (n = 4). (c) Bone marrow cells from whole femurs and spleens of wild-type and VEcad-tTA/Tet-myrAkt1 mice were analysed at steady state for absolute numbers of haematopoietic cells (top left) and CD34−Flt3− KLS HSPCs (top right). The ratio of KLS cells per 106 spleen cells (bottom left) and CD34−Flt3− KLS HSPCs per 106 bone marrow cells (bottom right) was also analysed. Data are means ± s.d. (n = 5). (d) Representative FACS dot plots used for quantification of cells from wild-type mice (top) and VEcad-tTA/Tet-myrAkt1 mice (bottom) in c. Left: identification of haematopoietic cells. Percentage of haematopoietic cells is indicated. Right: haematopoietic cells were analysed further by FACS to identify CD34−Flt3− cells. Percentage of CD34−Flt3− cells is indicated.
In Akt-activated endothelial cells mTOR stimulates the expression of HSPC-active angiocrine factors
To identify signalling pathways downstream of Akt that drive HSPC self-renewal, we focused on mTOR and FoxO pathways24–25. Gene expression profiles of E4–PECs treated with rapamycin, a mTOR inhibitor, or E4–PECs transduced with constitutive active FoxO1 (FoxO1-TM), which is resistant to inactivation by Akt, were analysed by microarray profiling (Fig. 5a). Treatment with rapamycin altered the expression profile of genes modulated by Akt-activation, including DLL1, IGFBP2 and DKK1 (Fig. 5b). FoxO1-TM overexpression restored expression of Ang2, but the number of altered genes was insignificant (Fig. 5a, b). shRNA downregulation of mTOR in E4–PECs (Fig. 5c) increased expression of DKK1 and decreased IGFBP2 (Fig. 5d), a pattern that was also observed with rapamycin treatment (data not shown). Propagation of CD34−Flt3− KLS HSPCs was decreased by mTOR knockdown, but not affected by FoxO1-TM overexpression, in E4–PECs (Fig. 5e). Competitive transplantation assays indicated that Lin− cells co-cultured on E4–PECs with mTOR knockdown expanded, but maintained less stem cell activity than those cells that were co-cultured on control E4–PECs, or on E4–PECs overexpressing FoxO1-TM (Fig. 5f). mTOR-knockdown or FoxO1-TM overexpression did not affect PECs survival (Supplementary Information, Fig. S6b, c). These data suggest that the Akt–mTOR pathway in PECs stimulates HSPC regeneration through induction of HSPC-active angiocrine factors.
Figure 5.
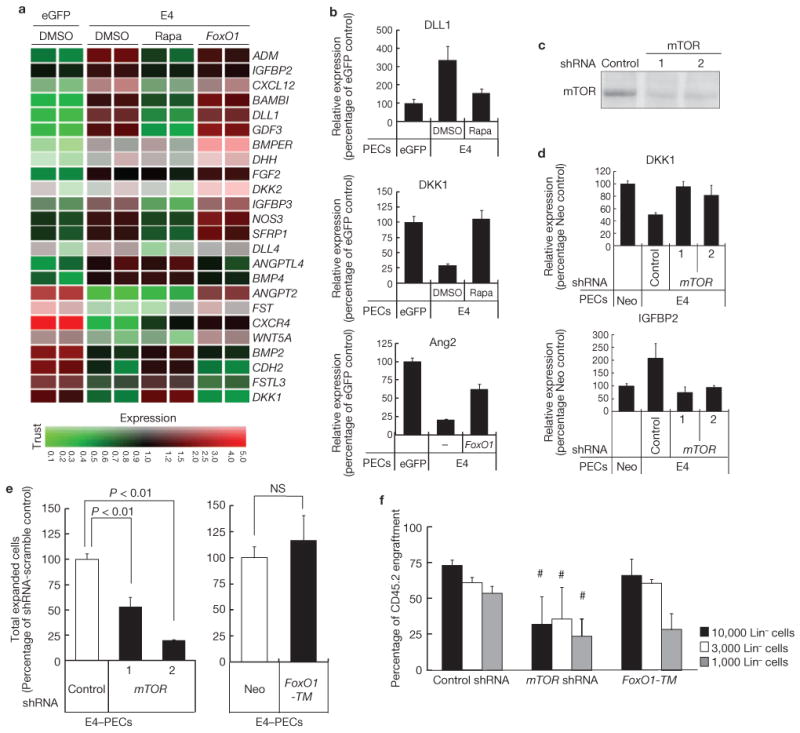
Activation of Akt-mTOR pathway in endothelial cells promotes expansion of HSPCs. (a) Effect of mTOR inhibition or FoxO1 constitutive activation in Akt–PECs on expression profile of a specific set of genes that are known to regulate HSPC fate. E4–PECs were treated with DMSO (control), 20 nM rapamycin (rapa) or transduced with a constitutively active mutant of FoxO1 (FoxO1-TM). Total RNA was used for Affymetrix microarray gene-chip analysis. Specific genes, which were regulated by Akt activation were listed and presented in the heatmap. Red and green in the heatmap graphs represent higher and lower expression, compared with the median calculated from the intensity values for that particular gene from all the treatments, as indicated in the scale at the bottom. Colour intensity is related to the difference with the median (black). (b) Microarray results of E4–PECs treated with rapamycin or overexpressing FoxO1-TM were confirmed by quantitative PCR. Result of representative mTOR-dependent (DLL1 and DKK1) and FoxO1-dependent (Ang2) genes are shown. Data are means ± s.d. (n = 3). (c) mTOR knockdown by transfection with two different shRNA was confirmed by western blotting. (d) Gene expression change of mTOR-regulated genes DKK1 (top) and IGFBP2 (bottom) in mTOR knockdown E4–PECs. Data are means ± s.d. (n = 3). (e) Expansion of CD34−Flt3− KLS HSPCs when co-cultured on mTOR-knockdown (left) or FoxO1-TM-overexpressing (right) E4–PECs. Data are means ± s.d. (n = 3). (f) Competitive repopulation assay. CD45.2 Lin− cells (10,000, 3,000 or 1,000), cultured on E4–PECs transduced with control scrambled-sequence shRNA, mTOR shRNA or transduced with FoxO1-TM, were transplanted with 200,000 freshly prepared CD45.1 competitive whole bone marrow mononuclear cells into lethally irradiated mice and peripheral blood was analysed after 3 months. Asterisk indicates P < 0.05, compared with E4–PECs transduced with control scrambled-sequence shRNA. Data are means ± s.d. (n = 3). Uncropped images of blots are shown in Supplementary Information, Fig. SXX.
Endothelial-cell-specific Akt-activation in adult mice enhances HSPC expansion
To address the importance of Akt-activation in endothelial cells in vivo, we employed a mouse model in which constitutively active Akt1 (myrAkt1) could conditionally be expressed in adult mice in an endothelial cell-specific manner26 (Fig. 6a). In this tetracycline-off system, an endothelial cell-specific VE-cadherin promoter drives the expression of the tetracycline-transactivator (tTA), while myrAkt1 transcription is controlled by the tetracycline responsive element promoter complex (VEcad-tTA/Tet-myrAkt1). Withdrawal of tetracycline results in endothelial cell-specific expression of myrAkt1 and allows the role of Akt-activated endothelial cells in haematopoiesis to be determined. In adult VEcad-tTA/Tet-myrAkt1 mice (myrAkt1 mice), removal of tetracycline resulted in sustained expression of myrAkt1 in bone marrow and spleen (Fig. 6b). As predicted from our in vitro studies, Akt1 activation in endothelial cells increased the number of total haematopoietic cells (Fig. 6c; top left, d) and CD34−Flt3− KLS HSPCs per femur (Fig. 6c; top right, d) and spleen (Fig. 6c; bottom left). Notably, the percentage of CD34−Flt3− KLS HSPCs per 106 haematopoietic cells in femur was also increased (Fig. 6c; bottom right).
To determine if the increase in HSPC population isolated from the myrAkt1 mice could facilitate haematopoietic recovery, lethally irradiated wild-type mice were transplanted with 5 × 10⁵ whole bone marrow cells harvested from either myrAkt1 mice or wild-type mice. Ten days post transplant, peripheral blood of the transplanted mice was analysed and spleen colony forming units (CFU-S) were quantified. Notably, mice transplanted with bone marrow cells from the myrAkt1 mice displayed rapid haematopoietic recovery, as reflected by the enhanced reconstitution of high levels of platelets, and red and white blood cells (Fig. 7a), and an increase in the number of CFU-S (Fig. 7b). To investigate the potential of endothelial cell Akt activation to expand true LT-HSC cells, competitive transplantation assays were performed. Lethally irradiated wild-type FVP mice were transplanted with 5 × 10⁵ bone marrow cells harvested from either myrAkt1 or wild-type mice along with competitive bone marrow cells from a wild-type FVB mouse expressing green fluorescent protein (GFP). The cells from myrAkt1 mice had a competitive advantage in long-term (> 3 months), multi-lineage engraftment, compared with cells from wild-type mice (Fig. 7c–f).
Figure 7.

Akt-activated endothelial cells support expansion of short- and long-term repopulating HSCs in adult mice. (a) Lethally irradiated wild-type FVB mice were transplanted with 500,000 whole bone marrow mononuclear cells, from wild-type mice (WT) or VEcad-tTA/Tet-myrAkt1 mice overexpressing myrAkt1. Ten days after transplant, peripheral blood was analysed for recovery of the level of white blood cells (left), red blood cells (middle) and platelets. Data are means ± s.d. (n = 5). (b) The spleens of mice overexpressing myrAkt1 were analysed for spleen colony forming units (CFU-S). Data are means ± s.d. (n = 5). (c) Competitive transplantation assays. FVB mice were lethally irradiated. These mice then received a transplant of whole bone marrow cells, harvested from wild-type mice or VEcad-tTA/Tet-myrAkt1 mice overexpressing myrAkt1, along with competitive whole bone marrow cells from a FVB mouse expressing GFP. After three months, CD45+GFP− cells were quantified from the total engrafted cells in peripheral blood. (d) Representative FACS dot plots used to quantify cells in c. The percentage of cells that are CD45+ and GFP− is indicated in the top left. (e) Identification and quantification of the indicated engrafted cells in peripheral blood samples from lethally irradiated mice transplanted with whole bone marrow cells from mice overexpressing myrAkt1, three months after transplant. (f) Representative FACS dot plots used to quantify cells in e. (g) Proposed model for HSPC homeostasis by the vascular niche demonstrating that the activation status of the endothelial cells balances the expansion and differentiation of HSPCs. Akt-activated PECs (middle) mainly promote HSPC maintenance and regeneration through production of prototypical HSPC-active angiocrine growth factors, including IGFBP2, FGF2, DHH and BMP4, and downregulation of HSPC inhibitory factors, such as DKK1 and Ang2. Conversely, downregulation of IGFBP2 and FGF2 (right), as well as upregulation of maturation factors, such as IL6 in MAPK-activated PECs, favours differentiation of HSPCs. However, in both Akt- and MAPK-activated PECs (left), expression of various Notch ligands support long-term maintenance of the HSPC12, preventing excessive exhaustion of the HSPCs. The extent of Akt- and MAPK-activation through stimulation by angiogenic growth factors might determine the homeostasis of HSPCs.
To quantify the LT-HSC frequency, limiting dilution competitive repopulating unit (CRU) assay was perfumed by competitively transplanting incremental doses of 1 × 10⁴−5 × 10⁵ bone marrow cells from wild-type- or myrAkt1-mice into lethally irradiated mice. In the mice transplanted with bone marrow cells derived from the myrAkt1 mice, there was a 10-fold increase in the frequency of LT-HSCs, compared with the control group, as quantified by Poisson's statistics (Table 1). These data corroborate the in vitro data and clearly indicate that selective activation of Akt in the endothelial cells in vivo leads to the expansion of HSPCs and authentic repopulating LT-HSCs thereby accelerating haematopoietic reconstitution.
Table 1. CRU (competitive repopulating unit) frequency determined by limiting-dilution analysis.
| Number of whole bone marrow cells transplanted per mouse | Number of mice engrafted with > 1.0% | Y-chromosome haematopoietic cells per total number of mice |
|---|---|---|
| Donor | Wild-type mice | myrAkt1 mice |
| 1 × 10⁴ | 1/6 | 8/10 |
| 2 × 10⁴ | 2/7 | 9/10 |
| 1 × 10⁵ | 4/10 | 8/9 |
| 2 × 10⁵ | 7/10 | 9/9 |
| 5 × 10⁵ | 10/10 | 9/9 |
| Frequency of CRUs | 1 in 139,089 | 1 in 14,377 |
| Number of CRUs per 1 × 10⁶ whole bone marrow cells | 7 | 69 |
Frequency of long-term HSCs was calculated using L-calc software according to Poisson statistics. Whole bone marrow mononuclear cells from mice overexpressing myrAkt1 showed a 10-fold increase of haematopoietic cells capable of long-term engraftment (> 3 months), compared with wild-type whole bone marrow cells.
Discussion
Defining the mechanism by which bone marrow microenvironment reconstitutes HSPCs has been hampered by the paucity of models to selectively modulate the function of each niche cell, such as bone marrow SECs. Here, we show that the activation state of the endothelial cells through differential recruitment of Akt and MAPK signalling pathways balances the self-renewal of LT-HSCs and differentiation of the HSPCs into myeloid, megakaryocytic and lymphoid lineages (Fig. 7g). Akt activation in the endothelial cells of adult mice or in PEC co-cultures promotes self-renewal of LT-HSCs and expansion of HSPCs by inducing the expression of both membrane-bound and soluble angiocrine factors. The expression of secreted HSPC-stimulatory angiocrine factors, including FGF2 (ref. 16), IGFBP2 (ref. 27–28), DLL1 (ref. 29), DHH30 and BMP4 (ref. 31), were collectively upregulated by Akt-activation, whereas HSPC-inhibitory factors, such as DKK1 (ref. 32), were downregulated. Knockdown of IGFBP2 and FGF2 in PECs resulted in impaired HSPC expansion, suggesting that these factors contribute to the regeneration of HSPCs. Furthermore, expression of membrane-bound Notch ligands on PECs maintains HSPCs, mainly by preventing the exhaustion of LT-HSCs. Expression of Notch ligands by both Akt and MAPK-activated PECs suggests that vascular cells prevent exhaustion of HSPCs. Nevertheless, in MAPK-activated PECs, downregulation of HSPC-active factors shifts the balance towards differentiation into mature haematopoietic cells. Our data suggest that control of the balance between stem cell self-renewal and differentiation is dictated by the activation state of a vascular-niche cell, but not exclusively through LT-HSC-autonomous stochastic cell-fate determination.
The ability of HSPCs to self-renew and differentiate is pivotal for homeostasis of haematopoiesis. The HSPCs would be depleted if cell differentiation overwhelms self-renewal, and excessive self-renewal without differentiation could result in myeloproliferative syndromes. Thus, the bone marrow niche has to coordinate self-renewal and differentiation particularly after myeloablation. Indeed, interaction of haematopoietic progenitors with the SECs is required for thrombopoiesis9. Furthermore, after myelosuppression, regeneration of SECs in bone marrow is essential for haematopoietic recovery6,33–34. Therefore, both at steady-state and during haematopoietic recovery, SECs have a critical role in maintaining and reconstituting haematopoiesis. Indeed, during haematopoietic regeneration, Akt and MAPK are co-activated in proliferative SECs by pro-angiogenic factors, including VEGF-A and FGF2 (refs 35–36). In this study, MAPK–PECs and Akt + MAPK–PECs supported LT-HSC activity much less than PECs that were activated only with Akt, suggesting that co-activation of Akt and MAPK in regenerating PECs serves two functions; preventing the exhaustion of the HSPCs, while also accelerating lineage-specific differentiation. MAPK-activated PECs maintain the size of HSPC population, but favour differentiation of HSPCs to fully reconstitute haematopoiesis. It is plausible that the balance between pro-angiogenic and anti-angiogenic factors by controlling the relative degree of Akt and MAPK activation in bone marrow SECs establishes the equilibrium between self-renewal and differentiation of HSPCs.
We validated the results obtained from the Akt–PEC/HSPC co-culture in an in vivo model by the conditional endothelial-cell-specific expression of myrAkt1. Akt-activation in adult mouse endothelial cells augments haematopoiesis and increases the number of CD34−Flt3− KLS HSPCs in both the spleen and bone marrow. Transplantation of the bone marrow cells from endothelial cell-specific Akt1-activated mice into lethally irradiated WT mice enhanced generation of splenic CFU-S and true LT-HSCs, and accelerated haematopoietic recovery. These in vivo data phenocopy the results obtained with Akt-activated PECs in vitro and highlight the significance of endothelial cell-specific Akt-activation in endothelial cells in reconstitution of LT-HSCs and HSPCs. The myrAkt1 mouse model will provide a means to identify as yet unrecognized factors produced by the PECs that dictate long-term expansion of the HSPCs.
It is speculated that vascular niche within each organ is programmed to meet the physiological requirements of a specific tissue, suggesting that expression of angiocrine factors might be regulated in an organ-specific manner. For example, the SECs derived from bone marrow12 and liver11 upregulate distinct sets of angiocrine factors that promote either haematopoiesis or liver regeneration. Notwithstanding these observations, here we show that Akt-activated PECs derived from various organ-specific vasculature, including vein, aorta and skin, could self-renew co-cultured HSPCs. Thus, in the context of LT-HSC regeneration, the activation status of the endothelial cells constitutes a major determinant of the endothelial cell-heterogeneity.
Before identification of the E4ORF1 to generate the serum- and growth factor-free endothelial cell co-cultures, most studies were performed with endothelial cells transformed with the oncogenes, Sv40 large-T or polyoma middle-T antigen. We show here that transformation of endothelial cells with these oncogenes disables endothelial cells to expand HSPCs and LT-HSCs because of constitutive MAPK activation. This explains why immortalized endothelial cells failed to expand LT-HSCs. Therefore, the E4ORF1 and Akt-activated endothelial cells provide for ideal serum- and growth factor-free co-cultures to identify angiocrine factors that regulate HSPC physiology.
In this report, we introduce the innovative concept that endothelial cells are not just passive conduits to deliver oxygen or nutrients, but could directly reconstitute HSPC by production of a specific set of HSPC-active angiocrine factors. At steady state, low levels of Akt activation maintain the production of angiocrine factors that sustain HSPC homeostasis. During haematopoietic recovery, activation of both Akt and MAPK through expression of angiocrine factors favours not only differentiation of the HSPCs but also replenishes the HSPCs to prevent the exhaustion of the LT-HSC pool. Ultimately, homeostasis of LT-HSCs and HSPCs is finely adjusted according to the stoichiometry of Akt and MAPK activation. As such, our data lay the foundation for designing strategies whereby selective activation of Akt in endothelial cells might augment haematopoiesis in hypoproliferative disorders, whereas inhibition of this pathway might diminish the severity of the myeloproliferative and pre-leukemic syndromes.
Methods
Cell Culture
Human umbilical cord vein endothelial cells (HUVECs) and human bone marrow-derived endothelial cells (HBMECs) were isolated as previously described37. Human aortic endothelial cells (HAECs) and human microvascular endothelial cells (HMVECs) were obtained from Invitrogen. Cells were cultured in endothelial cell growth medium (Medium 199, 20% (v/v) fetal bovine serum (FBS), 20 μg ml−1 endothelial cell growth supplement (Hallway), 1% (w/v) antibiotics (Hallway), and 20 units ml−1 heparin).
Virus plasmids and virus generation
To construct constitutively active RAF (CA-Raf), the human RAF open reading frame was amplified using HUVEC cDNA and cloned into pCCL.PGK.CAAX vector, which added the K-RAS carboxy-terminal localization signal to the C terminus of RAF. The E4ORF1 gene of adenovirus (serotype 5), mouse constitutively active Akt1 (myristoylated Akt: myrAkt, a gift from L. E. Benjamin26, human constitutive active K-RAS (K-Ras(V12)), and polyoma middle-T antigen (PymT, a gift from W. Sessa, Yale University School of Medicine, USA) were amplified by PCR and cloned into pCCL.PGK lentivirus vector17. eGFP and neomycin-resistance(Neo) genes were also cloned into pCCL.PGK vector and used as a control for lentiviral infection of gene expression and HSPC expansion assay, respectively. Akt-resistant FoxO1 (FoxO1-TM) cDNA was obtained from Addgene (Addgene plasmid 13508; ref. 38) and cloned into pCCL.PGK vector by PCR. Lentiviral plasmids expressing shRNA against mTOR were obtained from Addgene (Addgene plasmid 1855 (#1) and 1856 (#2); ref. 39) and those against Jagged-1, Ang2, IGFBP2 and FGF2, and scrambled-sequence control shRNA (pLKO-scramble) were purchased from Open biosystems. Lentiviruses were generated as described previously17 and cells were transduced with lentivirus at multiplicity of infection (MOI) of 10, and maintained in endothelial cell growth medium. For shRNA experiments, cells were cultured in the presence of 500 ng ml−1 puromycin during a selection period of 4 days.
Tube formation assay
PECs were starved in M199 for 6 h and then 100,000 cells were cultured on 250 μl of Matrigel (BD bioscience) in assay medium (Medium 199, 2% (v/v) fetal calf serum (FCS), 20 ng ml−1 VEGF-A, 10 ng ml−1 FGF2 and heparin) for 16 h in 24-well plate. The degree of tube formation was quantified by measuring the length of tubes in three randomly chosen fields from each well using the angiogenic activity quantification programme (Kurabo).
Flow Cytometry
Monoclonal Antibodies (mAbs) recognizing the following markers were used for flow cytometric analyses: c-Kit (2B8; APC-conjugated), Sca-1 (D7; PE–Cy-7-conjugated), CD34 (RAM34; FITC (fluorescein isothiocyanate)-conjugated), Flt-3 (A2F10.1; PE-conjugated), CD45.1(A20; PE-conjugated), CD45.2(104; FITC-conjugated), TER-119 (TER-119; APC-conjugated), Gr-1 (PE-conjugated), CD11b (PE-conjugated), CD41 (PE-conjugated), CD3 (PE-conjugated) and CD19 (PE-conjugated). All mAbs were purchased from BD Biosciences. For multi-lineage engrafted analysis non-labelled Gr-1, CD11b, B220 and CD3 antibodies were labelled with Pacific Blue and used together with CD45.1 (PE-conjugated), CD45.2 (FITC-conjugated), and TER-119 (APC-conjugated). Haematopoietic cells were analysed using a LSRII flow cytometer (BD Biosciences).
Haematopoietic cell isolation and co-culture on PECs
After culture for 10 days, whole bone marrow cells from C57BL/6J mice were isolated and Lin− cells were enriched by mouse Lineage Cell Depletion Kit (Miltenyi Biotec). Primary endothelial cells were cultured on gelatin-coated 6-well plates, and 7,500 of the isolated Lin− cells were plated onto PECs in 2 ml of X-vivo 20 media (Lonza) supplemented with 25 ng ml−1 of mouse Kit Ligand (Pepro Tech). Freshly prepared 500 μl of serum- and growth factor-free X-vivo 20 media with Kit-Ligand was added every other day. At the end of co-culture period, floating cells and attached cells were collected and endothelial cells were removed by human CD31 Microbead Kit (Miltenyi Biotec). Lin− cells and Lin+ cells were separated using mouse Lineage Cell Depletion Kit. Total cell number was determined using an Advia 120 (Bayer) automated haematological analyser or haemocytometer (BD Biosciences). Colony assays were performed by placing 1,000 cultured haematopoietic cells into methylcellulose-based media with cytokines (Methocult GF M3434; Stem Cell Technologies) and analysed at day 7 for total colony number. Cell cycle analysis was performed by staining the Lin− cells with 7-aminoactinomycin D (BD Biosciences), c-Kit (APC-conjugated) and Sca-1 (PE-Cy-7-conjugated), and measured by FACS. Data were analysed with ModFit LT software (Verity Software House).
Endothelial cell selective expression of myrAkt1 in vivo
The double transgenic mouse model that expresses myrAkt1 in endothelial cells under tetracycline control has been previously described26. Briefly, the D4 line (VEcad–tTA) and K8 line (Tet–myrAkt1) were used in these experiments. To suppress myrAkt1 expression in embryos, neonates and adults, 1.5 mg ml−1 tetracycline with 5% (w/v) sucrose was given in the drinking water. To induce myrAkt1 expression, tetracycline was removed from the water and then analyses were done 3 weeks after tetracycline removal.
Spleen colony forming units (CFU-S) assay
Lethally irradiated (9 Gy) FVB mice were reconstituted with 500,000 whole bone marrow cells from wild type (n = 7) or myrAkt1 transgenic mice (n = 8). Ten days post-transplant, peripheral blood was analysed by retro-orbital blood collection and differential blood counts were obtained using an automated Advia 120 (Bayer). Mice were then killed and spleens were removed and put in Bouin's Fixative (Sigma Aldrich) over night at 4 °C. Spleens were thoroughly washed with 1 × PBS and splenic colonies were counted using a Zeiss dissecting microscope (Carl Zeiss).
Competitive reconstitution assay
In figures 2 and 5, lethally irradiated (9.5 Gy) C57BL/6-CD45.1 congenic mice were reconstituted with 10,000, 3,000 or 1,000 Lin− cells (marked CD45.2) expanded on different PECs, in competition with 500,000 (Fig. 2) or 200,000 (Fig. 5) whole bone marrow cells from C57BL/6-CD45.1 mice. Reconstitution of donor-derived cells (CD45.2) was monitored by staining peripheral blood cells with mAbs against CD45.2 (FITC-conjugated), CD45.1 (PE-conjugated), TER-119 (APC-conjugated) and haematopoietic lineage positive markers (Gr-1, CD11b, B220, and CD3; conjugated with Pacific blue). TER-119 negative cells were gated and analysed.
In figure 7c–f, lethally irradiated (9 Gy) FVB mice were reconstituted with 5 × 10⁵ whole bone marrow cells harvested from wild-type or myrAkt1 mice in competition with 3 × 10⁵ whole bone marrow cells from FVB-GFP mice. Reconstitution of donor-derived cells (CD45+GFP−) was monitored by staining peripheral blood cells with mAbs against CD45, TER-119, and haematopoietic lineage positive markers (Gr-1, CD11b, B220, and CD4). TER-119− and CD45+ cells were gated and analysed. For the limiting dilution CRU assay (Table 1), lethally irradiated (9 Gy) FVB female mice were reconstituted with the indicated number of whole bone marrow cells harvested from wild-type or myrAkt1 mice. Donor-derived cells (from male) were determined by detecting Y-chromosome-specific gene expression (frequency SRY) in peripheral blood cells with quantitative PCR.
PECs survival assay
The MTT (3-(4,5-Dimethylthiazol-2-yl)-2,5-diphenyltetrazolium bromide)-based AlamarBlue reagent (Invitrogen) was used to assess cell survival. PECs were plated at a density of 1.5 × 10⁴ cells per well on gelatin-coated 96-well plates and incubated in growth medium until the cells reached confluency. Cells were washed and cultured with growth medium as a control or with serum- and growth factor-free X-vivo 20 medium for the indicated days. Medium was changed to Medium 199 containing AlamarBlue reagent and the fluorescence (Ex530/Em590) was measured after incubation for 3 h.
Reverse transcriptase PCR (RT–PCR)
Virus-transduced PECs were grown for 16 h in serum- and growth factor-free X-vivo 20 medium, and total RNA was extracted using RNeasy Mini Kit (Invitrogen). cDNA was produced with SuperScript™ III First-Strand Synthesis Kit (Invitrogen) by using random-sequence hexamer primers. Real-time PCR was performed with Power SYBR Green PCR Master Mix (Applied Biosystems) in 7500 Fast Real-Time PCR System (Applied Biosystems). Amplification of 36B4 (for in vitro experiment) and 18S rRNA (for in vivo experiment in fig. 6) was used for sample normalization. Primer sequences are as follow: 36B4, 5′- CGACCTGGAAGTCCAACTAC -3′, 5′- ATCTGCTGCATCTGCTTG -3′; Ang1, 5′- AGAGCTACCACCAACAACAGTGTC -3′, 5′- GCTTGATATACATCTGCACAGTCTC -3′; Ang2, 5′- AGGCTGCAAGTGCTGGAGAAC -3′, 5′- CCGTCTGGTTCTGTACTGCATTCTG -3′; BMP4, 5′- AGGAAGAGCAGATCCACAGCAC -3′, 5′- GCAGAGTTTTCACTGGTCCCTGG -3′; DKK1, 5′- ATGCGTCACGCTATGTGCTG -3′, 5′- AGAACCTTCTTGTCCTTTGGTGTG -3′; DLL1, 5′- TTGCTGTGTCAGGTCTGGAG -3′, 5′- TTCTGTTGCGAGGTCATCAG -3′; DLL4, 5′- CCTCTCCAACTGCCCTTCAATTTC -3′, 5′- ATGAGTGCATCTGGTGGCAAGG -3′, FGF2, 5′- AGCAGAAGAGAGAGGAGTTGTGTC -3′, 5′- ACCAACTGGTGTATTTCCTTGACCG -3′; IGFBP2, 5′- CGAGGGCACTTGTGAGAAGC -3′, 5′- ATGTTCATGGTGCTGTCCACG -3′; IGFBP3, 5′- CTCTGCGTCAACGCTAGTGC -3′, 5′- GTGGAACTTGGGATCAGACACC -3′, Jagged-1, 5′- TGACCAGAATGGCAACAAAA -3′, 5′- GTTGGGTCCTGAATACCCCT -3′; Murine Akt1; 5′- GGCTGCTCAAGAAGGACCC -3′, 5′- CCACACACTCCATGCTGTCAT -3′; transgene myrAkt1, 5′- GCCATGGGGAGCAGCAAGAGCAAG -3′, 5′- CCTCAGGCGTTTCCACATGGAAG -3′; Murine SRY, 5′- GGGGAGTGTTGGCATAGGTA -3′, 5′- AGCTGACATCACTGGTGAGC -3′; Murine 18S rRNA; 5′- AAGTCCCTGCCCTTTGTACACA -3′, 5′- GCCTCACTAAACCATCCAATCG -3′.
Microarray gene expression profile
The Affymetrix Human Genome U133 Plus 2.0 array was used to analyze gene expression. In brief, confluent virus-transduced PECs were grown for 16 h in serum- and growth factor-free X-vivo 20 medium and total RNA was extracted using RNeasy Mini Kit (Invitrogen). The probe arrays were scanned with the Genechip System confocal scanner, data was processed with Affymetrix Microarray Suite 4.0 (Affymetrix) and analysis was performed with Genespring GX (Agilent). The microarray data is deposited at http://www.ncbi.nlm.nih.gov/geo repository (record number: GSE24093).
Preparation of conditioned medium
Confluent PECs were cultured in X-vivo 20 medium for 3 days and conditioned media were collected. The conditioned media were condensed 8-fold with Amicon Ultra-15 (MILLIPORE). In co-culture experiments, one-fourth volume of each conditioned medium per total culture medium was added.
Western blotting
Cells were cultured in X-vivo20 medium for 16 h, lysed with RIPA (radio-immunoprecipitation assay) buffer (1 × TBS (tris-buffered saline), 1% (v/v) Nonidet P-40, 0.5% (v/v) sodium deoxycholate, 0.1% (v/v) SDS (sodium dodecyl sulfate), 1 mM sodium orthovanadate, 10 mM NaF and protease inhibitor cocktail), and equal amounts of proteins were subjected to SDS–PAGE (SDS–polyacrylamide gel electrophoresis) with 4–12% (v/v) Bis-Tris gel (Invitrogen). Proteins were transferred onto nitrocellulose membrane and subjected to standard immunoblotting with antibodies against phosphorylated Akt (S473), Akt, phosphorylated p42/44 ERK, ERK or mTOR (Cell Signalling).
Statistics
All results are presented as the mean and s.d. of independent experiments. Statistical analyses were performed using Student's t-test.
Supplementary Material
Acknowledgments
S.R. is supported by Howard Hughes Medical Institute; Ansary Stem Cell Institute; National Institute of Health grants HL097797, U01 HL66592-03, RC1 AI080309; Qatar National Priorities Research Program; Anbinder and Newmans Own Foundations; Empire State Stem Cell Board and the New York State Department of Health grant NYS C024180. We thank G. Lam for HUVEC culture.
Footnotes
Author Contributions. S.R. designed the project. H.K., J.M.B. and S.R. designed experiments and wrote the paper. H.K. and J.B. performed most of the data collection and data analysis. M.K. and B.B. performed a significant amount of the experimental work. R.D. and L.B. generated and provided myrAkt1 mouse. B.D., D.N., V.C. and K.S. analysed microarray data and provided advice. The work was carried out in the laboratory of S.R.
Competing Financial Interests: The authors declare no competing financial interests.
Reprints and permissions information is available online at http://npg.nature.com/reprintsandpermissions/
References
- 1.Zhang J, et al. Identification of the haematopoietic stem cell niche and control of the niche size. Nature. 2003;425:836–841. doi: 10.1038/nature02041. [DOI] [PubMed] [Google Scholar]
- 2.Calvi LM, et al. Osteoblastic cells regulate the haematopoietic stem cell niche. Nature. 2003;425:841–846. doi: 10.1038/nature02040. [DOI] [PubMed] [Google Scholar]
- 3.Kollet O, et al. Osteoclasts degrade endosteal components and promote mobilization of hematopoietic progenitor cells. Nat Med. 2006;12:657–664. doi: 10.1038/nm1417. [DOI] [PubMed] [Google Scholar]
- 4.Scadden DT. The stem-cell niche as an entity of action. Nature. 2006;441:1075–1079. doi: 10.1038/nature04957. [DOI] [PubMed] [Google Scholar]
- 5.Kiel MJ, Morrison SJ. Uncertainty in the niches that maintain haematopoietic stem cells. Nat Rev Immunol. 2008;8:290–301. doi: 10.1038/nri2279. [DOI] [PubMed] [Google Scholar]
- 6.Hooper AT, et al. Engraftment and reconstitution of hematopoiesis is dependent on VEGFR2-mediated regeneration of sinusoidal endothelial cells. Cell Stem Cell. 2009;4:263–274. doi: 10.1016/j.stem.2009.01.006. [DOI] [PMC free article] [PubMed] [Google Scholar]
- 7.Liesveld JL, et al. Acute myelogenous leukemia—microenvironment interactions: role of endothelial cells and proteasome inhibition. Hematology. 2005;10:483–494. doi: 10.1080/10245330500233452. [DOI] [PubMed] [Google Scholar]
- 8.Lane SW, Scadden DT, Gilliland DG. The leukemic stem cell niche: current concepts and therapeutic opportunities. Blood. 2009;114:1150–1157. doi: 10.1182/blood-2009-01-202606. [DOI] [PMC free article] [PubMed] [Google Scholar]
- 9.Avecilla ST, et al. Chemokine-mediated interaction of hematopoietic progenitors with the bone marrow vascular niche is required for thrombopoiesis. Nat Med. 2004;10:64–71. doi: 10.1038/nm973. [DOI] [PubMed] [Google Scholar]
- 10.Butler JM, Kobayashi H, Rafii S. Instructive role of the vascular niche in promoting tumour growth and tissue repair by angiocrine factors. Nat Rev Cancer. 2010;10:138–146. doi: 10.1038/nrc2791. [DOI] [PMC free article] [PubMed] [Google Scholar]
- 11.Ding B, et al. Inductive angiocrine signals from sinusoidal endothelium are required for liver regeneration. Nature. 2010 doi: 10.1038/nature09493. [DOI] [PMC free article] [PubMed] [Google Scholar]
- 12.Butler JM, et al. Endothelial cells are essential for the self-renewal and repopulation of Notch-dependent hematopoietic stem cells. Cell Stem Cell. 2010;6:251–264. doi: 10.1016/j.stem.2010.02.001. [DOI] [PMC free article] [PubMed] [Google Scholar]
- 13.Libby P, Ridker PM, Maseri A. Inflammation and atherosclerosis. Circulation. 2002;105:1135–1143. doi: 10.1161/hc0902.104353. [DOI] [PubMed] [Google Scholar]
- 14.Folkman J. Angiogenesis in cancer, vascular, rheumatoid and other disease. Nat Med. 1995;1:27–31. doi: 10.1038/nm0195-27. [DOI] [PubMed] [Google Scholar]
- 15.Fernandez L, et al. Tumor necrosis factor-alpha and endothelial cells modulate Notch signaling in the bone marrow microenvironment during inflammation. Exp Hematol. 2008;36:545–558. doi: 10.1016/j.exphem.2007.12.012. [DOI] [PMC free article] [PubMed] [Google Scholar]
- 16.Yeoh JS, et al. Fibroblast growth factor-1 and -2 preserve long-term repopulating ability of hematopoietic stem cells in serum-free cultures. Stem Cells. 2006;24:1564–1572. doi: 10.1634/stemcells.2005-0439. [DOI] [PubMed] [Google Scholar]
- 17.Seandel M, et al. Generation of a functional and durable vascular niche by the adenoviral E4ORF1 gene. Proc Natl Acad Sci USA. 2008;105:19288–19293. doi: 10.1073/pnas.0805980105. [DOI] [PMC free article] [PubMed] [Google Scholar]
- 18.Shiojima I, Walsh K. Role of Akt signaling in vascular homeostasis and angiogenesis. Circ Res. 2002;90:1243–1250. doi: 10.1161/01.res.0000022200.71892.9f. [DOI] [PubMed] [Google Scholar]
- 19.Chen J, et al. Akt1 regulates pathological angiogenesis, vascular maturation and permeability in vivo. Nat Med. 2005;11:1188–1196. doi: 10.1038/nm1307. [DOI] [PMC free article] [PubMed] [Google Scholar]
- 20.Pages G, et al. Signaling angiogenesis via p42/p44 MAP kinase cascade. Ann N Y Acad Sci. 2000;902:187–200. doi: 10.1111/j.1749-6632.2000.tb06313.x. [DOI] [PubMed] [Google Scholar]
- 21.Matsunaga T, Kato T, Miyazaki H, Ogawa M. Thrombopoietin promotes the survival of murine hematopoietic long-term reconstituting cells: comparison with the effects of FLT3/FLK-2 ligand and interleukin-6. Blood. 1998;92:452–461. [PubMed] [Google Scholar]
- 22.Nemeth MJ, Topol L, Anderson SM, Yang Y, Bodine DM. Wnt5a inhibits canonical Wnt signaling in hematopoietic stem cells and enhances repopulation. Proc Natl Acad Sci USA. 2007;104:15436–15441. doi: 10.1073/pnas.0704747104. [DOI] [PMC free article] [PubMed] [Google Scholar]
- 23.Zhang CC, Lodish HF. Insulin-like growth factor 2 expressed in a novel fetal liver cell population is a growth factor for hematopoietic stem cells. Blood. 2004;103:2513–2521. doi: 10.1182/blood-2003-08-2955. [DOI] [PubMed] [Google Scholar]
- 24.Humar R, Kiefer FN, Berns H, Resink TJ, Battegay EJ. Hypoxia enhances vascular cell proliferation and angiogenesis in vitro via rapamycin (mTOR)-dependent signaling. FASEB J. 2002;16:771–780. doi: 10.1096/fj.01-0658com. [DOI] [PubMed] [Google Scholar]
- 25.Potente M, et al. Involvement of Foxo transcription factors in angiogenesis and postnatal neovascularization. J Clin Invest. 2005;115:2382–2392. doi: 10.1172/JCI23126. [DOI] [PMC free article] [PubMed] [Google Scholar]
- 26.Sun JF, et al. Microvascular patterning is controlled by fine-tuning the Akt signal. Proc Natl Acad Sci USA. 2005;102:128–133. doi: 10.1073/pnas.0403198102. [DOI] [PMC free article] [PubMed] [Google Scholar]
- 27.Huynh H, et al. Insulin-like growth factor-binding protein 2 secreted by a tumorigenic cell line supports ex vivo expansion of mouse hematopoietic stem cells. Stem Cells. 2008;26:1628–1635. doi: 10.1634/stemcells.2008-0064. [DOI] [PMC free article] [PubMed] [Google Scholar]
- 28.Zhang CC, Kaba M, Iizuka S, Huynh H, Lodish HF. Angiopoietin-like 5 and IGFBP2 stimulate ex vivo expansion of human cord blood hematopoietic stem cells as assayed by NOD/SCID transplantation. Blood. 2008;111:3415–3423. doi: 10.1182/blood-2007-11-122119. [DOI] [PMC free article] [PubMed] [Google Scholar]
- 29.Han W, Ye Q, Moore MA. A soluble form of human Delta-like-1 inhibits differentiation of hematopoietic progenitor cells. Blood. 2000;95:1616–1625. [PubMed] [Google Scholar]
- 30.Gering M, Patient R. Hedgehog signaling is required for adult blood stem cell formation in zebrafish embryos. Dev Cell. 2005;8:389–400. doi: 10.1016/j.devcel.2005.01.010. [DOI] [PubMed] [Google Scholar]
- 31.Goldman DC, et al. BMP4 regulates the hematopoietic stem cell niche. Blood. 2009;114:4393–4401. doi: 10.1182/blood-2009-02-206433. [DOI] [PMC free article] [PubMed] [Google Scholar]
- 32.Fleming HE, et al. Wnt signaling in the niche enforces hematopoietic stem cell quiescence and is necessary to preserve self-renewal in vivo. Cell Stem Cell. 2008;2:274–283. doi: 10.1016/j.stem.2008.01.003. [DOI] [PMC free article] [PubMed] [Google Scholar]
- 33.Kopp HG, et al. Tie2 activation contributes to hemangiogenic regeneration after myelosuppression. Blood. 2005;106:505–513. doi: 10.1182/blood-2004-11-4269. [DOI] [PMC free article] [PubMed] [Google Scholar]
- 34.Kopp HG, et al. Thrombospondins deployed by thrombopoietic cells determine angiogenic switch and extent of revascularization. J Clin Invest. 2006;116:3277–3291. doi: 10.1172/JCI29314. [DOI] [PMC free article] [PubMed] [Google Scholar]
- 35.Dimmeler S, Zeiher AM. Akt takes center stage in angiogenesis signaling. Circ Res. 2000;86:4–5. doi: 10.1161/01.res.86.1.4. [DOI] [PubMed] [Google Scholar]
- 36.Cross MJ, Claesson-Welsh L. FGF and VEGF function in angiogenesis: signalling pathways, biological responses and therapeutic inhibition. Trends Pharmacol Sci. 2001;22:201–207. doi: 10.1016/s0165-6147(00)01676-x. [DOI] [PubMed] [Google Scholar]
- 37.Rafii S, et al. Isolation and characterization of human bone marrow microvascular endothelial cells: hematopoietic progenitor cell adhesion. Blood. 1994;84:10–19. [PubMed] [Google Scholar]
- 38.Tang ED, Nunez G, Barr FG, Guan KL. Negative regulation of the forkhead transcription factor FKHR by Akt. J Biol Chem. 1999;274:16741–16746. doi: 10.1074/jbc.274.24.16741. [DOI] [PubMed] [Google Scholar]
- 39.Sarbassov DD, Guertin DA, Ali SM, Sabatini DM. Phosphorylation and regulation of Akt/PKB by the rictor-mTOR complex. Science. 2005;307:1098–1101. doi: 10.1126/science.1106148. [DOI] [PubMed] [Google Scholar]
Associated Data
This section collects any data citations, data availability statements, or supplementary materials included in this article.