

Abstract
The external urethral sphincter (EUS) and external anal sphincter (EAS) are the principal voluntary striated muscles that sustain continence of urine and faeces. In light of their common embryological origin, shared tonic sphincteric action and synchronized electrical activity in vivo, it was expected that they would exhibit similar physiological and structural properties. However, the findings of this study using paired observations of both sphincters isolated from the rat show clearly that this is not the case. The anal sphincter is much more fatigable than the urethral sphincter. On completion of a fatigue protocol, the amplitude of the last twitch of the EAS had declined to 42 ± 3% of the first twitch, whereas the last twitch of the EUS was almost identical to that of the first (95 ± 3%). Immunocytochemical detection of myosin heavy-chain isoforms showed that this difference was not due to the presence of more slow-twitch oxidative type 1 fibres in the EUS compared with the EAS (areal densities 4 ± 1% and 5 ± 1%, respectively; P = 0.35). In addition, the fatigue difference was not explained by a greater contribution to force production by fast oxidative type 2A fibres in the urethral sphincter. In fact, the anal sphincter contained a higher areal density of type 2A fibres (56 ± 5% vs. 37 ± 4% in the EUS, P = 0.017). The higher oxidative capacity of the EUS, measured histochemically, explained its fatigue resistance. These results were surprising because the fatigue-resistant urethral muscle exhibited faster single-twitch contraction times compared with the anal sphincter (56 ± 0.87 ms vs. 72.5 ± 1.16 ms, P < 0.001). Neither sphincter expressed the type 2X myosin isoform but the fast-twitch isoform type 2B was found exclusively in the EUS (areal density 16 ± 2%). The type 2B fibres of the EUS were small (diameter 19.5 ± 0.4 μm) in comparison to typical type 2B fibres of other muscles. As a whole the EUS is a more oxidative than glycolytic muscle. In conclusion, analysis of the twitch mechanics and fatigue of two sphincters showed that the EUS contained more fatigue-resistant muscle fibres compared with the EAS.
Keywords: external anal sphincter, external urethral sphincter, fatigue, oxidative capacity, rat
Introduction
The external urethral sphincter (EUS) and external anal sphincter (EAS) are striated muscles under volitional control that play fundamental roles in the maintenance of urinary and faecal continence. During development, the urethra and anal canal arise from a common embryological origin. Studies of rat embryos have shown that the urogenital and anorectal regions develop from a common membrane known as the cloaca (Forsberg, 1961). The two sphincters also display synchronized vesico-anal and vesico-urethral reflex-evoked discharge patterns (Thor & Muhlhauser, 1999; Pezzone et al. 2005). As the EUS and EAS have a common embryological origin and display synchronous electrical bursting activity, it is reasonable to expect that their physiological characteristics are similar. No previous study has directly compared the function of paired sphincters or compared their muscle fibre composition.
Wai et al. (2003) used a rat urethral ring preparation to evaluate striated muscle function and found that 30 s of maximal stimulation of the EUS caused contractions to fatigue to approximately 45% of their initial force. Only one study has examined the fatigability of the rat EAS. Healy et al. (2008) found that the contractions of EAS fatigued to 32% of their initial force. It is difficult to directly compare indices of fatigue of two muscles derived from separate studies as a fatigue protocol can be modified according to the experimental paradigm. For example, Wai et al. (2003) applied a continuous 150-Hz stimulation at maximal voltage for 30 s, whereas the stimulation protocol used by Healy et al. (2008) consisted of a more rhythmical pattern at a lower frequency of 50 Hz. Therefore, the most direct comparison of fatigability of the EUS and EAS is achieved by isolating both sphincters from one animal and subjecting them simultaneously to the same stimulation protocol.
The EAS of the rat is not well studied in comparison to the EUS. The fibre type composition of the EUS is variable across different species. The aims of this study were twofold: first, to compare the contractile properties of the rat EAS and EUS, including fatigue indices and contraction and relaxation times. Second, the functional studies were correlated to the fibre type profiles and oxidative capacities of both sphincters.
Materials and methods
All experiments were approved by the Irish Government Department of Health and Children and the Animal Research Ethics Committee, University College Dublin. Fifteen female Wistar rats ranging in weight from 200 to 250 g were killed humanely by a blow to the head followed by cervical dislocation. The anal canal and perianal skin were removed en bloc to preserve the integrity of the EAS. The rectum was transected 2 mm from the anal orifice. The majority of the excess perianal fat and skin was removed using an operating microscope. This exposed the striated sphincter that surrounds the anal orifice. The bladder, urethra and meatus were removed en bloc and further dissected to isolate the urethra. Excess tissue, including the ventral vaginal wall, was teased away. A 5-mm-long section from the middle third of the urethra containing the striated EUS was isolated (Russell et al. 1996).
In-vitro preparation
Anal and urethral rings from eight animals were mounted between two metal rods in tissue baths. Baths contained Hepes-buffered Tyrode's solution (pH 7.4), which was maintained at 37 °C and bubbled with 100% O2. Tyrode's salts consisted of 1.36 mm CaCl2, 1.0 mm MgCl2, 2.7 mm KCl, 137.0 mm NaCl, 0.35 mm NaH2PO4 and 5.5 mm D-glucose. D-tubocurarine (10−4 m) was also added to the bath solution to ensure nerve-independent muscle contraction. Contractions were detected by a force transducer (Grass FT03, Slough, UK), relayed to an analogue to digital convertor (1401; Cambridge Electronic Design, Cambridge, UK) and displayed using Spike2 software (Cambridge Electronic Design). Electrical field stimulation was delivered via two silver–silver chloride stimulating electrodes, which were placed in close proximity to the anal and urethral sphincters. The optimal length, which is the length at which the largest force is produced, was obtained whilst applying single 1-ms pulses at 1 Hz and varying the degree of stretch applied to the muscles. The tissues were not snap frozen at particular sarcomere lengths but allowed to return to the natural conformation dictated by the baseline active tension of unstretched smooth sphincters. Once the baseline had stabilized, the force/frequency relationship was examined using stimulation frequencies from 5 to 50 Hz in 5-Hz increments. Both sphincters were then subjected to a fatigue protocol 300 s later. The fatigue protocol consisted of 50 200-ms trains at 50 Hz, which were 4 s apart. This was followed immediately by 10 200-ms trains at 50 Hz, 30 s apart, to monitor the recovery of the muscle.
Histochemistry
Segments of the urethra and anal canal from four animals were snap frozen in isopentane cooled in liquid nitrogen. They were frozen longitudinally so that, when cut, the striated muscle fibres would be seen in transverse section. The frozen tissue was cryosectioned (cryostat CM30505; Leica Microsystems, Nussloch, Germany) and placed on Polysine™ glass slides (VWR International, Dublin). In order to determine the oxidative capacities of the EAS and EUS, sections were stained histochemically for the enzyme succinate dehydrogenase (SDH). SDH is a mitochondrial enzyme involved in the electron transport chain. The more oxidative a muscle fibre, the greater the number of mitochondria it contains. Thus, oxidative fibres stain darkly with SDH histochemistry, giving them a higher optical density than glycolytic fibres. The stain consisted of sodium succinate (1.08 g), 1 m phosphate buffer and nitroblue tetrazolium salts (10 mg) dissolved in deionized water and brought to pH 7.4 with drops of NaOH (1 m). Paired sphincters were mounted on the same block and serial sections were cut to ensure identical section thickness when the quantitative histochemistry protocol was applied. The 20 μm-thick sections were incubated for 10 min at 37 °C with the SDH stain. During each incubation, control sections were exposed to a solution that lacked the substrate sodium succinate to ensure that non-specific redox reactions did not contribute to the blue staining.
High-power images (× 400 magnification) of the striated muscle region from stained sections (one for each sphincter per animal) were obtained using a BX51 microscope (Olympus Life Science Microscopes, Munchen, Germany) and DP71 camera. The optical density of a particular fibre was used as a marker of its oxidative capacity (the more oxidative the fibre, the darker it stained). The software Scion Image™ (Scion Corporation, MD, USA) was used to calculate the optical densities and cross-sectional areas of a total of 350 striated muscle fibres (175 from the EAS and 175 from the EUS). Optical density was expressed in uncalibrated optical density units (U.OD).
Immunocytochemistry
To determine the fibre types present, additional longitudinal sections of the EUS and EAS from three of the specimens used for histochemistry were prepared for myosin immuncytochemistry. Serial sections were cryosectioned at 20-μm thickness and placed on Polysine™ slides so that there were four slides per animal, each containing a section from both sphincters. Each slide was assigned to a particular fibre type and labelled accordingly. The sections were fixed in precooled methanol at −20 °C for 30 min. This was followed by a 30-min incubation in phosphate-buffered saline (PBS), 1% bovine serum albumin (BSA) and 5% goat serum to block non-specific binding of antibodies. Sections were incubated with one of the four mouse anti-myosin antibodies [type 1 and 2A immunoglobulins G (IgGs) and type 2X and 2B immunoglobulins M (IgMs)]. These primary antibodies, developed by H. Blau and C. Lucas, were obtained from the Developmental Studies Hybridoma Bank (DSHB) developed under the auspices of the NICHD and maintained by The University of Iowa, Department of Biology, Iowa City. Type 1 and 2A IgG primary antibodies were diluted to 1 : 100 in a PBS and 1% BSA solution, whereas type 2X and 2B sera were applied directly onto tissue sections at a 1 : 1 concentration. Incubation with all primary antibodies was conducted with a humidity chamber overnight at 4 °C.
The sections were rinsed in PBS/1% BSA solution and incubated for 1 h at room temperature (20°C) with secondary antibodies in the dark (to avoid any fading of the fluorescent signal). Secondary antibodies included a fluorescein isothiocyanate (FITC)-conjugated anti-mouse IgG (1 : 50; Sigma-Aldrich, Dublin, Ireland) to target the type 1 and 2A IgGs. Type 2X and 2B IgMs were targeted by a FITC-conjugated anti-mouse IgM, μ-chain-specific secondary antibody (1 : 50; Sigma-Aldrich). Slides were rinsed with PBS, coverslipped with vectashield (mounting medium for fluorescence, H-1000; Vector Laboratories, Peterborough, UK) and stored at 4 °C.
Triple labelling
Sphincters from a further three animals were triple labelled for three fibre types at a time. Slides contained two 20-μm-thick sections from both the EAS and EUS. Sections were incubated for 1 h at room temperature in PBS, 1% BSA and 5% goat serum solution. Incubation with the primary antibodies was conducted overnight at 4 °C. One section from each sphincter was incubated with a mouse IgG1 primary antibody (1 : 10) that targeted all except type 2X fibres. All fibre types apart from type 2X fibres were highlighted with a Dylight594-conjugated anti-mouse 1gG1 secondary antibody (1 : 500). The remaining sections were incubated with a cocktail of antibodies that targeted type 1, 2A and 2B antibodies. The primary cocktail consisted of mouse type 1 IgG2b (1 : 100), type 2A IgG1 (1 : 100) and type 2B IgM (1 : 25) antibodies. Primary myosin antibodies, developed by S. Schiaffino, were again obtained from the DSHB in Iowa. Secondary antibodies included an AlexaFluor350-conjugated goat anti-mouse IgG2b (1 : 500; Invitrogen, Dun Laoghaire, Dublin), a Dylight594-conjugated anti-mouse IgG1 (1 : 500; Jackson Immuno Research Europe Ltd, Suffolk, UK) and an AlexaFluor488-conjugated goat anti-mouse IgM (1 : 250; Invitrogen). Rabbit anti-laminin antibodies (cat no. L9393; Sigma-Aldrich) were used to highlight the connective tissue surrounding each fibre. Laminin labelling was visualized with either tetramethyl rhodamine isothiocyanate- or FITC-conjugated anti-rabbit secondary antibodies (catalogue numbers T6778 and F9887; Sigma-Aldrich). Secondary antibody incubation was for 1 h at room temperature in the dark. In order to test the selectivity of the myosin antibodies, 20-μm sections of diaphragm and sternohyoid muscle were treated as above. Also, negative control experiments in which the primary antibodies were omitted were conducted.
Quantification of areal densities
Two low-power images (× 200 magnification) per section, one right and one left, were captured, both with the full wall thickness in focus. The software package, Cell A™ (Olympus), was used to digitally analyse these images and calculate the areal density for each fibre type. The traditional method of calculating percentage fibre type in a particular field is to use a square test frame (Knudsen et al. 1991). This avoids the same fibre being counted twice. Here, the sum of the areas of all of the positively labelled fibres in a particular fascicle was expressed as a percentage of the total area of that fascicle. This eliminated the need for a square test frame and also ensured that areal density figures included muscle fibres alone, i.e. no blood vessels were included. The amount of connective tissue surrounding each fibre was taken into account by determining the percentage of a selected region of the striated muscle labelled with laminin. Scion image™ was used to convert images to black and white and compute the percentage of black and white pixels in the image (n = 4). The thresholded binary images were created with reference to an indexed colour image. As the laminin label was very bright it was relatively easy to replicate the degree of staining by the thresholding method across all sections.
Data are expressed as mean ± SEM and statistically analysed with a Student's paired t-test unless otherwise stated.
Results
Force/frequency curves
As the urethra and anal canal contain both striated and smooth muscle, it was important to differentiate between separate contractions of each muscle type. The striated external sphincters produced fast muscle contractions that were easily discriminated from the much slower contractions of the internal smooth muscle (Fig. 1). The size of the striated muscle twitches was taken as the difference in force from the pretwitch baseline to twitch peak. The EUS produced contractions of lower force than the EAS. The initial contractile forces were 10.14 ± 1.17 mN vs. 55.65 ± 3.46 mN (n = 8). Original traces from the EUS and EAS are displayed in the figures at different scales to allow the urethral striated muscle twitch to be seen more clearly. A representative force/frequency trace from each sphincter is shown in Fig. 2A. Analysis of the force/frequency protocol (using curve fitting to the sigmoidal logistic equation) showed the frequency at which each sphincter had reached half of its maximum contraction, i.e. the EF50 value. The EUS had a higher EF50 value (29.07 ± 0.75 Hz) compared with the EAS (23.9 ± 1.59 Hz; P = 0.006) (Fig. 2B).
Fig. 1.
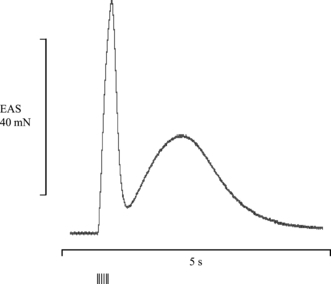
Differentiation between striated and smooth muscle contractions. Representative trace showing the response of the external anal sphincter (EAS) to a 50-Hz stimulation. The initial peak represents the fast striated muscle twitch, which was often followed by a slow increase in baseline representing a contraction of the internal smooth muscle. Vertical lines indicate the electrical stimulus.
Fig. 2.
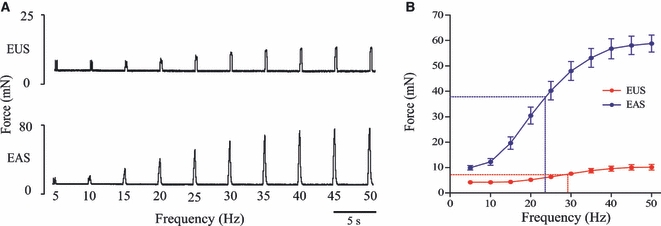
Force/frequency curves and EF50 values. (A) Representative force/frequency traces from the external urethral sphincter (EUS) and external anal sphincter (EAS) (please note different scaling on y-axes). (B) Group data displayed in force/frequency curves on which the EF50 values are highlighted with dashed lines. The EUS had a significantly higher EF50 value than the EAS (29.1 ± 0.8 Hz and 23.9 ± 1.6 Hz, respectively, P = 0.006, n = 8).
Fatigue indices of the external urethral sphincter and external anal sphincter
The representative traces in Fig. 3A and group data in Fig. 3B show how the EUS and EAS responded differently when subjected to the fatigue protocol. The EUS was relatively fatigue resistant as its final contraction fatigued to 94.93 ± 3.09% of the initial contractile force. In contrast, the EAS was quite susceptible to fatigue, its final contraction having fatigued to 41.86 ± 2.73% of the initial contractile force. The EUS was less susceptible to fatigue than the EAS (n = 8; P < 0.001). No recovery was seen in the EAS. As the EUS did not fatigue, there was no significant difference between contractions during the fatigue and recovery protocols.
Fig. 3.
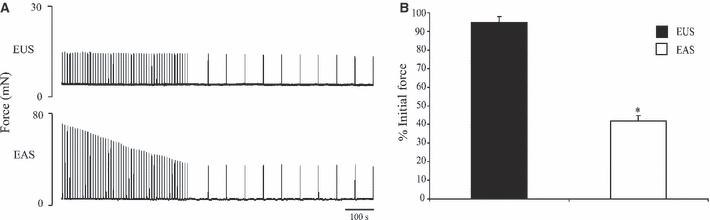
Fatigue indices of the external urethral sphincter (EUS) and external anal sphincter (EAS). (A) Representative trace (B) group data displaying the fatigue indices for the EUS and EAS. The force of the final contraction of the EUS fatigued to 94.9 ± 3.1% of the initial force. The force of the final contraction of the EAS had fatigued to 41.9 ± 2.7% of the initial force (P < 0.001, n = 8). *Indicates statistical significance.
Contractile properties of the external urethral sphincter and external anal sphincter
Analysis of single-twitch data suggested that the EUS is composed of faster twitch fibres than the EAS; the group data are shown in Fig. 4A. The EUS displayed significantly shorter contraction times than the EAS (56.00 ± 0.87 ms and 72.5 ± 1.16 ms, respectively, P < 0.001). The time taken for the EUS to relax to half of its maximum force was shorter than the EAS (27.50 ± 1.09 ms vs. 44.63 ± 1.69 ms, P < 0.001). When the frequency of stimulation reached 20 Hz, contractions in the EUS had not achieved fused tetany, whereas contractions of the EAS had fused to form a smooth twitch (Fig. 4B).
Fig. 4.
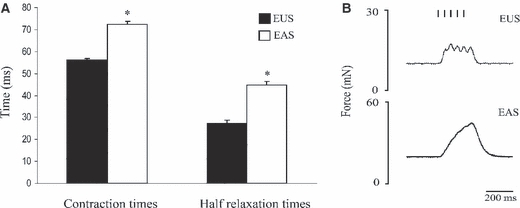
Comparison of contraction and relaxation times of muscle twitches of the external urethral sphincter (EUS) and external anal sphincter (EAS). (A) The EUS displayed shorter contraction times than those in the EAS (56.00 ± 0.87 ms and 72.50 ± 1.16 ms, respectively, P < 0.001). The time taken for the EUS to relax to half of its maximum force was shorter than the EAS (27.50 ± 1.09 ms vs. 44.63 ± 1.69 ms, P < 0.001). (B) Individual contractions of the EUS could still be seen at 20 Hz, whereas contractions of the EAS had fused to form a smooth peak. *Indicates statistical significance.
Fibre area and oxidative capacities
Figure 5A,B shows fibres of the EUS and EAS cut in transverse section. Sections were stained for the enzyme SDH (blue) to determine the oxidative capacities of fibres from both sphincters. Control sections that had been incubated in a substrate-free solution showed no staining of the striated muscle. Fibres of the EUS were clearly more oxidative than those in the EAS as the staining was more intense. To compare the intensity of staining in both muscles, the optical densities were measured in a total of 350 fibres. Fibres of the EUS displayed higher optical densities than those of the EAS (average optical densities were 0.43 ± 0.04 U.OD and 0.29 ± 0.01 U.OD, respectively) (P = 0.029). The circumference of each fibre was highlighted with antibodies against laminin (red). The areas of a total of 350 fibres were measured (175 from the EUS, 175 from the EAS). The average cross-sectional area of the fibres (for all fibre types) in the EUS was 215 ± 16 μm2 vs. 314 ± 44 μm2 in the EAS (P = 0.019, n = 4). The scatter plot in Fig. 5C displays the relationship between the optical density and fibre area of 50 fibres of both sphincters from one representative animal. Fibres of the EAS were larger and less oxidative than those of the EUS.
Fig. 5.
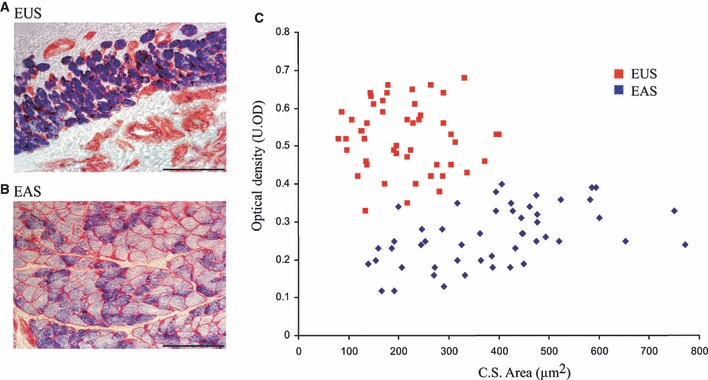
Relationship between fibre area and optical density in the external urethral sphincter (EUS) and external anal sphincter (EAS). Fibres of the EUS (A) and EAS (B) cut in transverse section. Sections were treated with a stain for succinate dehydrogenase (blue) and antibodies against laminin (red) to highlight both the oxidative capacity and cross-sectional (C.S.) area. Scale bar = 100 μm. (C) Scatter diagram displays data from one representative animal (50 fibres from each sphincter) and clearly shows that fibres in the EUS had smaller areas (x-axis) and higher optical densities (y-axis) and therefore oxidative capacities than fibres in the EAS. U.OD, optical density units.
Fibres type profiles of the external urethral sphincter and external anal sphincter
High-power images of triple-labelled sections are shown in Fig. 6. Selective labelling of pure type 1 (blue), 2A (red) and 2B (green) fibres is shown in the sternohyoid (Fig. 6, bottom panel). In sections of the diaphragm stained with type 2X antibodies, all fibre types excluding type 2X fibres were labelled (not illustrated). Figure 6 shows the selective labelling of fibre type 1, 2A and 2B in the EUS and EAS. The high-power images in Fig. 6 also highlight the difference in cross-sectional area of fibres in the three muscles. Comparisons of the areal densities or the percentage of positively labelled fibres in a particular fascicle are summarized in Table 1. The average fascicle area sampled in the EUS was 30 214 μm2 and in the EAS it was 37 186 μm2. The EUS and EAS contain a similar percentage of type 1 fibres (4 ± 1% and 5 ± 1%, respectively) (P = 0.348). The areal density of type 2A fibres was significantly lower in the EUS than in the EAS (37 ± 4% vs. 56 ± 5%) (P = 0.017). The EUS contained 16 ± 2% type 2B fibres, which were absent from the EAS. No type 2X fibres were observed in either the EUS or EAS. The percentage of muscle occupied by connective tissue was determined by quantifying the positively labelled laminin regions. In the EUS this was 34 ± 2% and in the EAS it was significantly lower (28 ± 2%) (P = 0.027). Table 1 also shows that in each sphincter there is a proportion of the tissue that is not accounted for (9% in the EUS and 11% in the EAS).
Fig. 6.
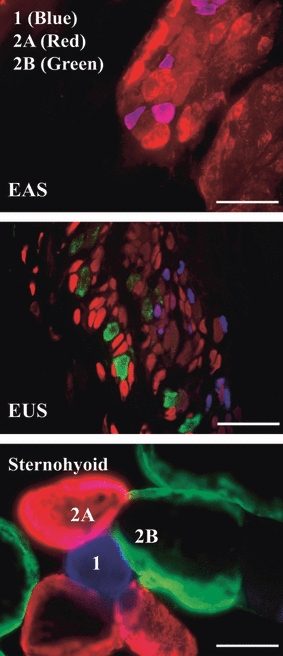
Triple labelling in the external anal sphincter (EAS), external urethral sphincter (EUS) and sternohyoid. Selective labelling of type 1 (blue), 2A (red) and 2B (green) striated muscle fibres cut in transverse section. All three images were captured at the same magnification. The top panel shows two fascicles containing many tightly packed striated muscle fibres in the EAS. The middle panel shows fibres of the EUS, which contain the smallest fibres of the three muscles. The lower panel shows seven sternohyoid muscle fibres. These fibres, which are similar in size to other major striated muscle fibres in the rat, highlight the particularly small size of fibres in the EUS and EAS. Scale bar = 50 μm.
Table 1.
Areal densities and diameters of fibres in the external urethral sphincter (EUS) and external anal sphincter (EAS).
| EUS | EAS | |||
|---|---|---|---|---|
| Areal density (% of total) | ||||
| Laminin | 34 ± 2 | 28 ± 2 | N = 4 | P = 0.027 |
| Type 1 | 4 ± 1 | 5 ± 1 | N = 6 | P = 0.348 |
| Type 2A | 37 ± 4 | 56 ± 5 | N = 6 | P = 0.017 |
| Type 2B | 16 ± 2 | 0 | N = 5 | P < 0.001 |
| Type 2X | 0 | 0 | N = 6 | |
| Total % | 91 | 89 | ||
| Type 1 | Type 2A | Type 2B | Type 2X | |
| Average fibre diameter (μm) | ||||
| EUS | 11 ± 0.26 | 14 ± 0.1 | 19.5 ± 0.4 | 0 |
| EAS | 17 ± 0.5 | 20 ± 0.2 | 0 | 0 |
Percentages of positively labelled fibres and connective tissue (laminin) in a particular fascicle in the EUS and EAS. Average diameters of each fibre type (μm). The average fascicle area sampled was 30 214 μm2 in the EUS and 37 186 μm2 in the EAS.
The frequency distributions of each fibre type in both sphincters are compared in Fig. 7. These show that type 1 fibres in the EUS were significantly smaller in cross-sectional area than fibres of the EAS (103 ± 5 vs. 248 ± 14 μm2) (P < 0.001, Komolgorov Smirnov test). The cross-sectional areas of type 2A fibres in the EUS were also smaller than in the EAS (163 ± 3 vs. 348 ± 6 μm2, P < 0.001, Student's unpaired t-test). The type 2A fibres of the EAS were the largest of all of the fibre types and their cross-sectional areas were greater than type 2B fibres in the EUS (348 ± 6 μm2 vs. 314 ± 11 μm2, P = 0.011, Student's unpaired t-test).
Fig. 7.
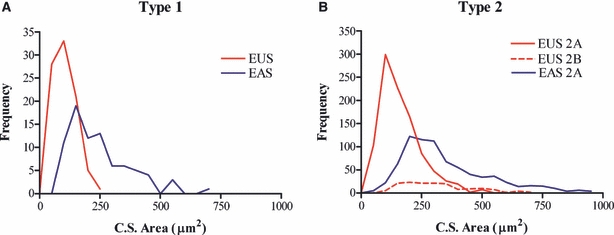
Frequency distribution of type 1 (panel A) and 2A (panel B) fibres in the external urethral sphincter (EUS) and external anal sphincter (EAS). Fibres of the EUS were smaller in area than those of the EAS. Overall, the largest fibres were the type 2A fibres in the EAS. C.S., cross-sectional.
Fibre arrangement in the external urethral sphincter
In the EUS, the majority of type 1 fibres were concentrated adluminally with relatively few type 1 fibres scattered randomly throughout the rest of the muscle (Fig. 8A). Figure 8B highlights the presence of a small population of type 1/2A hybrid fibres (pink). Also, the type 2A fibres adjacent to the lumen appear small in cross-sectional area, whereas those that are nearer to the adventitial side appear to be larger.
Fig. 8.
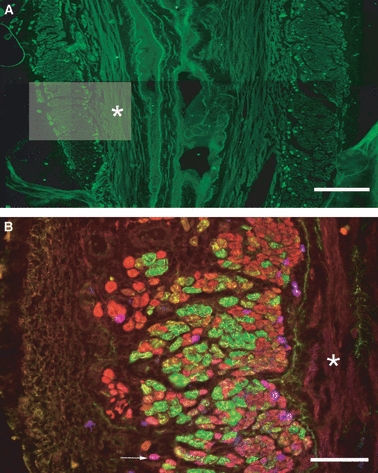
Fibre arrangement in the external urethral sphincter. Montage of low-power images of the urethra, oriented longitudinally. The full width of the urethra can be seen with both right and left walls of the external urethral sphincter (EUS) on either side of the lumen. Fibres of the EUS were cut in transverse section and stained for type 1 myosin only. The majority of positively labelled type 1 fibres are located adluminally. Scale bar = 300 μm. (B) High-power micrograph of the left wall of the EUS, which focuses on an area similar to that highlighted in (A). This section of urethra was triple labelled for three myosin isoforms [type 1 (blue), 2A (red) and 2B (green)]. White arrow indicates a pink type 1/2A hybrid fibre. Scale bar = 100 μm. *Internal smooth muscle.
Discussion
The results of this study show that the EUS and EAS are striated muscles with very different characteristics. The EAS produced greater contractile forces and was quite susceptible to fatigue, whereas contractions of the EUS were of lesser magnitude and fatigue resistant. Analysis of the single-twitch data showed that the kinetics of the two sphincters also differed; contraction and relaxation were significantly briefer events for the EUS. Also, the structural part of this study has shown that the EUS is composed of small oxidative muscle fibres, whereas fibres in the EAS are larger and less oxidative. Both the EUS and EAS contain a small population of type l fibres and a larger population of type 2A fibres. The EUS contained positively labelled type 2B fibres, which were absent in the EAS. A summary of the main findings can be found in Table 2.
Table 2.
Summary of data.
| Areal density (%) | ||||||
|---|---|---|---|---|---|---|
| Initial force (mN) | Contraction time (ms) | Oxidative capacity (U.OD) | Type 1 | Type 2A | Type 2B | |
| EUS | Weak | Fast | High | 4 | 37 | 16 |
| EAS | Strong | Slow | Low | 5 | 56 | 0 |
EAS, external anal sphincter; EUS, external urethral sphincter; U.OD, optical density units.
It was hypothesized that the EAS and EUS would have similar contractile and fatigue properties. However, it is clear from the present study that this is not the case. This is surprising due to the common embryological origin and the similarities in neural discharge patterns. Electromyographic recordings of EAS and EUS activities have shown that their vesico-anal and vesico-urethral reflex-evoked discharge patterns are synchronous and almost identical (Thor & Muhlhauser, 1999; Pezzone et al. 2005).
The EUS has a smaller volume than the EAS when measured stereologically. The derivation of sphincter mass for the EUS and EAS using a constant for muscle density yields figures of approximately 10 and 31 mg kg−1, respectively (sphincter mass per unit body mass; Banahan et al. 2009). Also, the individual fibres of the EAS have larger cross-sectional areas than fibres of the EUS, resulting in the production of greater forces per fibre. Although fibres of the EAS are larger than in the EUS, in general, fibres of the EAS and EUS are particularly small compared with other striated muscles (Fig. 6). The average cross-sectional area of the smallest fibre type, type 1 fibres, in upper airway dilator muscles such as the sternohyoid in young rats has been calculated to be 1291 μm2 (Oliven et al. 2001). This is almost 13 times the cross-sectional area of the smallest fibres examined in this study, i.e. the type 1 fibres in the EUS. The contraction and half relaxation times of the single muscle twitch of the EUS were significantly shorter than those of the EAS. Periurethral striated muscle has been shown previously to display contractile properties similar to some fast-twitch muscles (Bowen et al. 1976). Although, in this study, contraction times of the EUS were faster than those of the EAS, neither sphincter displayed contraction times that could be classed as particularly fast. The contraction times in the EAS are similar to those of muscles composed predominantly of small dark aerobic type 1 fibres (e.g. a common type found in the soleus). This presented a paradox as the EAS is fatigable and generates more force than the faster fibres of the EUS. Thus, the second part of this study was concerned with examining the structural characteristics of both sphincters. It aimed to correlate measurements of their fatigue indices to their oxidative capacities and their contractile properties with their myosin expression.
The EAS and EUS display different fatigue indices, which suggests that the two sphincters have different oxidative capacities. The fact that the EUS was fatigue resistant suggested that it contained a higher percentage of small-diameter oxidative fibres than the fatigable EAS, which would therefore be composed of larger diameter less oxidative fibres. This was consistent with our findings from histochemical experiments in which the optical densities of sections of the EAS and EUS were stained for SDH, an enzyme of the electron transport chain. The scatter plot of Fig. 5 shows that the fibres of the EUS were, in fact, significantly smaller in area and had higher optical densities than fibres of the EAS. Sections of the urethra and anal canal were taken from the mid-belly of the muscle to sample the largest area possible. Previous studies involving SDH activity have shown that there is very little variation in SDH activity in different regions of a particular muscle (Pette et al. 1980).
In the current study, both sphincters were found to contain a small population of type 1 fibres and larger population of type 2A fibres. The frequency distribution graphs in Fig. 6 show that type 1 fibres were larger in the EAS but were present in greater numbers in the EUS although the two sphincters displayed similar area densities for type 1 fibres. The EUS contained a greater number of type 2A fibres; in fact they were the most numerous fibre type overall. However, the type 2A fibres of the EAS were the largest fibres overall, even larger than the type 2B fibres of the EUS. This resulted in the areal density of type 2A fibres in the EAS being significantly higher than in the EUS (Table 1). The EUS contained type 2B fibres, which were absent from the EAS. This can explain the difference in contractile kinetics seen in the two sphincters, the EUS being a faster twitch muscle than the EAS (see Table 2 for summary).
In the diaphragm, all fibres were highlighted apart from a population of type 2X fibres, which remained unlabelled. This was not seen in the EAS or EUS and, thus, neither sphincter appears to contain type 2X fibres. The percentage of the muscle occupied by connective tissue was determined by quantifying the percentage of positively labelled laminin regions. This was significantly higher in the EUS than the EAS. Under a given magnification when examining the same sized area of EAS and EUS, there are more EUS fibres compacted together due to their smaller cross-sectional areas. This means that there is more connective tissue and therefore greater laminin labelling. The remaining 11% (EAS) and 9% (EUS) of tissue that is undefined may be due to the presence of fibres that expressed an uncharacterized form of myosin.
The two sphincters contained a similar percentage of type 1 fibres. The majority of type 1 fibres in the EUS were located adjacent to the lumen (Fig. 8). The concentration of fibres at a particular region of the muscle did not affect the measurements, as images analysed included the entire wall. This adluminal distribution of the type 1 fibres in the EUS has been described before in striated muscles of dogs (Augsburger & Cruz-Orive, 1994) and in calves (Sautet et al. 1987). Conversely, in the lamb EUS, type 1 and 2 fibres are intermingled throughout the EUS (Rodríguez-Veiga et al. 2005). The anisotropic distribution of the type 1 fibres in the rat EUS could be due to the fact that the area closest to the lumen is highly vascular and thus the type 1 fibres may congregate around the area so as to have a good supply of oxygen. The functional significance of this is possibly to ensure sustained contractions and avoid leakage of urine in between episodes of micturition. The EUS displayed faster contractile kinetics than the EAS, which can be explained by its expression of myosin heavy chain type IIB, which was absent in the EAS. The presence of fast-twitch fibres in the EUS may be of functional significance. It is possible that it is required for the rhythmical activity that the EUS muscle exhibits during micturition and may contribute to the milking action that the urethra has on expulsion of bladder urine.
The EAS and EUS have different fibre type compositions, which suggests that they receive different impulse patterns from their motor nerve fibres. As the EAS and EUS have almost identical reflex-evoked discharge patterns, the difference must lie in their basal discharge patterns. Perhaps the basal neural discharge frequency to the EAS is less than that to the EUS; this fits with the slower contraction times observed in the EAS and its lower EF50 value calculated from the force/frequency curve. This hypothesis concerning different basal frequencies in the motor control of the two sphincters has not been tested thus far. The EMG data from the work of Pezzone et al. (2005) did not include single motor unit action potentials.
In conclusion, the EUS is composed of small, oxidative fatigue-resistant muscle fibres, whereas fibres in the EAS are larger, less oxidative and more susceptible to fatigue. Both sphincters contain a similar, small proportion of type 1 fibres. Only the EUS contains type 2B fibres, which account for its relatively fast contractile kinetics. These latter fibres are of particular interest as they depart from the usual description of type 2B fibres as large, pale, fatigable, glycolytic fibres because they are quite different, being very small, oxidative and resistant to fatigue.
Acknowledgments
This work was supported by the Health Research Board, Ireland and School of Medicine and Medical Science, University College Dublin. We wish to acknowledge Clodagh McMorrow for her advice and guidance regarding the triple-labelling immunofluorescence protocol. We acknowledge Hugh Butler for his contribution to the histochemical and immunocytochemical work. We acknowledge the Developmental Studies Hybridoma Bank (DSHB) developed under the auspices of the NICHD and maintained by The University of Iowa, Department of Biology, Iowa City, IA 52242, USA.
References
- Augsburger HR, Cruz-Orive LM. Morphological, histochemical and stereological analysis of the female canine M. urethralis. Histochemistry. 1994;102:373–382. doi: 10.1007/BF00268908. [DOI] [PubMed] [Google Scholar]
- Banahan M, Peirce C, Buffini M, et al. Atrophy of the sphincters of continence in an experimental model. Colorectal Dis. 2009;12:153–157. doi: 10.1111/j.1463-1318.2009.02023.x. [DOI] [PubMed] [Google Scholar]
- Bowen JM, Timm GW, Bradley WE. Some contractile and electrophysiological properties of the periurethral striated muscle of the cat. Invest Urol. 1976;13:327–330. [PubMed] [Google Scholar]
- Forsberg JG. On the development of the cloaca and the perineum and the formation of the urethral plate in female rat embryos. J Anat. 1961;95:423–436. [PMC free article] [PubMed] [Google Scholar]
- Healy CF, McMorrow C, O’Herlihy C, et al. External anal sphincter fatigue is not improved by N-acetylcysteine in an animal model. Neurogastroenterol Motil. 2008;20:719–724. doi: 10.1111/j.1365-2982.2008.01101.x. [DOI] [PubMed] [Google Scholar]
- Knudsen UB, Laurberg S, Danielsen CC. Age-related changes in the striated anal sphincter in female rats. Scand J Gastroenterol. 1991;26:347–352. doi: 10.3109/00365529109025053. [DOI] [PubMed] [Google Scholar]
- Oliven A, Carmi N, Raymond C, et al. Age-related changes in upper airway muscles morphological and oxidative properties. Exp Gerontol. 2001;36:1673–1686. doi: 10.1016/s0531-5565(01)00127-9. [DOI] [PubMed] [Google Scholar]
- Pette D, Wimmer M, Nemeth P. Do enzyme activities vary along muscle fibres? Histochemistry. 1980;67:225–231. doi: 10.1007/BF00692756. [DOI] [PubMed] [Google Scholar]
- Pezzone MA, Liang R, Fraser MO. A model of neuronal cross-talk and irritation in the pelvis: implications for the overlap of chronic pelvic pain disorders. Gastroenterology. 2005;128:1953–1964. doi: 10.1053/j.gastro.2005.03.008. [DOI] [PubMed] [Google Scholar]
- Rodríguez-Veiga E, Mestre-Nieto L, Martínez-Sainz P, et al. Stereological study of the external urethral sphincter in the female urethra of the lamb: a new model for studies on urinary continence. Anat Histol Embryol. 2005;34:85–92. doi: 10.1111/j.1439-0264.2004.00575.x. [DOI] [PubMed] [Google Scholar]
- Russell B, Baumann M, Heidkamp MC, et al. Morphometry of the aging female rat urethra. Int Urogynecol J Pelvic Floor Dysfunct. 1996;7:30–36. doi: 10.1007/BF01895103. [DOI] [PubMed] [Google Scholar]
- Sautet JY, Amara A, Cabanie P, et al. The urethral muscle (Musculus urethralis) of the female calf. Anatomical, histological and morphometrical data. Acta Anat. 1987;130:366–372. doi: 10.1159/000146473. [DOI] [PubMed] [Google Scholar]
- Thor KB, Muhlhauser MA. Vesicoanal, urethroanal, and urethrovesical reflexes initiated by lower urinary tract irritation in the rat. Am J Physiol. 1999;277(4 Pt 2):R1002–R1012. doi: 10.1152/ajpregu.1999.277.4.R1002. [DOI] [PubMed] [Google Scholar]
- Wai CY, Liehr P, Tibbals HF, et al. Effect of periurethral denervation on function of the female urethra. Am J Obstet Gynecol. 2003;189:1637–1645. doi: 10.1016/s0002-9378(03)00901-3. [DOI] [PubMed] [Google Scholar]