Abstract
The plantar aponeurosis (PA), in spanning the whole length of the plantar aspect of the foot, is clearly identified as one of the key structures that is likely to affect compliance and stability of the longitudinal arch. A recent study performed in our laboratory showed that tension/elongation in the PA can be predicted from the kinematics of the segments to which the PA is attached. In the present investigation, stereophotogrammetry and inverse kinematics were employed to shed light on the mechanics of the longitudinal arch and its main passive stabilizer, the PA, in relation to walking speed. When compared with a neutral unloaded position, the medial longitudinal arch underwent greater collapse during the weight-acceptance phase of stance at higher walking speed (0.1°±1.9° in slow walking; 0.9°±2.6° in fast walking; P = 0.0368). During late stance the arch was higher (3.4°±3.1° in slow walking; 2.8°±2.7° in fast walking; P = 0.0227) and the metatarsophalangeal joints more dorsiflexed (e.g. at the first metatarsophalangeal joint, 52°±5° in slow walking; 64°±4° in fast walking; P < 0.001) during fast walking. Early-stance tension in the PA increased with speed, whereas maximum tension during late stance did not seem to be significantly affected by walking speed. Although, on the one hand, these results give evidence for the existence of a pre-heel-strike, speed-dependent, arch-stiffening mechanism, on the other hand they suggest that augmentation of arch height in late stance is enhanced by higher forces exerted by the intrinsic muscles on the plantar aspect of the foot when walking at faster speeds.
Keywords: foot biomechanics, intrinsic muscles, inverse kinematics, longitudinal arch, plantar aponeurosis, walking speed, windlass mechanism
Introduction
The plantar aponeurosis (PA), a quasi-elastic fibrous connective band originating on the inferior border of the calcaneus and inserting at the base of the proximal phalanges of the five toes, is one of the most important passive structures supporting the medial longitudinal arch (MLA) of the foot (Hicks, 1954). During dynamic activity the PA acts in synergy with other ligaments and tendons on the plantar aspect of the foot, by storing elastic energy through passive elongation (Ker et al. 1987), hence also changing foot compliance. In-vitro studies (Sharkey et al. 1998, 1999) and computer models (Gefen, 2002; Cheung et al. 2006) have consistently shown that disruption of this structure can lead to substantial mechanical modifications, such as flattening of the longitudinal arch and increased pressure under the metatarsal heads. Moreover, significant modifications in the way that forces are transmitted to the ground, and a less ‘energetic’ walk in patients who underwent plantar fasciotomy, i.e. surgical release of the PA for intractable plantar fasciitis, have been reported (Daly et al. 1992). These studies suggest that the PA must have a crucial role in the mechanics of the longitudinal arch of the foot during walking, in enhancing both the shock-absorbing capacity of the longitudinal arch and the way that forces are transferred from rearfoot to forefoot, thus allowing for the smooth roll-over necessary for propulsion.
A recent study in our laboratory (Caravaggi et al. 2009) demonstrated that inverse kinematics can successfully be employed to estimate the temporal profile of PA tension during the stance phase of walking. The multisegment model in that study helped to assess reported relationships between kinematics of the metatarsophalangeal joints (MTPJs) (Carlson et al. 2000), and MTPJ geometry (Bojsen-Møller, 1979), on the effectiveness of the windlass mechanism of the foot (Hicks, 1954). It would now be of great interest to shed light on the relationship between MLA deformation and PA tension, as these two variables are associated with the windlass mechanism, whereby in late stance, consequent on dorsiflexion of the MTPJs, the arch of the foot is raised by tension produced in the PA.
As significant kinematic and dynamic adaptations occur in the lower limb when walking at different speeds (Murray et al. 1984; Kirtley et al. 1985), it is conceivable that PA tension/elongation could also be affected, as a consequence of the modified temporal profiles of reaction forces at the foot/ground interface that characterize the faster gaits. Accordingly, this study explores the biomechanical correlation of PA mechanics with the modifications occurring in foot dynamics at faster cadences, by employing the inverse kinematic model presented in Caravaggi et al. (2009) to measure PA elongation and MTPJ rotations, and by relating these phenomena to the main events of gait and to the deformation of the longitudinal arch during different loading conditions of the lower limb. Furthermore, in-vitro studies have shown that PA tension is correlated with tension in the Achilles’ tendon (Erdemir et al. 2004). However, it has been reported that, despite a faster rate of development of tension in the Achilles’ tendon with increased walking speed, the peak value of tension in the Achilles’ tendon during stance remains unaffected by walking speed (Finni et al. 1998). Therefore, in estimating how PA tension is affected by walking speed, this study aims to contribute to a better understanding of the relationship between PA and Achilles’ tendon tension particularly at faster gaits.
Materials and methods
The left feet of 10 subjects (age 29.3 ± 6.4 years, weight 73.8 ± 8.7 kg, height 1.79 ± 0.06 m) were instrumented with 12 reflective markers attached to the skin with double-sided adhesive tape (Fig. 1), following the protocol described in Caravaggi et al. (2009). A six-camera motion-capture system (ProReflex 1000 MCU; Qualysis, Gothenburg, Sweden) was employed to collect marker trajectories at the subjects’ (subjectively-determined) slow, normal and fast walking speeds; 10 repetitions for each walking speed were performed by each subject when walking over a wooden walkway with an inset forceplate (model 9281C; Kistler Instruments Ltd, Hook, Hampshire, UK). Ground reaction forces (GRFs) were recorded at 500 Hz and used to identify stance-phase timing. Foot-flat and heel-rise times were determined from the analysis of the vertical velocity (first derivative of the vertical displacements) of the two markers attached to the first metatarsal head and the posterior border of the calcaneus, respectively. Similar mean values for the heel-rise frame were computed by analysis of the vertical displacement of the calcaneus marker, and by establishing the heel-rise frame as that time at which the calcaneus marker was raised 10 mm off the ground. The 10-mm criterion was selected as compatible with the average strain of the plantar soft tissues during normal walking (Cavanagh, 1999; Gefen et al. 2001) applied to an average heel pad thickness of 16.6 mm (Gooding et al. 1985).
Fig. 1.
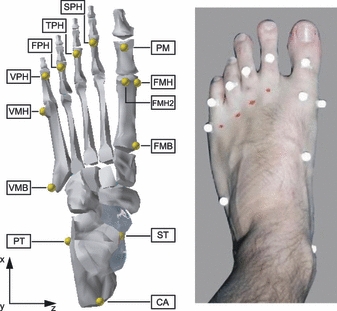
Left: rendering of the foot showing the location of the 12 markers employed to track the motion of the calcaneus, metatarsus and proximal phalanges of the toes in accordance with the protocol described in Caravaggi et al. (2009). Marker FMH2 is used for static calibration only. Right: the reflective markers applied on the bony landmarks of one of the subjects employed in the study. CA, upper central ridge of the calcaneus posterior surface; ST, the most medial apex of the sustentaculum tali; PT, lateral apex of the peroneal tubercle; VMB, base of the fifth metatarsal; VMH, dorso-lateral aspect of the head of the fifth metatarsal; FMB, base of the first metatarsal; FMH, dorso-medial aspect at the head of the first metatarsal; PM, the most distal and dorsal point of the head of the proximal phalanx of the hallux; SPH, TPH, FPH and VPH are the most distal and dorsal points of the proximal phalanges of toes two to five, respectively.
Angular deformation of the MLA was measured, following the method suggested in Leardini et al. (2007), by tracking the relative displacement of the three reflective markers placed over the posterior aspect of the calcaneus, sustentaculum tali and first metatarsal head (Fig. 2).
Fig. 2.
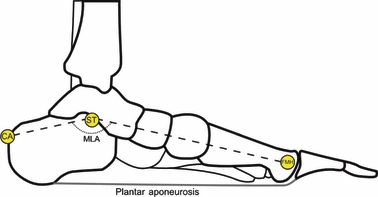
The location of the three markers employed to measure the deformation of the medial longitudinal arch (MLA). See Fig.1 for landmarks’ description.
The PA deformation and MTPJ dorsiflexion were measured following the protocol described in Caravaggi et al. (2009) by importing the trajectory data from three subjects (age 27 ± 7.8 years, weight 65.1 ± 7.2 kg, height 1.78 ± 0.15 m), randomly selected from the same 10-subject population, into a multisegment rigid-body model of the foot built in Adams (MSC.ADAMS Ver. 2005.2.0; MSC Software Corporation, Santa Ana, CA, USA). Each subject-specific model of the foot was comprised of the calcaneus, metatarsus and proximal phalanges of the five toes. The foot segments were dimensioned according to biometric data from each subject and sonography was employed to estimate the radii of the cylinders approximating the metatarsal heads. The PA was modelled as five elastic slips originating at the inferior border of the calcaneus and inserting at the base of the proximal phalanges of the five toes. Spherical contact elements were employed to allow each slip of the PA to wrap around the relative metatarsal head. It should be noted that the limited number of subjects employed for the inverse kinematic analysis was dictated by the complex methodology involved, described in detail in the aforementioned publication, and by the extended computational time required to process each walking trial for each subject.
Inverse kinematic analysis was run to determine the trajectories of PA tension and MTPJ rotations for each recorded trial. For each subject, MLA deformation, PA elongation and MTPJ rotations were computed relative to a neutral unloaded position of the foot (Caravaggi et al. 2009).
All of the subjects who volunteered in the study, which used protocols approved by the Research Ethics Committee of The University of Liverpool, had no history of major injuries or abnormalities to the lower limb.
Results
The intersubject mean (±SD) duty factors for the three walking speed groups were: 60.6% (0.7%), 59.0% (0.8%) and 57.5% (0.8%) for the slow, normal and fast walking speeds, respectively. The temporal profiles of the anterior–posterior and vertical GRFs at three walking speeds (Fig. 3) were in accordance with a previous study on a larger population (Nilsson & Thorstensson, 1989).
Fig. 3.
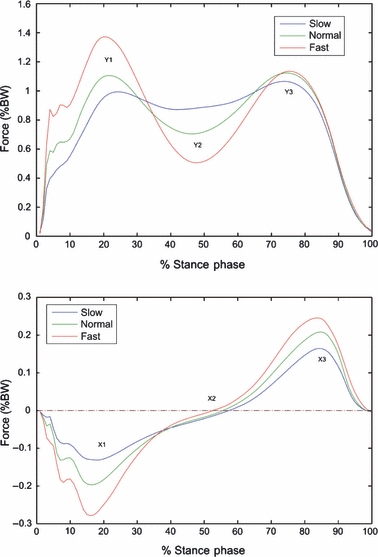
Intersubject mean temporal profiles of the vertical (top) and anterior–posterior component (bottom) of the ground reaction force at three walking speeds over 100 walking trials for each speed during normalized stance phase. BW, body weight.
The relative timing of both the stance phase duration of the heel-rise frame (∼61% for the slow-walking group; ∼50% for the fast-walking group; P < 0.001) and the positive onset of anterior–posterior GRF (∼57% in slow walking; ∼52% in fast walking; P < 0.001) decreased with walking speed. The maximum and minimum values of GRF trajectories and timings of main events of stance at three walking speeds are shown in Tables 1 and 2, respectively.
Table 1.
Means ± SD of minimum and maximum ground reaction force (GRF) during stance across 10 subjects and over 100 trials at three walking speeds.
| Slow | Normal | Fast | Trend | |
|---|---|---|---|---|
| Y1 (% BW) | 1.019 ± 0.066 | 1.122 ± 0.092 | 1.389 ± 0.131*,** | ↑ |
| Y2 (% BW) | 0.856 ± 0.057 | 0.696 ± 0.078 | 0.495 ± 0.102*,** | ↓ |
| Y3 (% BW) | 1.074 ± 0.059 | 1.133 ± 0.089 | 1.143 ± 0.111* | |
| X1 (% BW) | −0.143 ± 0.029 | −0.209 ± 0.051 | −0.292 ± 0.065*,** | ↓ |
| X3 (% BW) | 0.170 ± 0.023 | 0.213 ± 0.034 | 0.252 ± 0.046*,** | ↑ |
Y1 and Y3, first and second peak of the vertical GRF, respectively; Y2, minimum value plateau between Y1 and Y3; X1 and X3, first and second peak of the anterior–posterior GRF, respectively (see Fig. 3).
BW, body weight.
Statistically different between fast and slow speed groups at alpha = 0.05.
Statistically different between fast and normal speed groups at alpha = 0.05.
Table 2.
Means ± SD of times of the main events of ground reaction force (GRF) across 10 subjects and over 100 trials at three walking speeds.
| Slow | Normal | Fast | Trend | |
|---|---|---|---|---|
| ST (s) | 0.834 ± 0.097 | 0.652 ± 0.068 | 0.533 ± 0.046*,** | ↓ |
| TY1 (% ST) | 25.2 ± 7.6 | 21.5 ± 2.7 | 19.9 ± 2.6*,** | ↓ |
| TY2 (% ST) | 42.3 ± 7.3 | 46.0 ± 2.8 | 47.8 ± 2.5*,** | ↑ |
| TY3 (% ST) | 73.5 ± 2.5 | 74.7 ± 2.4 | 75.5 ± 1.8*,** | ↑ |
| TX1 (% ST) | 15.8 ± 4.8 | 13.7 ± 4.6 | 14.4 ± 3.3* | |
| TX2 (% ST) | 56.8 ± 4.0 | 55.1 ± 4.6 | 52.5 ± 5.2*,** | ↓ |
| TX3 (% ST) | 84.5 ± 1.9 | 85.1 ± 2.0 | 83.7 ± 2.8*,** | |
| TFF (% ST) | 19.6 ± 2.6 | 19.3 ± 2.1 | 19.6 ± 1.9 | = |
| THR (% ST) | 61.1 ± 4.3 | 58.8 ± 4.3 | 50.3 ± 3.9*,** | ↓ |
ST, stance phase duration; TY1 and TY3, times of the first and second peak of vertical GRF, respectively; TY2, time of plateau GRF between TY1 and TY3; TX1 and TX3, times of the first and second peak of anterior–posterior GRF, respectively; TX2, time of the start of propulsion (anterior–posterior GRF becomes positive); TFF, time of foot-flat; THR, time of heel-rise (see Fig. 3).
Statistically different between fast and slow speed groups at alpha = 0.05.
Statistically different between fast and normal speed groups at alpha = 0.05.
The intersubject mean walking speeds for the three subjects whose kinematic data were employed in the analysis of PA dynamics and MTPJ kinematics were: 1.07 ± 0.10 m s−1, 1.42 ± 0.15 m s−1 and 1.98 ± 0.11 m s−1 for slow, normal and fast walking speeds, respectively. At heel-strike the first MTPJ was more dorsiflexed for the fast-walking group, relative to the slow-walking group (P = 0.0181) (see Fig. 4). The second MTPJ showed a similar but less pronounced trend (P = 0.068). The toes started dorsiflexing at heel-rise, which occurred earlier for the fast-walking group, and reached maximum dorsiflexion during late stance. Late-stance maximum dorsiflexion increased at all MTPJs with faster gaits (e.g. at the first MTPJ, 52°±5° in slow walking; 64°±4° in fast walking; P < 0.001).
Fig. 4.

Top to bottom: intersubject mean temporal profiles (±1 SD) of the rotation angles at the five metatarsophalangeal joint (MTPJ) (MTPJ1 = medial; MTPJ5 = lateral) at three walking speeds over 15 trials for each speed during normalized stance phase.
The MLA deformation was characterized by an initial peak at heel-strike (Fig. 5). The mean arch deformation during early stance (1–30% of stance) increased with walking speed (0.1°±1.9° in slow walking; 0.9°±2.6° in fast walking; P = 0.037). For all walking groups the arch steadily deformed until late stance (∼80% of stance), the fast-walking group showing larger deformation of the arch until heel-rise (∼50% of stance). From mid-stance onwards the arch was more raised for the fast-walking group, and reached its maximum at toe-off (−4.6°±4.0° in slow walking; −5.7°±3.4° in fast walking; P = 0.019). The MLA showed a decreased range of motion from foot-flat to heel-rise with increasing walking speed (3.2°±1.5° in slow walking; 1.3°±1.0° in fast walking; P < 0.001).
Fig. 5.
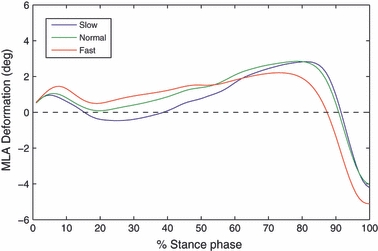
Intersubject mean temporal profiles of angular deformation of the medial arch at three walking speeds over 100 walking trials per speed group during normalized stance phase. Positive angles indicate drop of the medial longitudinal arch (MLA), whereas negative angles indicate raise of the MLA relative to a neutral unloaded position (see Fig. 2).
Early- to mid-stance tension in the PA increased with walking speed, whereas maximum PA tension during late stance (∼1.5 body weight) was steady across the three walking speeds (Fig. 6). For all walking speeds, the estimated strain – and therefore the tension – in the slips of the PA decreased from the most medial to the most lateral slip (Fig. 7), the most medial slips being most affected by increase of walking speed. The mean intersubject maximum strain at late stance in the five slips of the PA ranged from 2.9 to 4.6%, from the most lateral to the most medial slip.
Fig. 6.
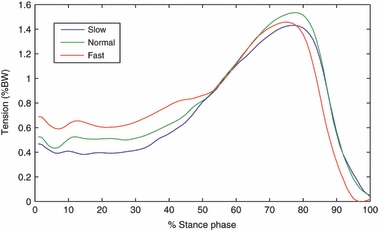
Intersubject mean temporal profiles of plantar aponeurosis tension at three walking speeds over 15 walking trials for each speed during normalized stance phase. BW, body weight.
Fig. 7.

Top to bottom: intersubject mean temporal profiles of strain [l/l0] in the five slips of the plantar aponeurosis (PA) (PA1 = medial; PA5 = lateral) at three walking speeds over 15 walking trials for each speed during normalized stance phase.
Discussion
Stereophotogrammetry and an inverse kinematic model of the windlass mechanism were employed to investigate the effects of walking speed on the mechanics of the longitudinal arch. Analysis of the time-histories of rotations at the five MTPJs, tension in the PA and deformation of the MLA helped to improve understanding of the role of the PA when the foot is subjected to walking-speed-related dynamic modifications.
In accordance with previous studies, faster gaits were accompanied by shorter stance durations and larger peaks of GRF. The time of heel-rise and of the positive onset of anterior–posterior GRF decreased with walking speed.
Our major findings are discussed below in sequence.
1 Early-stance dorsiflexion at the two most medial MTPJs increased with walking speed. This is the likely consequence of a more powerful, speed-related action of the toe dorsiflexors, as can be inferred from works by Neptune & Sasaki (2005) and Hof et al. (2002) on the onset of activation of the main muscles of the lower limb in relation to walking speed.
2 Late-stance dorsiflexion at the five MTPJs increased with walking speed. This appears to be consistent with the joint-kinematic adaptations to faster gaits achieved by increasing stride lengths and cadence (Grieve & Gear, 1966), thus necessitating greater flexion at the hip and ankle joints. Indeed, greater plantarflexion at the ankle must be accompanied by greater dorsiflexion at the MTPJ, to allow the swing leg to reach further away from the stance leg.
As already highlighted in the previous section, the PA is pre-loaded at heel-strike and the amount of tension increases with walking speed. It has been suggested that a possible functional advantage for PA pre-loading is in reducing the crimp present in the unloaded collagenous tissue of the PA (Caravaggi et al. 2009) and/or in taking up the slack in the aponeurosis before the midfoot hits the ground.
3 However, novel to this study, the quantitative evaluation of PA tension in relation to walking speed further suggests the existence of some type of intrinsic mechanism to tune/adjust the stiffness of the arch in order to better absorb the higher GRF that the foot must sustain when walking at faster cadences. The combination of the pulling action of the Achilles’ tendon, the tension of which at heel-strike is associated with the action of the antagonist tibialis anterior muscle (Finni et al. 1998), acting to plantarflex the rearfoot, and the action of the toe and ankle dorsiflexors (Fig. 8) works in synergy to pre-load the PA. These muscles are all active prior to, and during, heel-strike and their magnitude of activity increases with walking speed. From the studies on cadaveric feet of Carlson et al. (2000) we can infer that similar PA tension to that computed by our model at heel-strike for the normal walking group (0.47 body weight) would be created by 30° of toe dorsiflexion combined with 250 N tension in the Achilles’ tendon. A similar tension in the Achilles’ tendon was indeed recorded at heel-strike by Finni et al. (1998).
Fig. 8.
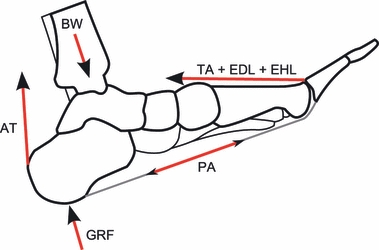
The main internal and external forces acting on the longitudinal arch of the foot at heel-strike. GRF, ground reaction forces; BW, body weight; PA, tension in the plantar aponeurosis; AT, tension in the Achilles’ tendon; EDL and EHL, forces exerted by the extensor digitorum longus muscle and extensor hallucis longus muscle, respectively; TA, tibialis anterior force.
If this mechanism has been correctly identified, it further highlights the role of the muscles of the anterior compartment of the leg (tibialis anterior, extensor hallucis longus and extensor digitorum longus) in bringing about early-stance pre-loading of the PA. The effect of these muscles on PA tension can be summarized as follows: in the rearfoot, the increase of ankle dorsiflexion with walking speed (Murray et al. 1984) stretches the triceps surae muscle/tendon complex thus increasing tension in the Achilles’ tendon (Finni et al. 1998) and helping to stabilize the calcaneus prior to heel-strike, whereas, in the forefoot, increase of toe dorsiflexion with walking speed, as demonstrated in this study for the most medial MTPJs at least, exerts direct pull on the slips of the PA through the windlass mechanism (Fig. 8). It is therefore evident that the increase of muscular activity with increasing walking speed (Hof et al. 2002; Neptune & Sasaki, 2005) acts to augment pre-loading of the PA, which latter pre-loading, in turn, affects the sagittal-plane stance-phase compliance of the foot.
4 Analysis of the range of motion of the MLA during the interval when the foot is fully in contact with the ground (foot-flat to heel-rise) revealed decreased motion of the arch with increasing walking speed. The inference of a mechanism for stiffening of the arch at faster gaits finds validation in a previous pedobarographic study that showed significant decrease of pressure under the midfoot and increase of pressure under the rearfoot and forefoot when walking at increasing speed (Pataky et al. 2008). From the broader perspective of dynamics of gait, a stiffer (less compliant) arch could serve a prompter transfer of forces from rearfoot to forefoot, thus enhancing the propulsive forces available for faster gaits.
As highlighted above, the faster gaits were characterized by a significant increase of early-stance vertical GRF. The PA, and undoubtedly all of the other passive ligamentous structures spanning the longitudinal arch and midtarsal joint – such as the spring ligament and long plantar ligament, must be stretched more to cope with the larger vertical loads applied on the foot at increasing speed.
5 Accordingly, during early- to mid-stance, the MLA underwent a larger fall with increasing walking speed. The analysis of the temporal profiles of MLA deformation (Fig. 5) reveals, however, that, from around mid-stance, the dynamics of the longitudinal arch undergo a substantial modification, the arch appearing more raised during fast walking. However, although the MLA appears more raised in fast walking, maximum tension in the PA remains almost unaffected by walking speed during late stance. This seems further to confirm a correlation of PA tension with tension in the Achilles’ tendon (Erdemir et al. 2004), and suggests that such a correlation may also exist in faster cadences. In fact, as reported by Finni et al. (1998), late-stance maximum tension in the Achilles’ tendon is also unaffected by walking speed.
After push-off, when the forefoot begins to be unloaded and the contralateral foot is hitting the ground, the arch starts rising very quickly, and this becomes even more marked at faster speeds. If PA tension drops to zero at toe-off, it appears unlikely that, alone, it could support the longitudinal arch in late stance. We therefore conclude that the most likely source of late-stance arch raising (Fig. 4) is the intrinsic plantar muscles, supported by the extrinsic arch-supporting muscles, e.g. the tibialis posterior m. (Thordarson et al. 1995). Mann & Inman (1964) stated that the plantar muscles, active as a functional unit from mid-stance to toe-off during level walking, play the principal active role in the stabilization of the foot during propulsion. These results support those early studies (Morton, 1930; Wood Jones, 1949; Basmajian & Stecko, 1963) that first speculated about an active contribution of muscles in sustaining the arch only when high transient forces are applied to the foot – such as those occurring at push-off. Muscular action would then be responsible for the increase of arch augmentation in late stance that occurs at faster speed if, as has already been demonstrated for the extrinsic muscles of the foot (Hof et al. 2002; Neptune & Sasaki, 2005), the muscular activity of the plantar muscles was also found to increase with walking speed. Regrettably, the pattern of speed dependence of muscular force exerted by the intrinsic muscles can only be inferred by the present investigation, and remains to be experimentally confirmed.
Concluding remarks
Kinematic and kinetic modifications occur in the lower limb at increasing walking speeds. Although the estimated magnitude of PA tension/elongation could be biased by the simplifications made in this study with respect to the limited number of subjects and model geometry, the results presented herein help to expand current knowledge of the functions of the PA in relation to the dynamics of the MLA at different walking speeds. Further, our findings simultaneously highlight the active role of the muscles in the anterior compartment of the leg in adjusting the tension in the PA, thus modifying the pre-heel-strike compliance of the longitudinal arch.
Acknowledgments
The authors would like to thank the Anatomical Society of Great Britain and Ireland for the Studentship award under which this research was performed. Further support was provided by grants from The Leverhulme Trust and The Natural Environment Research Council.
Appendix
Medial longitudinal arch angle: error analysis
It should be recalled that relative motion between skin and underlying bone [i.e. skin movement artefact (SMA)] can be considered the main source of error when evaluating segment kinematics by tracking the motion of skin-mounted markers.
Therefore, for each subject, 1000 normally distributed random SMA values were generated for each marker (calcaneus, sustentaculum tali and first metatarsal head; see Fig. 2), with mean and SD taken from Tranberg & Karlsson (1998), to simulate the influence of SMA on MLA angle. Deviations in MLA angle were computed according to Leardini et al. (2007). The average error (as quantified by SD) in MLA angle across the 10 subjects was ± 2.3°. This error is most likely to affect the measurement of MLA angle mainly during early and late stance, when foot joint rotations are largest with respect to the neutral posture. Although this is unlikely to qualitatively affect the current MLA results, the data presented in Fig. 5 should be considered with reference to the limitations of the measuring technique.
References
- Basmajian JV, Stecko G. The role of muscles in arch support of the foot: an electromyographic study. J Bone Joint Surg Am. 1963;45:1184–1190. [PubMed] [Google Scholar]
- Bojsen-Møller F. Calcaneocuboid joint and stability of the longitudinal arch of the foot at high and low gear push off. J Anat. 1979;129:165–176. [PMC free article] [PubMed] [Google Scholar]
- Caravaggi P, Pataky T, Goulermas JY, et al. A dynamic model of the windlass mechanism of the foot: evidence for early stance phase preloading of the plantar aponeurosis. J Exp Biol. 2009;212:2491–2499. doi: 10.1242/jeb.025767. [DOI] [PubMed] [Google Scholar]
- Carlson RE, Fleming LL, Hutton WC. The biomechanical relationship between the tendoachilles, plantar fascia and metatarsophalangeal joint dorsiflexion angle. Foot Ankle Int. 2000;21:18–25. doi: 10.1177/107110070002100104. [DOI] [PubMed] [Google Scholar]
- Cavanagh PR. Plantar soft tissue thickness during ground contact in walking. J Biomech. 1999;32:623–628. doi: 10.1016/s0021-9290(99)00028-7. [DOI] [PubMed] [Google Scholar]
- Cheung JT, An KN, Zhang M. Consequences of partial and total plantar fascia release: a finite element study. Foot Ankle Int. 2006;27:125–132. doi: 10.1177/107110070602700210. [DOI] [PubMed] [Google Scholar]
- Daly PJ, Kitaoka HB, Chao EY. Plantar fasciotomy for intractable plantar fasciitis: clinical results and biomechanical evaluation. Foot Ankle. 1992;13:188–195. doi: 10.1177/107110079201300404. [DOI] [PubMed] [Google Scholar]
- Erdemir A, Hamel AJ, Fauth AR, et al. Dynamic loading of the plantar aponeurosis in walking. J Bone Joint Surg Am. 2004;86-A:546–552. doi: 10.2106/00004623-200403000-00013. [DOI] [PubMed] [Google Scholar]
- Finni T, Komi PV, Lukkariniemi J. Achilles tendon loading during walking: application of a novel optic fiber technique. Eur J Appl Physiol Occup Physiol. 1998;77:289–291. doi: 10.1007/s004210050335. [DOI] [PubMed] [Google Scholar]
- Gefen A. Stress analysis of the standing foot following surgical plantar fascia release. J Biomech. 2002;35:629–637. doi: 10.1016/s0021-9290(01)00242-1. [DOI] [PubMed] [Google Scholar]
- Gefen A, Megido-Ravid M, Itzchak Y. In vivo biomechanical behavior of the human heel pad during the stance phase of gait. J Biomech. 2001;34:1661–1665. doi: 10.1016/s0021-9290(01)00143-9. [DOI] [PubMed] [Google Scholar]
- Gooding GA, Stress RM, Graf PM, et al. Heel pad thickness: determination by high-resolution ultrasonography. J Ultrasound Med. 1985;4:173–174. doi: 10.7863/jum.1985.4.4.173. [DOI] [PubMed] [Google Scholar]
- Grieve DW, Gear RJ. The relationships between length of stride, step frequency, time of swing and speed of walking for children and adults. Ergonomics. 1966;9:379–399. doi: 10.1080/00140136608964399. [DOI] [PubMed] [Google Scholar]
- Hicks JH. The mechanics of the foot. II. The plantar aponeurosis and the arch. J Anat. 1954;88:25–30. [PMC free article] [PubMed] [Google Scholar]
- Hof AL, Elzinga H, Grimmius W, et al. Speed dependence of averaged EMG profiles in walking. Gait Posture. 2002;16:78–86. doi: 10.1016/s0966-6362(01)00206-5. [DOI] [PubMed] [Google Scholar]
- Ker RF, Bennett MB, Bibby SR, et al. The spring in the arch of the human foot. Nature. 1987;325:147–149. doi: 10.1038/325147a0. [DOI] [PubMed] [Google Scholar]
- Kirtley C, Whittle MW, Jefferson RJ. Influence of walking speed on gait parameters. J Biomed Eng. 1985;7:282–288. doi: 10.1016/0141-5425(85)90055-x. [DOI] [PubMed] [Google Scholar]
- Leardini A, Benedetti MG, Berti L, et al. Rear-foot, mid-foot and fore-foot motion during the stance phase of gait. Gait Posture. 2007;25:453–462. doi: 10.1016/j.gaitpost.2006.05.017. [DOI] [PubMed] [Google Scholar]
- Mann R, Inman VT. Phasic activity of intrinsic muscles of the foot. J Bone Joint Surg. 1964;46:469–481. [PubMed] [Google Scholar]
- Morton DJ. Structural factors in static disorders of the foot. Am J Surg. 1930;9:315–328. [Google Scholar]
- Murray MP, Mollinger LA, Gardner GM, et al. Kinematic and EMG patterns during slow, free, and fast walking. J Orthop Res. 1984;2:272–280. doi: 10.1002/jor.1100020309. [DOI] [PubMed] [Google Scholar]
- Neptune RR, Sasaki K. Ankle plantar flexor force production is an important determinant of the preferred walk-to-run transition speed. J Exp Biol. 2005;208:799–808. doi: 10.1242/jeb.01435. [DOI] [PubMed] [Google Scholar]
- Nilsson J, Thorstensson A. Ground reaction forces at different speeds of human walking and running. Acta Physiol Scand. 1989;136:217–227. doi: 10.1111/j.1748-1716.1989.tb08655.x. [DOI] [PubMed] [Google Scholar]
- Pataky TC, Caravaggi P, Savage R, et al. New insights into the plantar pressure correlates of walking speed using pedobarographic statistical parametric mapping (pSPM) J Biomech. 2008;41:1987–1994. doi: 10.1016/j.jbiomech.2008.03.034. [DOI] [PubMed] [Google Scholar]
- Sharkey NA, Ferris L, Donahue SW. Biomechanical consequences of plantar fascial release or rupture during gait: part I – disruptions in longitudinal arch conformation. Foot Ankle Int. 1998;19:812–820. doi: 10.1177/107110079801901204. [DOI] [PubMed] [Google Scholar]
- Sharkey NA, Donahue SW, Ferris L. Biomechanical consequences of plantar fascial release or rupture during gait. Part II: alterations in forefoot loading. Foot Ankle Int. 1999;20:86–96. doi: 10.1177/107110079902000204. [DOI] [PubMed] [Google Scholar]
- Thordarson DB, Schmotzer H, Chon J, et al. Dynamic support of the human longitudinal arch. A biomechanical evaluation. Clin Orthop Relat Res. 1995;316:165–172. [PubMed] [Google Scholar]
- Tranberg R, Karlsson D. The relative skin movement of the foot: a 2-D roentgen photogrammetry study. Clin Biomech (Bristol, Avon) 1998;13:71–76. doi: 10.1016/s0268-0033(97)00052-1. [DOI] [PubMed] [Google Scholar]
- Wood Jones FW. Structure and Function as Seen in the Foot. London: Bailliere, Tindall and Cox; 1949. pp. 246–265. [Google Scholar]


