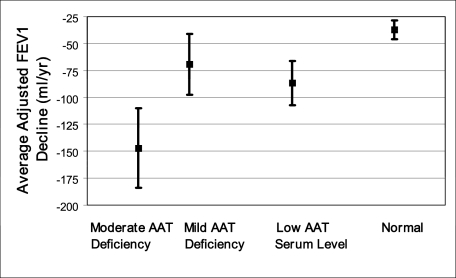
Figure 3.
Magnitude of average adjusted FEV1 decline rates post-September 11, 2001, for the two AAT deficiency combinations and for low serum AAT levels. Normal aging-related decline rates for the cohort provide a clinically meaningful comparison. Decline rate magnitudes due to AAT deficiency and aging and SEs are shown. AAT-related accelerations in decline rate equaled nearly triple the cohort’s adjusted aging-related decline rate for FDNY workers with moderate AAT deficiency and almost equaled the cohort’s adjusted aging-related decline rate for workers with mild AAT deficiency (P = .011), with a statistically significant trend for decline rate acceleration by AAT phenotype combination deficiency category (P = .003). In addition, AAT-related accelerations in decline rate for low AAT serum levels exceeded the cohort’s yearly adjusted aging-related decline rate (P = .027). The rightmost data point represents the FEV1 decline rate due to aging alone, which study participants with normal AAT phenotypes experienced because they did not experience any additional decline rate acceleration due to AAT deficiency. Decline rates for a white male never-smoking FDNY firefighter with high WTC exposure of mean age and height and with median FDNY tenure length are depicted. Moderate AAT deficiency was defined as PiZ heterozygosity (n = 4), and mild AAT deficiency was defined as PiS homozygosity or PiS heterozygosity without concomitant PiZ heterozygosity (n = 7). Low serum AAT level was defined as ≤ 20 μmol/L. Decline rates were adjusted for sex, race, age, height, ex-smoking status, work assignment on September 11, 2001, length of FDNY tenure, WTC exposure intensity, and the interaction of smoking with AAT deficiency. See Figure 1 and 2 legends for expansion of abbreviations.

