Abstract
G-protein–coupled receptors (GPCRs) are the largest protein superfamily in the human genome; they comprise 30% of current drug targets and regulate diverse cellular signaling responses. The role of endosomal trafficking in GPCR signaling regulation is gaining substantial consideration. However, this process remains difficult to study due to the inability to distinguish among many individual receptors, simultaneously trafficking within multiple endosomal pathways. Here we show accurate measurement of the internalization and endosomal trafficking of single groups of serotonin (5-hydroxytryptamine, 5-HT) receptors using single quantum dot (QD) probes and quantitative colocalization. We demonstrate that the presence of a QD tag does not interfere with 5-HT receptor internalization or endosomal recycling. Direct measurements show simultaneous trafficking of the 5-HT1A receptor in two distinct endosomal recycling pathways. Single-molecule imaging of endosomal trafficking will significantly impact the understanding of cellular signaling and provide powerful tools to elucidate the actions of GPCR-targeted therapeutics.
Keywords: serotonin, single-molecule imaging, endocytosis, nanoparticle, endosome
Following ligand activation, G-protein–coupled receptors (GPCRs) are internalized and trafficked within a series of endosomal compartments that determine the fate of receptors. Receptors may traffic through many different endosomal pathways, including recycling to the plasma membrane for further rounds of ligand activation or trafficking toward lysosomes for degradation. In view of the growing awareness of the role of endosomal trafficking in cellular signaling (1–3), technologies capable of following single or small groups of receptors through progressive stages of this trafficking would provide valuable insight into the overall regulation of receptor signaling.
In recent years the development of quantum dot (QD) technologies has advanced understanding of receptor signaling at the extracellular plasma membrane surface (4–7). As yet, the value of single QD technologies to study receptor regulation inside cells is uncertain (8). Although QD-bound receptors have been found to be transported within endosomes, the specific trafficking pathways remain uncharacterized (5). In addition, it is not known if the presence of a relatively bulky QD tag bound to a receptor may interfere with receptor internalization and/or endosomal trafficking (8). Consequently, the potentially powerful value of QD technology to access mechanisms of endosomal trafficking in receptor regulation, at the level of single molecules, remains untapped.
GPCRs are the largest family of cell-surface receptors and a major therapeutic target (9). Understanding the endocytic trafficking of GPCRs is critical in understanding overall GPCR signaling regulation (1–3). However, prior endocytic trafficking studies of GPCRs have been largely limited by hurdles in observing individual GPCRs inside cells. For example, most serotonin receptors (5-hydroxytryptamine receptors, 5-HTRs) are GPCRs that regulate major signaling pathways associated with anxiety and depression disorders. However, the identification of endocytic 5-HTR trafficking pathways and their relation to overall 5-HT signal modulation remain unclear (10, 11). Single-molecule techniques that would allow investigators to dissect the endosomal trafficking of discrete GPCRs would prove invaluable to understanding the signaling actions of GPCR-targeted therapeutics (e.g., antidepressants, experimental analgesics, cancer treatments, etc.).
Here, we describe the use of QDs to investigate receptor regulation within cells. We generated a QD probe to target serotonin receptor subtype 1A, using a hemagglutinin (HA)-targeting epitope (HA-5-HT1A). We provide concrete evidence showing that QDs do not provoke artifactual receptor internalization; moreover, the internalization and trafficking of single or small groups of 5-HTRs tagged with QDs can be sensitively monitored along specific endosomal pathways without deviation from that of untagged 5-HTRs. Using single QD imaging of 5-HTRs, we show detailed kinetic information obtained from the trafficking of discrete receptors along two distinct recycling pathways. QD monitoring of receptor regulation inside cells is a powerful technology that adds to the existing armamentarium available to understand cellular phenomena at the molecular scale.
Results
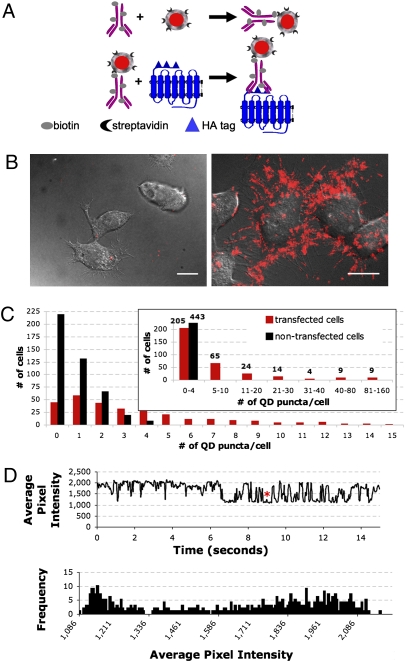
We generated a QD probe by conjugating a biotinylated anti-HA antibody to streptavidin-QD655 at a 1:1 stoichiometic ratio (Fig. 1A, Upper). This anti–HA-QD probe can be used to target any HA-tagged protein; for these studies we used HA-tagged 5-HT1A receptors (Fig. 1A, Lower). The QD probe exhibited high binding specificity toward HA-5-HT1A in transfected vs. untransfected N2a cells (Fig. 1B). Quantitation of the total number of QD puncta associated with whole, individual cells (Materials and Methods) showed that, as expected, a broad range of HA-5-HT1A expression was observed in transiently transfected cells (62, 8, and 3% of cells possessed 0–4, 20–80, and 81–160 fluorescent QD puncta per cell, respectively (Fig. 1C, red bars). In contrast, there was extremely low QD binding in nontransfected cells—on average, <1 QD punctum per cell (Fig. 1C, black bars). This high specificity of our QD probe toward HA-5-HT1A receptors overcomes the lack of available high-affinity antibodies targeting native extracellular epitopes of serotonin receptors (and other GPCRs) and ensures that QD puncta accurately denote the presence of a HA-5-HT1A receptor.
Fig. 1.
Characterization of the QD-serotonin receptor probe. (A) (Upper) Composite anti–HA-QD probes were formed by combining equimolar amounts of biotinylated anti-HA antibody and streptavidin-conjugated QD655. (Lower) Anti–HA-QD probes were then used to label HA-tagged 5-HT1A receptors. (B) Images of QD probe binding on nontransfected N2a cells (Left) vs. HA-5-HT1A–transfected N2a cells (Right) (probe concentration = 250 pM). Images are a maximum projection of a z-stack. (Scale bar, 10 μm.) (C) A quantitative assay of specific QD probe binding on nontransfected N2a cells (black bars, n = 443) and transiently transfected N2a cells (red bars, n = 330). A broad range of HA-5-HT1A expression levels is expected in transient transfection schemes. (D) Fluorescent blinking profiles of a QD-5-HT1A probe in a transfected fixed N2a cell (n = 125). (Upper) An exemplary square-wave on–off trace (asterisk marks one square wave). (Lower) A bimodal distribution of emission intensity. The first population (intensity values 1,086–1,336) represents the QD Off state. The second population (intensity values 1,386–2,186) represents the QD On state.
Our QD probe, as bound to HA-5-HT1A receptors, exhibited single or very low QD valency. Observation of QD blinking, one indication of QD monovalency (4, 5), suggested that 100% of QD puncta were single QDs (n = 125). Using the strict criterion that QD blinking exhibits clear square-wave on–off states (Fig. 1D, Upper) and a bimodal intensity histogram with no overlap between on and off states (12), (Fig. 1D, Lower), we confirmed that 30% of QD puncta contained single QDs and 60% were composed of single or no more than a few QDs. Given the 1-antibody:1-QD stoichiometric formation of the anti–HA-QD probes and steric constraints between the QD (∼11–14 nm hydrodynamic radius; Invitrogen) and the anti-HA antibody (∼5.5 nm hydrodynamic radius) (13), we would expect, on average, that QD probes will bear 1 antibody. However, there will exist a range of QD probes that will bear up to a few antibodies, as dictated by Poisson statistics. Furthermore, it is theoretically possible that the bivalency of the anti-HA IgG may allow the binding of two receptors to one antibody; the likelihood of this intramolecular bridging largely depends on the distance between two HA-5-HT1A receptors, as situated in the plasma membrane, and has yet to be explicitly measured. Given these considerations, we expect the number of receptors bound to a single QD probe to be likely one or a small group of HA-5-HT1A receptors.
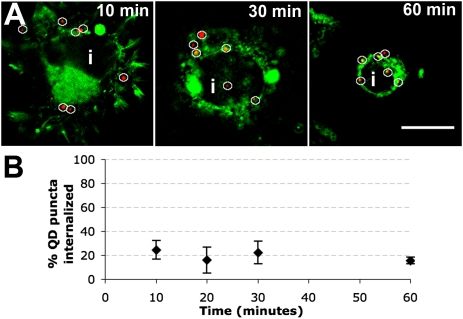
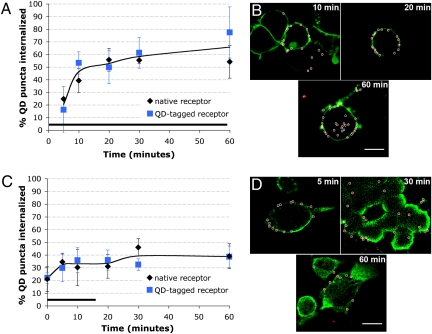
Receptor internalization represents the first step in removing receptors from the plasma membrane, which we aimed to monitor at the level of a single group of QD-tagged receptors. First, we verified that QD probes did not provoke artifactual receptor internalization. QD probes were added to transfected cells and the internalization of individual QD puncta was measured over the course of 1 h (Materials and Methods and Fig. S1). This assay showed that, in the absence of 5-HT stimulation, cells exhibited a baseline level of 20% receptor internalization over the course of 1 h, which is likely constitutive (Fig. 2 A and B). Fig. S2 depicts data on the number of replicates used in this assay. To characterize ligand-stimulated receptor internalization, we performed two parallel experiments: In “QD-tagged receptor” experiments, HA-5-HT1A receptors were first tagged with the QD probe and then subjected to 5-HT stimulation, requiring the receptor to undergo internalization with the QD bound. In “native receptor” experiments, unlabeled receptors were subjected to 5-HT stimulation, where they were permitted to internalize and traffic without a bound QD probe, and then labeled with QDs after fixation and permeabilization. Assays quantitating the internalization of individual QD puncta with time successfully captured the internalization kinetics (Fig. 3). In QD-tagged receptor experiments, sustained 5-HT exposure elicited receptor internalization that increased from 20 to ∼60–70% within 60 min (Fig. 3A, blue), indicating sustained receptor internalization in response to continuous 5-HT stimulation. The sensitivity capability of this assay to capture the kinetics of single or a small group of receptors is evident in the small number of cells represented by each data point (<20, Fig. S3). Native receptor experiments (Fig. 3A, black) showed a similar trend to QD-tagged receptor experiments, (Fig. 3A, blue), suggesting that QD probes do not interfere with the internalization kinetics of receptors in live cells. These data show that receptor internalization can be sensitively monitored at the level of single or a small group of QD-tagged receptors without interference in internalization kinetics.
Fig. 2.
Internalization of QD-HA-5-HT1A in the absence of 5-HT stimulation over time. (A) Images showing the subcellular location of QD-labeled HA-5-HT1A in transfected N2a cells at progressive time points after QD probes were introduced. Red, QD probe; green, DiO, membrane dye; i, cellular interior. Images depict one slice of a z-stack. (Scale bar, 10 μm.) (B) Plot of the cellular internalization of QD puncta with time in the absence of 5-HT. Data are presented as mean ± SD.
Fig. 3.
Kinetics of ligand-induced receptor internalization monitored by single groups of QD-tagged 5-HT1A receptors. (A) Plot of internalized QD puncta as a function of time during continuous 5-HT stimulation of transfected N2a cells. Data are presented as mean ± SD. Bar represents duration of 5-HT stimulation. (B) Images depicting cellular internalization of QD probe during continuous 5-HT activation. HA-5-HT1A receptors were either prelabeled with QDs before 5-HT treatment (“QD-tagged receptor” experiment) or postlabeled with QDs after fixation and permeabilization (“native receptor” experiment). A representative QD-tagged receptor experiment is shown. Red, QD probe; green, plasma membrane, visualized with DiO. Images represent one slice in a z-stack. (Scale bar, 10 μm.) (C) Plot of the cellular internalization of QD puncta during and after a 15-min pulse of 5-HT. Data are presented as mean ± SD. Horizontal black bar represents the duration of the 5-HT activation. (D) Images depicting cellular internalization of QD probe with 15-min stimulation of 5-HT. A representative native receptor experiment is shown. Red, QD probe; green, plasma membrane, labeled via immunocytochemistry with α-pan-cadherin. Images represent one slice in a z-stack. (Scale bar, 10 μm.) Fig. S3 displays statistical information for the data in A and C.
GPCR-mediated cell signaling likely involves more subtle changes in receptor internalization that are evoked by pulsatile, rather than sustained, 5-HT stimulation. We found that the kinetics of GPCR internalization could also be monitored with 15-min 5-HT stimulation by counting single or small groups of internalized QD-tagged receptors. In response to this pulsatile stimulation, both QD-tagged and native receptor experiments showed an increase in receptor internalization of ∼33%, by 20 min, which plateaued to ∼40% (Fig. 3C). These experiments sensitively measure the arrest of receptor internalization after removal of 5-HT and further demonstrate the sensitive capability of the QD probe to detect subtle changes in receptor internalization at the resolution of single or a small group of receptors, in a small number of cells (<20, Fig. S3). Similarity between the internalization kinetics of QD-tagged and native receptors further suggests that QD probes can be used to monitor subtle changes in receptor internalization, in live cells, without producing artifacts.
GPCRs and other receptors are typically routed through one of many endosomal pathways, and the identity and trafficking kinetics of these pathways are crucial in understanding receptor regulation. We harnessed the sensitive detection capability of QDs to identify endosomes containing single or a small group of receptors (rather than only endosomes containing many receptors, as typically detected with traditional fluorophores). Using quantitative colocalization with endosomal pathway markers (Manders’ coefficient, Materials and Methods) (14), this single-molecule detection method may allow us to more precisely access the processes of GPCR trafficking in specific endosomal pathways.
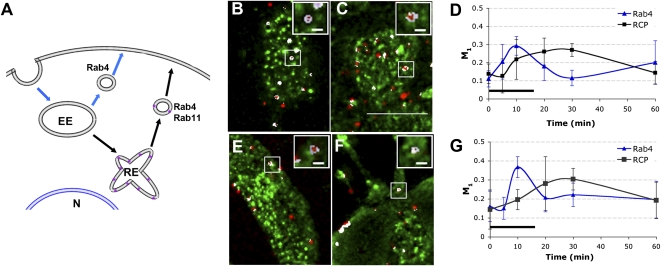
The recycling pathways that 5-HT1A receptors engage in have not been identified. We used our QD probe to monitor the recycling of 5-HT1A receptors in two endosomal pathways generally associated with GPCR recycling: (i) a “short” recycling pathway (Fig. 4A, blue arrows), in which GPCRs are transported to early endosomes and then recycle directly back to the plasma membrane, within Rab4-positive endosomes, and (ii) a “long” recycling pathway (Fig. 4A, black arrows), in which GPCRs are transported from early endosomes to an intermediate perinuclear recycling endosome and then back to the plasma membrane in a separate endosome positive for Rab4 and Rab11 (15, 16). To dissect the kinetics of 5-HT1A recycling pathways, we measured the colocalization of QD-labeled receptors with Rab4 endosomes to mark the short recycling pathway (17, 18) and with Rab-coupling protein (RCP), which predominately localizes to perinuclear recycling endosomes, to mark the long recycling pathway (19) (Fig. 4A, purple asterisks). We found that not only do 5-HT1A receptors colocalize with both Rab4 and RCP (Fig. 4 B and C), but also single or small groups of 5-HT1A receptors could be spatially resolved within enclosed Rab4- or RCP-positive endosomes (Fig. 4 B and C, Inset).
Fig. 4.
Trafficking of single groups of 5-HT1A receptors in distinct endosomal pathways measured by QDs. (A) The current model of GPCR recycling includes a short (blue arrows) and a long (black arrows) recycling pathway. Rab4 marks the recyling short pathway; Rab-coupling protein (RCP), which mainly localizes to recycling endosomes (purple), marks the long recycling pathway. EE, early endosomes; N, nucleus; RE, recycling endosome. (B and C) Native receptor recycling (receptors recycle without bound QDs): colocalization between QDs (red) and Rab4 or RCP (green). (B) Rab4 and QD at 10 min. (C) RCP and QD at 30 min. (D) Colocalization between QDs and Rab4 or RCP was quantified using Manders’ coefficient (M1: red pixels overlapping green). Horizontal black bar indicates the duration of 5-HT stimulation. Data are presented as mean ± SD; n = 3–5 image stacks. (E and F) QD-tagged receptor recycling (receptors recycle while bound to QDs): colocalization between QDs (red) and Rab4 or RCP (green). (E) Rab4 and QDs after 10 min. (F) RCP and QDs after 30 min. (G) Colocalization between QDs and Rab4 or RCP was analyzed as described in D. All images are a maximum projection of a z-stack. Insets are 3D projections of boxed QD puncta. White pixels indicate colocalization. (Scale bars: 10 μm in larger images and 1 μm in Insets.)
Further experiments were performed to quantitatively determine the kinetics of these recycling pathways. In QD-tagged receptor experiments, 5-HT1A receptors quickly move through the short recycling pathway, as indicated by their association with Rab4, beginning shortly after introduction of 5-HT and completed within 20 min (Fig. 4D, blue line). These kinetics are consistent with the recycling kinetics of other receptor types trafficked through this pathway (15, 16). 5-HT1A receptors also engage in a long recycling pathway; however, they move through this pathway more slowly, consistent with the kinetics of other receptor types trafficked through this pathway (18). Although 5-HT1A colocalization with RCP was observed during agonist stimulation, peak colocalization did not occur until after 5-HT was removed (Fig. 4D, black line). Parallel native receptor experiments (Fig. 4 E and F) showed that naked 5-HT1A receptors trafficked through both short (blue line) and long (black line) recycling pathways, notably with similar kinetics to QD-tagged receptors (Fig. 4 D and G). These results indicate that the bright, single-molecule detection capability of QD probes can be used to accurately follow the kinetics of single or small groups of GPCRs through complex endosomal recycling pathways composed of multiple endosomes.
The biological accuracy of QD probes to access the kinetics of recycling pathways is further demonstrated by the observation that 5-HT1A receptors traffic out of perinuclear recycling endosomes within 60 min (colocalization with RCP decreased between 30 and 60 min, Fig. 4D) but they do not reappear at the plasma membrane within 60 min (Fig. 3C). This observation corroborates previously published mechanisms by which receptors continue to traffic toward the plasma membrane in a Rab4- and Rab11-positive endosome after leaving the perinuclear recycling endosomes (16, 20) (Fig. 4A). Trafficking in these Rab4/Rab11-positive vesicles may result in the extended time to reach the plasma membrane. Because these experiments were performed with native 5-HT1A receptors (permitted to traffic without the QD bound), this extended trafficking could not be due to artifacts induced by the presence of the QD.
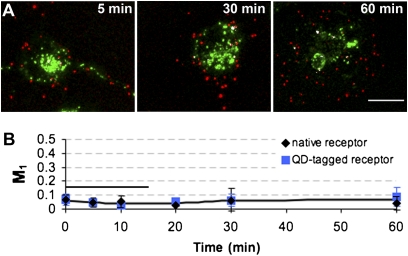
Lysosomal trafficking is complementary to that of recycling pathways, decreasing the available pool of receptors at the plasma membrane and attenuating overall signaling. Similar quantitative colocalization experiments examining lysosomal trafficking revealed that 5-HT1A receptors were not trafficked into lysosomes with pulsatile 5-HT stimulation. QD-tagged receptor and native receptor colocalization experiments with the LAMP1 lysosomal marker (Fig. 5A) revealed very low Manders’ coefficient values of <0.1 (Fig. 5B). The biological value of these experiments is demonstrated by the observation that, with pulsatile stimulation, 5-HT1A trafficking predominantly involves recycling pathways. Because longer-term exposure to 5-HT may induce lysosomal trafficking (21), these sensitive QD probes would be clinically valuable for elucidating the relationship between the duration of ligand/drug exposure and the recycling/lysosomal fates of GPCRs and will be investigated in future studies. Taken together, the similar kinetics between QD-tagged and native receptor experiments in receptor internalization (Fig. 3 A and C), recycling (Fig. 4 D and G), and lysosomal trafficking (Fig. 5B) indicate that QD probes can be used to identify and follow the trafficking kinetics of receptors in live cells without significant deviations from their native trafficking.
Fig. 5.
Lysosomal trafficking of 5-HT1A receptors measured with QDs. (A) Colocalization between QDs (red) and LAMP1 (green) after 15-min stimulation with 5-HT (QD-tagged receptor experiment is shown; native receptor experiment images are similar). (B) Colocalization between QDs and LAMP1 was analyzed as described in Fig. 4D. Horizontal black bar indicates duration of 5-HT exposure. All images are a maximum projection of a z-stack. White pixels indicate colocalization. (Scale bar, 10 μm.)
Discussion
We demonstrate that QD probes can be reliably used to study the endosomal trafficking of single or small groups of receptors in quantitative, kinetic detail. Our anti–HA-QD probes showed a very high degree of specific binding to our target receptor (on average <1 QD binds to a nontransfected cell) and will be useful in the study of virtually any HA-tagged membrane-bound biomolecule. Although past colocalization studies of receptors with endosomal pathway markers have been widely used to determine the association of proteins with pathway markers, these techniques use ensemble-averaging methods, limiting them from accurately monitoring single proteins at synchronized time points after their internalization. Further, although QD-bound receptors are known to be endocytosed into cells, it is unclear whether the presence of the QD could affect receptor internalization or trafficking. The capability to accurately characterize the kinetics of GPCR transit along specific pathways provides essential information in the identification of key GPCR trafficking mechanisms.
In the case of 5-HT1A receptors, we find clear evidence of two distinct pathways along which receptors are simultaneously recycled, one of which operates long after agonist removal. This evidence underscores the future importance of identifying intracellular downstream effectors involved in guiding receptor fate and consequent cell signaling and the exciting use of QDs to investigate the role of such effectors in receptor regulation. Such single-molecule studies of endosomal GPCR trafficking will provide unique insight into how receptor-targeted therapeutics modulate cellular signaling. Furthermore, given the photostability of QD fluorescence, future receptor tracking experiments will be useful for examining long-term, multicompartmental trafficking in live cells. Indeed, whereas we have shown an absence of QD-induced artifact in receptor trafficking pathways and kinetics, future studies may examine the effect of the bound QD probe in the many intracellular receptor–protein interactions that may affect receptor function, such as reinsertion into the plasma membrane.
Materials and Methods
Materials.
Reagents were purchased from Invitrogen unless otherwise specified. Primary antibodies were purchased from Abcam [monoclonal rat anti-LAMP1 (ab25245), polyclonal rabbit anti-Rab4 (ab13252)], Santa Cruz [polyclonal goat anti–Rab11-FIP1 N-15 (RCP) (SC-83022)], or Covance [monoclonal mouse anti-HA (MMS-101P)].
HA-Tagged 5-HT1A Plasmid DNA Constructs.
Plasmid HA-5-HT1A was constructed using standard molecular biology protocols. Briefly, 5-HT1A cDNA was subcloned into the pcDNA3.1 plasmid at the NheI/XhoI sites. Three copies of the HA peptide tag (YPYDVPDYA) were inserted at the N terminus, immediately after the methionine initiation codon. Plasmids were validated by DNA sequencing, amplified in Escherichia coli, purified using a plasmid maxi kit (Qiagen), cleaned with phenol-chloroform extraction, and EtOH precipitated. Western blot and immunofluorescence experiments were used to verify receptor expression levels and correct subcellular colocalization in transfected N2a cells.
Cell Culture and Transfections.
Neuro-2A (N2a) cells (ATCC) were cultured in 47.5% D-MEM, 47.5% Opti-MEM, and 5% FBS at 37 °C and 5% CO2. Cells were seeded at 80 cells/mm2 on poly-d-lysine–coated coverslips and cultured for 48 h before transfection. Cells were transfected with 2 μg pHA-5-HT1A, using 2 μL Lipofectamine 2000 for 2 h, rinsed with PBS, and cultured for an additional 48 h before starting experiments.
Generation of Anti–HA-QD Probe.
Anti-HA was biotinylated using NHS-PEO4-biotin and purified by dialysis (2000 MWCO). Afterward, streptavidin-QD655 was added to biotinylated anti-HA in 10% BSA/PBS, pH 7.4, at a 1:1 stoichiometric ratio, to reach a final concentration of 250 pM. Probe solution was used immediately afterward.
QD Labeling of HA-5-HT1A Receptors.
Transfected N2a cells were blocked in 10% BSA for 10 min at room temperature (RT). The QD probe was added to the cells and further incubated for 5 min at RT. Cells were then washed six times with PBS.
Internalization of 5-HT1A.
At least 1 h before 5-HT stimulation, medium was replaced with serum-free D-MEM. In QD-tagged receptor experiments, cells were prelabeled with QDs before stimulation and then stimulated with 10 μM 5-HT in PBS containing Mg2+ and Ca2+ for 15 min at 37 °C and 5% CO2. The 5-HT solution was removed, cells were washed with PBS, and serum-free D-MEM was added to each well. At the indicated time point, cells were fixed in 4% paraformaldehyde for 1 h at RT. Native receptor experiments were performed as above, except that cells were not prelabeled with QD probes; instead cells were labeled with QDs after fixation and permeabilization. Cells were then labeled with a plasma membrane marker using either DiO or anti–α-pan-cadherin, followed by an Alexafluor 488- or Alexafluor 555-labeled secondary antibody.
Endosomal Trafficking of 5-HT1A.
Experiments were carried out as specified in internalization experiments, except after fixation and permeabilization, cells were labeled using anti-Rab4, anti-RCP, or biotinylated anti-LAMP1 (biotinylation protocol followed the protocol described above for that of anti-HA), followed by Alexafluor 488 secondary antibodies.
z-Stack Image Acquisition and Deconvolution.
Cells were imaged using a Zeiss Axiovert 200M inverted epifluorescent microscope with a 100× oil objective lens (1.4 NA); filter cubes for FITC, rhodamine, and QD655 (Chroma); and a peltier-cooled Axiocam CCD camera (Zeiss). For each data set, z-stacks were acquired (z-step = 275 nm) using Axiovision software (Zeiss). z-Stacks were processed for camera bias and flatfield and deconvolved over 50–1,000 iterations using Autoquant Autodeblur (Media Cybernetics). After deconvolution, z-stacks were minimally processed using ImageJ (22) to subtract background and adjust brightness and/or contrast.
Counts and Subcellular Localization of Fluorescent QD Puncta.
To count and categorize QD puncta inside or outside of cells, z-stacks were analyzed using the ImageJ 3D objects counter plug-in, which numerically identified each QD puncta. The QD z-stack was then merged with the corresponding plasma membrane z-stack. Afterward, z-stacks were subjected to blind analysis—without knowledge of the experimental conditions. 3D rendering (ImageJ 3D viewer plug-in) (Fig. S1) and xy- and xz-orthogonal slice observations were used to aid categorization of individual QD puncta. QD puncta were categorized as surface bound if >20% of the punctum protruded from the extracellular surface of the labeled plasma membrane; otherwise, QD puncta were classified as internalized. Internalization was calculated as
where “int” stands for internalized. This calculation was averaged for all z-stacks at the same time point, and the averages were plotted against time.
Quantitative Colocalization of QD-5-HT1A with Endosomes.
Colocalization was quantified using Manders’ coefficient (M1),
where Ri is the intensity of red pixels (QD puncta), and Ri,coloc is the intensity of red pixels colocalized with green pixels (endosomes). The JACoP plug-in for ImageJ (23) was used to determine the Manders coefficient (M1, for red pixels overlapping green pixels) after applying a threshold to each z-stack. The Manders coefficients for all stacks at each time point were averaged and plotted against time.
Supplementary Material
Acknowledgments
We thank Brian R. Long for technical input on quantitative colocalization analysis. We thank Heike Rebholz, Jennifer Warner-Schmidt, and Jacob Bendor for helpful discussions and Urey Chow for technical help. This work was supported by Department of Defense Grants W81XWH-07-2-0107 (to T.Q.V.) and W81XWH-08-1-0111 (to P.G.).
Footnotes
The authors declare no conflict of interest.
This article contains supporting information online at www.pnas.org/lookup/suppl/doi:10.1073/pnas.1013763107/-/DCSupplemental.
References
- 1.Sorkin A, von Zastrow M. Endocytosis and signalling: Intertwining molecular networks. Nat Rev Mol Cell Biol. 2009;10:609–622. doi: 10.1038/nrm2748. [DOI] [PMC free article] [PubMed] [Google Scholar]
- 2.Polo S, Di Fiore PP. Endocytosis conducts the cell signaling orchestra. Cell. 2006;124:897–900. doi: 10.1016/j.cell.2006.02.025. [DOI] [PubMed] [Google Scholar]
- 3.Murphy JE, Padilla BE, Hasdemir B, Cottrell GS, Bunnett NW. Endosomes: A legitimate platform for the signaling train. Proc Natl Acad Sci USA. 2009;106:17615–17622. doi: 10.1073/pnas.0906541106. [DOI] [PMC free article] [PubMed] [Google Scholar]
- 4.Dahan M, et al. Diffusion dynamics of glycine receptors revealed by single-quantum dot tracking. Science. 2003;302:442–445. doi: 10.1126/science.1088525. [DOI] [PubMed] [Google Scholar]
- 5.Lidke DS, et al. Quantum dot ligands provide new insights into erbB/HER receptor-mediated signal transduction. Nat Biotechnol. 2004;22:198–203. doi: 10.1038/nbt929. [DOI] [PubMed] [Google Scholar]
- 6.Haggie PM, Kim JK, Lukacs GL, Verkman AS. Tracking of quantum dot-labeled CFTR shows near immobilization by C-terminal PDZ interactions. Mol Biol Cell. 2006;17:4937–4945. doi: 10.1091/mbc.E06-08-0670. [DOI] [PMC free article] [PubMed] [Google Scholar]
- 7.Chung I, et al. Spatial control of EGF receptor activation by reversible dimerization on living cells. Nature. 2010;464:783–787. doi: 10.1038/nature08827. [DOI] [PubMed] [Google Scholar]
- 8.Pinaud F, Clarke S, Sittner A, Dahan M. Probing cellular events, one quantum dot at a time. Nat Methods. 2010;7:275–285. doi: 10.1038/nmeth.1444. [DOI] [PubMed] [Google Scholar]
- 9.Hopkins AL, Groom CR. The druggable genome. Nat Rev Drug Discov. 2002;1:727–730. doi: 10.1038/nrd892. [DOI] [PubMed] [Google Scholar]
- 10.Svenningsson P, et al. Alterations in 5-HT1B receptor function by p11 in depression-like states. Science. 2006;311:77–80. doi: 10.1126/science.1117571. [DOI] [PubMed] [Google Scholar]
- 11.Warner-Schmidt JL, et al. Role of p11 in cellular and behavioral effects of 5-HT4 receptor stimulation. J Neurosci. 2009;29:1937–1946. doi: 10.1523/JNEUROSCI.5343-08.2009. [DOI] [PMC free article] [PubMed] [Google Scholar]
- 12.Scholl B, et al. Single particle quantum dot imaging achieves ultrasensitive detection capabilities for Western immunoblot analysis. ACS Nano. 2009;3:1318–1328. doi: 10.1021/nn9000353. [DOI] [PubMed] [Google Scholar]
- 13.Burnett D, Wood SM, Bradwell AR. Estimation of the Stokes radii of serum proteins for a study of protein movement from blood to amniotic fluid. Biochim Biophys Acta. 1976;427:231–237. doi: 10.1016/0005-2795(76)90299-3. [DOI] [PubMed] [Google Scholar]
- 14.Manders EM, Stap J, Brakenhoff GJ, van Driel R, Aten JA. Dynamics of three-dimensional replication patterns during the S-phase, analysed by double labelling of DNA and confocal microscopy. J Cell Sci. 1992;103:857–862. doi: 10.1242/jcs.103.3.857. [DOI] [PubMed] [Google Scholar]
- 15.Rosenfeld JL, Knoll BJ, Moore RH. Regulation of G-protein-coupled receptor activity by rab GTPases. Receptors Channels. 2002;8:87–97. [PubMed] [Google Scholar]
- 16.Stenmark H. Rab GTPases as coordinators of vesicle traffic. Nat Rev Mol Cell Biol. 2009;10:513–525. doi: 10.1038/nrm2728. [DOI] [PubMed] [Google Scholar]
- 17.Sönnichsen B, De Renzis S, Nielsen E, Rietdorf J, Zerial M. Distinct membrane domains on endosomes in the recycling pathway visualized by multicolor imaging of Rab4, Rab5, and Rab11. J Cell Biol. 2000;149:901–914. doi: 10.1083/jcb.149.4.901. [DOI] [PMC free article] [PubMed] [Google Scholar]
- 18.Sheff DR, Daro EA, Hull M, Mellman I. The receptor recycling pathway contains two distinct populations of early endosomes with different sorting functions. J Cell Biol. 1999;145:123–139. doi: 10.1083/jcb.145.1.123. [DOI] [PMC free article] [PubMed] [Google Scholar]
- 19.Horgan CP, McCaffrey MW. The dynamic rab11-fips. Biochem Soc Trans. 2009;37:1032–1036. doi: 10.1042/BST0371032. [DOI] [PubMed] [Google Scholar]
- 20.Seachrist JL, Ferguson SS. Regulation of G protein-coupled receptor endocytosis and trafficking by Rab GTPases. Life Sci. 2003;74:225–235. doi: 10.1016/j.lfs.2003.09.009. [DOI] [PubMed] [Google Scholar]
- 21.Hermans E, Vanisberg MA, Geurts M, Maloteaux JM. Down-regulation of neurotensin receptors after ligand-induced internalization in rat primary cultured neurons. Neurochem Int. 1997;31:291–299. doi: 10.1016/s0197-0186(96)00155-6. [DOI] [PubMed] [Google Scholar]
- 22.Abramoff MD, Magelhaes PJ, Ram SJ. Image processing with imagej. Biophotonics Int. 2004;11:36–42. [Google Scholar]
- 23.Bolte S, Cordelières FP. A guided tour into subcellular colocalization analysis in light microscopy. J Microsc. 2006;224:213–232. doi: 10.1111/j.1365-2818.2006.01706.x. [DOI] [PubMed] [Google Scholar]
Associated Data
This section collects any data citations, data availability statements, or supplementary materials included in this article.


