

Abstract
An important contributing factor for the high sensitivity of sensory systems is the exquisite sensitivity of the sensory receptor cells. We report here the signaling threshold of the olfactory receptor neuron (ORN). We first obtained a best estimate of the size of the physiological electrical response successfully triggered by a single odorant-binding event on a frog ORN, which was ∼0.034 pA and had an associated transduction domain spanning only a tiny fraction of the length of an ORN cilium. We also estimated the receptor-current threshold for an ORN to fire action potentials in response to an odorant pulse, which was ∼1.2 pA. Thus, it takes about 35 odorant-binding events successfully triggering transduction during a brief odorant pulse in order for an ORN to signal to the brain.
Keywords: olfaction, olfactory transduction, sensory transduction
Our visual system has pushed to the physical limit of sensitivity. Thus, a dark-adapted human subject can report light when just a few photons are absorbed in a retinal area spanning hundreds of rod photoreceptors, suggesting that each dark-adapted rod can signal the absorption of a single photon (1). What about the olfactory system? How many odorant molecules have to bind to an olfactory receptor neuron (ORN) to trigger an output signal? Retinal rods lack axons, so a graded, light-induced change in membrane potential directly modulates synaptic transmission. In contrast, ORNs have axons and require action potentials to convey olfactory signals to the brain. Hence, the question becomes: How many odorant-binding events successfully triggering transduction are required for changing an ORN’s firing?
The canonical mechanism of olfactory transduction in the main olfactory epithelium is now quite well understood (2–5). Odorant receptors (ORs) on ORN cilia are G protein-coupled-receptors (6) that, upon binding specific odorants, activate the adenylyl cyclase type-III via the G protein, Golf. The ensuing rise in cAMP opens a cyclic-nucleotide-gated (CNG), nonselective cation channel to produce a membrane depolarization. Additionally, the Ca2+ influx through the CNG channels opens a Ca2+-activated Cl channel on the ciliary membrane (7, 8). The resulting Cl− flux is, however, outward (i.e., inward Cl current) because of a high intracellular Cl− concentration maintained by steady Cl− uptake via a Na/K/Cl cotransporter, NKCC1 (9–12, but see 13), thus further depolarizing the cell to provide amplification (9, 10). Simultaneously, the Ca2+ influx triggers, via Ca2+-calmodulin, multiple negative-feedback pathways that lead to adaptation (2–5). Finally, action-potential generation in ORNs involves voltage-gated Na channels and low-voltage-activated (T-type) Ca channels, at least near threshold (14). Previously, we have found surprisingly that most odorant-binding events on an ORN are actually “inconsequential”: that is, unsuccessful in triggering transduction, apparently because the odorant-OR complex typically exists too briefly to activate the downstream pathway (15). The events described in this article implicitly mean successful events.
To determine the olfactory signaling threshold, we estimated the ORN response to a single odorant-binding event (referred to as “unitary response” here) and the threshold receptor-current required for triggering action potentials. Previously, we have characterized the unitary response in low-Ca2+ solution (15). In this solution, the foot of the stimulus-response (S–R) relation is clearly linear, suggesting a linear summation of unitary responses and allowing quantal analysis. We have interpreted this linear foot to indicate that, when there are few unitary responses, their associated transduction domains (i.e., physical regions where olfactory transduction occurs after OR activation) on the ORN cilia are spatially segregated from each other and do not interact, therefore summing linearly. In physiological, normal-Ca2+ solution, the S–R relation has an overall sigmoidal foot, with a Hill coefficient considerably greater than 1 (15, 16). However, the picture from low-Ca2+ experiments suggests to us that the initial foot of the S–R relation is likely also linear even in physiological solution, albeit restricted to very small responses and easily missed. Indeed, we have verified this here, allowing us to estimate the physiological unitary response.
Results
Foot of the S–R Relation in Physiological Conditions.
We began by examining the foot of the S–R relation in physiological solution. Fig. 1 shows the responses of an ORN in normal-Ca2+ solution to a pulse of 300-μM cineole of different durations (Materials and Methods). The overall foot (i.e., initial segment) of the S–R relation was supralinear, roughly fitted by a third-power-law relation (Fig. 1A, Lower). At close inspection, however, the initial foot (for responses <1 pA) was linear (Fig. 1B, Lower, black line), beyond which the relation became supralinear. Our interpretation is that, as the number of successful binding events increased with stronger stimuli, their transduction domains began to overlap spatially, making the S–R relation supralinear because of the supralinearities intrinsic to the olfactory-transduction mechanism. These supralinearities include, for example, multiple cAMP molecules being required for activating a single CNG channel (17), and more than one Ca2+ required for activating a Ca2+-activated Cl channel (7, 18).
Fig. 1.

S–R relation of an ORN in normal-Ca2+ solution. (A) (Upper) Response family with 300 μM cineole and duration of 100–200 ms. Traces are averages of 10–100 stimulus trials. (Lower) Corresponding S–R relation at transient peak of response, with a prominent supralinearity in the overall foot. Solid curve is the best-fit power-law relation with an exponent of 3.05. (B) Same cell as in A, but with cineole durations of 20–100 ms. The S–R relation is linear up to about 40-ms duration (or ∼0.5 pA response), beyond which it becomes supralinear. Each trace is average of >100 trials. The downward deflection immediately after the odorant pulse is a small movement artifact detectable only at high gain. For clarity, response traces for 80- to 100-ms odorant durations are not shown. Black line in lower panel is a least-squares linear fit to the first three datapoints. Red curve is same as in A, to indicate that the detailed foot of the S–R relation does not strictly follow a simple power law.
Estimate of Physiological Unitary Response from Measurements in Low-Ca2+ Solution.
One way to estimate the physiological unitary-response amplitude is to quantify, for a given cell, the foot of the S–R relation in normal-Ca2+ and low-Ca2+ solutions. From the macroscopic-response ratio in the linear range between the two solutions, we could calculate the physiological unitary response by scaling the unitary response in low-Ca2+ solution accordingly. Fig. 2 A–C shows data from three ORNs, with each showing a linear range of the S–R relation in 20 μM-Ca2+ (black circles in Right panels) and 1-mM Ca2+ solution (albeit short in this solution; red squares in Right panels, with expanded ordinate in Insets). If we assume that the number of transduction events does not change with external Ca2+ concentration, the ratio of macroscopic responses in this range should equal the ratio of unitary responses. Multiplying this ratio (slope ratio) with the previously measured unitary-response amplitude of 0.4 pA in 20-μM Ca2+ solution (15), we obtained a physiological unitary amplitude of 0.017 ± 0.012 pA (mean ± SD, 13 cells).
Fig. 2.

Comparison of olfactory responses in low (20 μM)-Ca2+ and normal (1 mM)-Ca2+ solutions. (A–C) Different cells, with cineole as stimulus at 500, 300, and 50 μM respectively. For each cell, the different responses were elicited by different stimulus durations beginning at time 0. The traces are color-coded according to stimulus duration (black, 20 ms; red, 30 ms; green, 40 ms; blue, 50 ms). The initial linear segment of the S–R relation in low-Ca2+ solution is mirrored also in normal-Ca2+ solution (Right), but the response is much smaller in the latter (magnified in Inset in extreme right), with the ratio (slope ratio) indicated. Traces in low-Ca2+ solution are averages of 2–10 trials each, and in normal-Ca2+ solution averages of ≥50 trials each. For clarity, not all response traces corresponding to datapoints in the right panels are shown. Small downward deflection visible in some traces in normal-Ca2+ solution is a movement artifact detectable only at high gain.
To validate that the number of transduction events at a given odorant strength is independent of external Ca2+ concentration, we also compared 20-μM Ca2+ and 100-nM Ca2+ solutions in the same way as above, and obtained a macroscopic-response ratio of 0.52 ± 0.09 (six cells). This ratio is indeed close to the unitary-response ratio of 0.44 from previous, independent measurements based on fluctuation analysis (0.4 pA in 20 μM Ca2+ and 0.9 pA in 100 nM Ca2+; ref. 15). We used 20-μM Ca2+, instead of 100-nM Ca2+, solution as reference in the present experiments because it provided better recording stability.
More generally, the olfactory response showed a continuous dependence on external Ca2+ concentration from 0.1 to 1,000 μM (replaced by equimolar Mg2+) (Fig. 3; average of five cells shown in B). These changes are much greater than expected from the known difference between external Ca2+ and Mg2+ in blocking the CNG current (19), and reflected the strong negative-feedback effects of intracellular Ca2+ on transduction itself (see introductory paragraphs).
Fig. 3.

Effect of external Ca2+ concentration on olfactory response. (A) Sample traces showing responses of an ORN to a fixed, weak cineole pulse (300 μM, 50 ms) delivered at time 0 in different low-Ca2+ solutions. Cell was exposed to a given low-Ca2+ solution for 2–3 s before stimulation with odorant dissolved in the same solution. (B) Amplitude at transient peak of response plotted against external Ca2+ concentration, normalized with respect to value at 0.1 μM Ca2+. Collected data, with each point representing average from at least five cells.
Direct Estimate of Physiological Unitary Response.
We also attempted to estimate the unitary-response amplitude in normal-Ca2+ solution directly by using fluctuation analysis, without relying on measurements in low-Ca2+ solution. We confined the analysis to measurements in the short linear segment at the initial foot of the S–R relation, because otherwise it would be invalid (SI Materials and Methods and Fig. S1). An ORN was stimulated with a series of identical, weak odorant pulses, and the ensemble mean, m(t), and variance, σ2(t), of the responses were calculated. From the Poisson distribution, the unitary-response amplitude is given by the σ2(t)/m(t) ratio at the transient peak of m(t), denoted here simply as σ2/m (SI Materials and Methods). Data from two ORNs are shown in Fig. 4 A and B. As expected from the trial-to-trial fluctuations resulting primarily from the stochastic variations in the number of unitary responses, the time courses of the mean, m(t), and the SD, σ(t), of the response coincided quite well (Fig. 4 A and B, Insets in Lower panels). From 12 measurements on nine cells (which constitute a subset of the data in Fig. S1), we obtained σ2/m = 0.032 ± 0.013 pA (Fig. 4C), which is within a factor of 2 from the indirect estimate of 0.017 pA described in the previous section.
Fig. 4.

Direct estimate of unitary-response amplitude in normal-Ca2+ solution by fluctuation analysis in linear range of S–R relation. (A and B) Two different cells, stimulated by cineole at 300 and 500 μM, respectively, of increasing durations. Note the large increase in variance as the response intrudes into the supralinear range of the S–R relation. (Upper, Inset) The foot of the variance plot expanded. (Lower, Inset) Similar time courses of the mean response [m(t)] and the standard deviation [σ(t)] of the response (see text) at one illustrative stimulus strength in the linear range (for the stimulus strength of 60-ms duration in A and 70-ms duration in B). (C) Collected σ2/m values from multiple cells. Note that σ2/m does not depend on m. The mean is 0.032 pA (±0.013 pA, SD). More than 50 trials per stimulus intensity for each cell.
We shall adopt the unitary amplitude of 0.017 pA from the previous section for general use because, by involving simply the response ensemble mean in normal Ca2+, it is probably more accurate. This value has then to be multiplied by ∼2 to correct for the imperfect collection of transduction current by the suction pipette (Materials and Methods), giving a true value of ∼0.034 pA.
Spatial Spread of Transduction Domain.
The S–R relation provides a way to estimate roughly the spatial spread of the transduction domain associated with a unitary response along a cilium, based on a simple model (Appendix and Fig. S2). To facilitate the analysis, we converted odorant strength (duration) in the linear range of the S–R relation into number of successful odorant-binding events by simply dividing the macroscopic response to a given odorant strength by the unitary-response amplitude estimated by fluctuation analysis on the same cell. For stronger odorant strengths in the S–R relation, the x axis was just extended linearly. The response amplitude in the S–R relation (y axis) was likewise converted into an equivalent number of unitary responses by dividing each macroscopic-response throughout by the unitary response. In this way, we obtained a plot of the equivalent number of unitary responses against the number of successful binding events. Fig. 5A shows these plots for four ORNs. The extent of the linear segment in the S–R relation varied from cell to cell, explainable by variations among cells in the length and number of olfactory cilia (possibly partly because of physical damage during cell dissociation). Longer or more cilia will accommodate more physically nonoverlapping unitary responses, thus giving a longer linear part of the relation. It was impossible, however, to determine by visual observation the exact length and number of cilia on a cell during an experiment because of their small size and motility.
Fig. 5.

Estimate of physical-domain size of unitary response. (A) S–R relations from four cells (cineole as stimulus in all cases at concentrations between 300 μM and 1 mM and of varied durations), plotted as number of equivalent unitary responses (y axis) against number of successful binding events (x axis). As such, data from different cells can be compared and fitted by the same mathematical function. In each panel, the smooth curve is the best-fit by Eq. 3 with the indicated w/L and α values. (B) Various fittings of data from Upper Right of A to indicate unique w/L and α values required for fit. Four quite different w/L values were successively adopted (leftmost column), and best-fit was then made with α as the only free variable. The same was repeated with different arbitrarily chosen α values (rightmost column in B) and w/L as the free variable. Black curve is same as in A, Upper Right; all other fits, which are not as good, are in red.
We then fit Eq. 3 in the Appendix to the overall foot (i.e., linear and supralinear regions together) of each S–R relation (Fig. 5A). R in Eq. 3 is evaluated (and scaled in amplitude) as a function of N by adjusting α and the ratio w/L as free parameters for the best fit (smooth curve). Up to nine summed terms are used, which is sufficient considering that we are not fitting much beyond the linear range of the S–R relation. We also checked the uniqueness of the w/L and α values in a given curve-fit by examining whether widely different pairs of values would give equally good fits. Although this check has not been done exhaustively, the fitted w/L and α values did appear to be unique (see example in Fig. 5B). From nine cells, the mean w/L value is 1/158 = 0.0063 (±0.0030, SD). With a nominal ciliary length of 40 μm (20) and 10 cilia on a cell (21), L = 400 μm. Thus, w = 2.5 μm. The average best-fit α value is 5.9 (ranging 4.8–7.2 in different cells). As mentioned in the Appendix, α incorporates the activation of the CNG current by cAMP (Hill coefficient ∼3; ref. 17), the activation of the Ca2+-activated Cl current by free Ca2+ (Hill coefficient ∼2; refs. 7 and 18), and any nonlinearities associated with local cAMP/Ca2+ buffers and Ca2+-feedback. Thus, a mean α value of 5.9 is not unreasonable. Note that, as conceived in the model, α is an empirical parameter, and it does not necessarily stay constant beyond the foot of the S–R relation because some of the parameters lumped into α can change.
Although the above estimate is only approximate because of the assumption of a spatially homogeneous unitary transduction domain, the important point is that the domain width w is very small compared with the length of a cilium. Indeed, the 2.5 μm may well be an upper limit because, instead of being an idealized boxcar function, the unitary domain in reality is likely a Gaussian function. Thus, a given number of binding events insufficient to cause overlaps between adjacent boxcar-shaped profiles would already cause some overlap between the skirts of the actual Gaussian profiles and lead to nonlinearity, meaning the equivalent boxcar spreads have to be even narrower than estimated above. Our estimate is similar to the recently reported restricted spread of current produced by locally photolyzed cAMP in the olfactory cilium (22) and, incidentally, the width is not too different from that for the single-photon response in the retinal rod (23).
Number of Unitary Events Required for an ORN to Signal to the Brain.
We define the threshold of successful olfactory signaling to the brain as the state at which the probability of action-potential firing by an ORN reaches 0.5 in response to an odorant pulse. Because the unitary response lasted for ∼1 s (e.g., Figs. 1 and 2), we measured the firing probability (i.e., the percentage of stimulus trials eliciting ≥ 1 action potential) during a 1-s time interval immediately before (as control), and during a 1-s time interval immediately after, an odorant pulse. Fig. 6A shows sample recordings to display action potentials (Materials and Methods) from an ORN subjected to a long series of identical weak stimuli. A change in firing could be triggered by a barely detectable receptor current, on average about 0.15 pA in this experiment (red trace in Fig. 6B; also ref. 24). By repeating the same procedure at other stimulus strengths, we obtained a plot of firing probability against receptor current. After converting receptor current into number of unitary responses (i.e., successful odorant-binding events) by using the S–R relation from the same cell (see earlier and Fig. 5), we obtained the plot in Fig. 6C. The firing probability increased rapidly, reaching 0.5 at ∼27 successful binding events. Combined with five other cells (Fig. 6D), the overall threshold number of binding events was 40 ± 25. Because this number is generally within the linear range of the S–R relation (Fig. 5), an approximate but simpler calculation is as follows. The receptor current at threshold was 0.6 ± 0.19 pA from the six cells, and the receptor current for consistent signaling (i.e., generating ≥1 action potential on every trial) was 1.31 ± 0.54 pA (six cells minus the one incomplete experiment marked by black diamonds in Fig. 5D); after correction for incomplete current collection, these became 1.2 and 2.6 pA, respectively. Dividing by the corrected unitary response of 0.034 pA, we obtained 35 ± 11 events for threshold signaling and 76 ± 44 events for consistent signaling. The ORN's probability of spontaneous firing varied between 0 and 0.2 over a 1-s interval, comparable to that found in ORNs of another lower vertebrate with single-unit recordings (0.01–0.71 s−1; ref. 25).
Fig. 6.

Probability of action-potential generation as a function of number of successful odorant-binding events. (A–C) Data from same cell. (A) Sample traces low-pass filtered at 500 Hz to show occasional spikes in response to a repeated, weak cineole pulse (300 μM and 20-ms duration) delivered at time 0 (indicated by arrow). (B) Superposed responses (black) from 151 stimulus trials in the experiment shown in A, together with mean response (red), low-pass filtered at 20 Hz to highlight the slow receptor current. (C) Probability of firing during a 1-s time interval following odorant stimulation of different strengths (same odorant concentration but pulse duration varied between 20 and 125 ms, respectively) plotted against number of successful binding events. The probability in the case of zero binding events (i.e., control with no odorant stimulation) was derived from a 1-s interval before odorant stimulus. (D) Data similar to C from five other cells, shown by different colored symbols.
Considering the reasonably constant unitary-response amplitude across cells and odorants (15 and the present study), the signaling threshold of 35–40 successful odorant-binding events may be fairly general, at least for amphibians. However, because the probability of successfully triggering transduction is low even for a cognate odorant-OR complex (15 and the introduction), the corresponding overall starting (i.e., successful and unsuccessful) number of odorant-binding events is much higher, although the exact value is unknown.
Finally, odorant stimulation can in principle elevate or lower the basal firing of an ORN (26). We have not observed any firing decrease caused by the odorants in this or previous work (cineole, acetophenone, and isoamylacetate) (15). Possibly, our sampled ORN population was insufficiently large for encountering inhibitory olfactory responses, or the chosen odorants only increase firing in our preparation. We may also have missed inhibition by biasing toward cells that had little or no constitutive activity (Materials and Methods). In any case, the stimulus threshold here applies only to an odorant-induced increase in ORN firing.
Discussion
Unitary Transduction Domain and Current.
An initially linear foot of the S–R relation for ORNs in physiological solution supports our picture that the unitary response (i.e., the response triggered by an individual odorant-binding event that successfully activates the downstream transduction machinery) is spatially restricted. Roughly, the unitary transduction domain spans ∼2.5 μm along a cilium at the transient peak of the response. The unitary response amplitude is about 0.034 pA.
It is interesting that, despite the supralinear behavior of the S–R relation beyond its linear foot in normal-Ca2+ solution, we did not find this supralinearity in low-Ca2+ solution (figure 1 in ref. 15). Instead, the S–R relation in low-Ca2+ solution becomes sublinear after the linear range. The likely reason is that, despite a Hill coefficient >1 for the activation of CNG channels by cAMP, a high percentage of CNG channels is already open within the unitary domain in low-Ca2+solution (because of the lack of negative feedback; refs. 2–5), so that when domain overlap occurs, the channel is already operating at the upper, sublinear part of its dose–response relation with cAMP concentration. For example, from the nominal 2.5-μm unitary domain and 400-μm summed ciliary length (Results), the fractional contribution by a domain to the overall response is ≤0.006. In 100 nM-Ca2+ solution, we found that the saturated odorant-induced current is almost invariably <200 pA (uncorrected). Thus, the saturated current within a unitary domain is <1.2 pA, compared with the unitary response of 0.9 pA (uncorrected) in this solution (Results and also ref. 15), which is at least already 75% toward saturation. In contrast, because of negative feedback triggered by intracellular Ca2+, the response in the domain at normal-Ca2+ solution is far from saturation, thus retaining the supralinearity intrinsic to transduction. Incidentally, there is probably little or no Ca2+-activated Cl current in low-Ca2+ solution.
Finally, the nasal-mucus composition is probably not exactly identical to the normal-Ca2+ solution used here. The Na+ concentration in the mucus of amphibians was reported to be 53–105 mM (27–30), and that of Ca2+ to be 0.3–5 mM (27, 29), versus 111 mM Na+ and 1 mM Ca2+ used in our experiments. Thus, the unitary-response amplitude in situ may be a little different from what we report here. On the other hand, the interstitial fluid that presumably determines action-potential threshold is probably well approximated by our Ringer solution, because of its isolation from the nasal cavity by the tight junctions between ORNs and sustentacular cells (31).
Coupling Between Transduction and Firing in ORNs.
We have found that a threshold receptor current as small as ∼1.2 pA is sufficient for depolarizing the ORN to firing threshold, and ∼2.6 pA is sufficient for the cell to consistently fire one or more action potentials. There are no specific measurements from other studies for comparison on how an ORN's firing probability depends quantitatively on injected current, but it has long been known that a very small current, ranging from 2 to 4 pA, will make amphibian ORNs fire action potentials (14, 32–35). Even these small currents may be overestimates, because the input resistance of these ORNs is so high (around 5–6 GΩ, refs. 32, 33, and 36) that the shunt through the seal resistance around the recording-pipette tip may limit the measurement. For rat ORNs, with an even higher (25–40 GΩ) reported input resistance because of their smaller size, an injected current of 1 pA is already sufficient for depolarization to firing threshold (37). Thus, overall, there appears to be a reasonable agreement between our measurements and those of others in respect to firing threshold.
With an input resistance of 5–6 GΩ and a membrane capacitance of 22 pF (34), the membrane time constant of the frog ORN is ∼120 ms, close to the response time-to-peak (several-hundred milliseconds) (Figs. 1, 3, 4, and 6) as to provide rough matched-filtering. Thus, brief, spontaneous openings of ion channels, such as Na or CNG channels, will not be very effective in depolarizing the cell, giving a better signal-to-noise ratio.
Sensitivity of Olfactory System.
Our experiments suggest that the odorant-pulse threshold for triggering a change in impulse activity of an ORN, hence signaled to the brain, corresponds to ∼35 odorant-binding events successful in signaling downstream. As a first approximation, these events can occur over the time-span of the unitary response (∼1 s). To determine the odorant concentration in the nasal mucus required for reaching this threshold, we would need to know, among other parameters, the total number of OR molecules on an ORN and the percentage of odorant-OR complexes successful in producing an electrical response. Neither parameter is currently available, and the latter obviously also depends on the specific odorant with respect to the OR in question. Previously, Berg and Purcell (38, 39) have shown that the collision rate between ligand molecules and their receptors on an impermeable surface is remarkably insensitive to the surface density of receptors. However, because odorants are mostly hydrophobic and can permeate through the plasma membrane, their analysis is unfortunately not well applicable here.
It is nonetheless instructive to work through a hypothetical example. Suppose that, in the mucus, the rate of odorant binding to an OR is governed by aqueous diffusion, and is, for example, 108 M−1·s−1 (or lower if the mucus is viscous). Suppose further that the OR density on the cilia is nominally 102 μm−2, which, for nominally 10 cilia each 40 μm long (Results) and 0.2 μm in diameter (20), corresponds to 2.5 × 10⁴ OR molecules per ORN. Thus, the number of transient odorant-OR complexes at 1-nM odorant concentration would be 2.5 × 10³ on the cell over a 1-s duration. If a cognate odorant-OR complex has, for example, only a 1% chance of successfully triggering transduction, there would be 25 unitary events, giving a firing probability of 0.25–0.71 for the cells in Fig. 6 C and D, or approaching threshold (firing probability of 0.5) for signaling to the olfactory bulb.
The axonal convergence by all ORNs expressing the same OR to the same synaptic glomerulus will boost the olfactory sensitivity much further. For example, for mouse, with ∼103 OR species distributed over ∼107 ORNs in the olfactory epithelium (40), the stimulus threshold can in principle be lowered by another factor of 104 if the OR species are evenly distributed over the ORNs (i.e., ∼104 cells expressing the same OR) and if firing in any one of these ORNs will lead to signaling up the olfactory pathway. Thus, based on the foregoing calculations, the mucal odorant concentration at detection threshold can in principle approach 0.1 pM. Obviously, additional factors (such as solvation of odorant in the mucus with or without odorant-binding proteins) contribute to translating odorant in the vapor phase into odorant concentration in mucus, but the above order-of-magnitude calculations illustrate how one might think about the problem.
Materials and Methods
Adult frog (Rana pipiens) was used. The procedures were as described elsewhere (15). The soma of an isolated ORN was drawn into the tip of a suction-pipette, with the cilia exposed to bath solution. Typically, the dendrite of the cell retracted into the soma, and ∼75% (by visual inspection) of the surface of the rounded-up soma/dendrite was in the pipette. The pipette resistance was 1.3–1.5 MΩ when empty and 6–8 MΩ with the cell in place. Assuming that the empty-pipette resistance resided mostly in the shank behind the tip where the cell occupied (upper estimate), the seal resistance with the cell in place should be ≥4.5 MΩ. Thus, at least 4.5/6 = 0.75 of the membrane current flowing across the part of soma in the pipette should be collected. The fraction of overall current at the soma (mirror image of membrane current at the cilia) collected by the pipette was therefore roughly 0.75 × 0.75 = 0.56. During pipette fabrication, extra care was taken to keep the pipette-tip configuration consistent (outer diameter ∼10 μm and inner diameter ∼8 μm), hence the empty-pipette resistance (and the current-collecting characteristic of the pipette) was fairly constant. A consistent pipette-tip profile also helped make the dynamics of the solution changes reproducible. The membrane current was recorded at room temperature (20–23 °C) on two channels, low-pass filtered at 20 and 500 Hz (8-pole Bessel) for recording receptor current and action potentials, respectively. The signals were digitized at 1 kHz. All indicated errors are SDs.
Odorant solutions were made daily from pure stocks (Sigma), containing 1–1,000 μM odorant dissolved in normal or 90% Ringer, the latter for marking the stimulus timing with liquid-junction currents. Mostly, cineole was used, eliciting responses from ∼10% of tested cells. Isoamylacetate and acetophenone were also used, exciting comparable percentages of cells. A cell was typically stable for ≥1 h with little decline in sensitivity. Solution changes were made by moving the interface between two solution streams across the recorded cell as previously described (15). To change the stimulus strength, we mostly varied the odorant-pulse duration instead of concentration (15). Changing the pulse duration is simple and precise during an experiment, whereas changing the odorant concentration requires many solutions installed before an experiment (which is impractical, especially considering that each randomly encountered ORN has a different OR). Moreover, given the apparent bimolecular odorant-OR interaction and the brief binding event, the number of binding events should increase linearly with odorant duration (15). In experiments with low-Ca2+ Ringer, the bath was switched to low-Ca2+ solution for typically 2 s before odorant was applied; afterward, the cell was returned to normal-Ca2+ solution for at least 10 s before odorant was reapplied. When switched to low-Ca2+ solution, a cell generally fired several action potentials and became quiescent thereafter; upon odorant stimulation, action potentials did not always appear. In normal-Ca2+ solution, however, odorant stimulation typically elicited action potentials. Sometimes, an inward current appeared when the cell was exposed to low-Ca2+ Ringer, presumably reflecting constitutive OR activity in some ORNs. We used only cells that did not show this current. Finally, we were unable to confirm the report that ORNs respond to mechanical perturbation with similar response profiles as those to odorants (41).
Normal-Ca2+ solution contained (in mM) 111 NaCl, 2.5 KCl, 1.6 MgCl2, 1 CaCl2, 0.01 Na-EDTA, 3 Na-hepes, pH 7.7, 10 glucose. The 20-μM Ca2+ solution contained (in mM) 111 NaCl, 2.5 KCl, 3.5 MgCl2, 0.1 CaCl2, 1 nitrilotriacetic acid (NTA), 3 Na-hepes, pH 7.7, 10 glucose, giving a free Ca2+ concentration of 20 μM and a free Mg2+ concentration of 2.6 mM (calculated according to the web-based program, MaxChelator), in total divalent concentration similar to that in normal-Ca2+ solution to minimize the change in blockage of the CNG channels (22). The 100-μM Ca2+ and 200-μM Ca2+ solutions were similar to 20-μM Ca2+ solution, except with 0.35 CaCl2, and with 0.6 mM CaCl2 and 3 mM MgCl2, respectively. The 0.1-μM Ca2+ solution was also similar to 20-μM Ca2+ solution, except with 2.6 MgCl2, 0.6 CaCl2, 1 EGTA, pH 7.4. The 500-μM Ca2+ solution was similar to normal-Ca2+ solution, except with 0.5 mM CaCl2.
Appendix
We derive here a simple S–R relation for an ORN subjected to a brief pulse of odorant. It takes into account the random spatial overlap of domains associated with individual unitary responses.
Consider an olfactory cilium of length L′, and unitary transduction domains each of width w centered at the point of occurrence of a successful odorant-binding event (Fig. S2). For simplicity, we assume that each domain is spatially homogeneous. If an odorant stimulus elicits, on average, N′ successful binding events on a cilium per trial, the average linear density of events on the cilium is N′/L′. At any point X on the cilium, the probability that there is 1, 2, 3, … events occurring within distance w/2 from X on either side will be, according to the Poisson distribution:
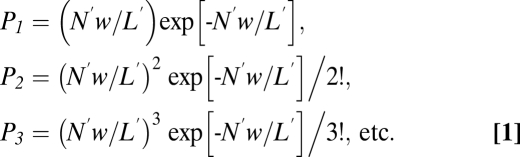 |
Any event occurring within w/2 on either side of X will add to the total response at X.
For a cell with k cilia, we have, after replacing N′k by N, and L′k by L (the summed ciliary length):
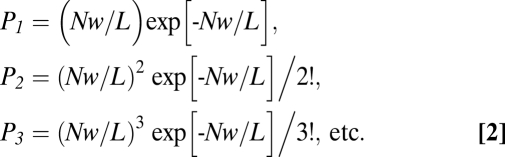 |
Suppose each successful binding event produces an incremental concentration of cAMP, C, at point X, with C increasing linearly with the number of overlapping domains at X. Suppose further that the electrical response R is proportional to Cα, where α incorporates the activations of the CNG current and the secondary Ca2+-activated Cl current, as well as any nonlinearities associated with local cAMP- and Ca2+-buffering and Ca2+-mediated negative feedback. We can then write:
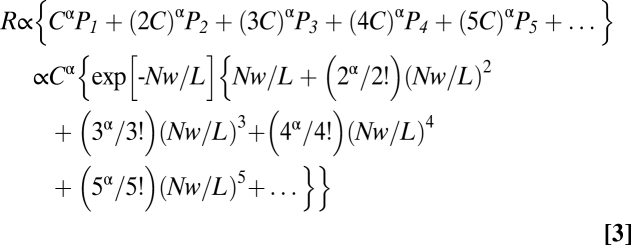 |
For very small N, such that Nw/L << 1, P1 predominates, and Eq. 3 reduces to R ∝ Cα{Nw/L}, so that R increases linearly with N, as expected.
Although somewhat simplistic, the above model has the attraction of being mathematically simple and not requiring any detailed knowledge of the longitudinal diffusion of cAMP and Ca2+, or their respective buffering, in the cilium (mostly unknown parameters). Furthermore, any potential uneven distribution of the CNG channels (42) along the cilium has been ignored.
Supplementary Material
Acknowledgments
We thank Tian Xue for help with calculations, and Denis Baylor, Yair Ben-Chaim, Michael Tri Do, Dong-Gen Luo, and other members of the Yau laboratory for discussions and comments. This work was supported in part by National Institutes of Health Grant DC06904.
Footnotes
The authors declare no conflict of interest.
*This Direct Submission article had a prearranged editor.
This article contains supporting information online at www.pnas.org/lookup/suppl/doi:10.1073/pnas.1004571107/-/DCSupplemental.
References
- 1.Hecht S, Shlaer S, Pirenne MH. Energy, quanta and vision. J Gen Physiol. 1942;25:819–840. doi: 10.1085/jgp.25.6.819. [DOI] [PMC free article] [PubMed] [Google Scholar]
- 2.Schild D, Restrepo D. Transduction mechanisms in vertebrate olfactory receptor cells. Physiol Rev. 1998;78:429–466. doi: 10.1152/physrev.1998.78.2.429. [DOI] [PubMed] [Google Scholar]
- 3.Matthews HR, Reisert J. Calcium, the two-faced messenger of olfactory transduction and adaptation. Curr Opin Neurobiol. 2003;13:469–475. doi: 10.1016/s0959-4388(03)00097-7. [DOI] [PubMed] [Google Scholar]
- 4.Kato A, Touhara K. Mammalian olfactory receptors: Pharmacology, G protein coupling and desensitization. Cell Mol Life Sci. 2009;66:3743–3753. doi: 10.1007/s00018-009-0111-6. [DOI] [PMC free article] [PubMed] [Google Scholar]
- 5.Munger SD, Leinders-Zufall T, Zufall F. Subsystem organization of the mammalian sense of smell. Annu Rev Physiol. 2009;71:115–140. doi: 10.1146/annurev.physiol.70.113006.100608. [DOI] [PubMed] [Google Scholar]
- 6.Buck LB. The molecular architecture of odor and pheromone sensing in mammals. Cell. 2000;100:611–618. doi: 10.1016/s0092-8674(00)80698-4. [DOI] [PubMed] [Google Scholar]
- 7.Kleene SJ, Gesteland RC. Calcium-activated chloride conductance in frog olfactory cilia. J Neurosci. 1991;11:3624–3629. doi: 10.1523/JNEUROSCI.11-11-03624.1991. [DOI] [PMC free article] [PubMed] [Google Scholar]
- 8.Stephan AB, et al. ANO2 is the cilial calcium-activated chloride channel that may mediate olfactory amplification. Proc Natl Acad Sci USA. 2009;106:11776–11781. doi: 10.1073/pnas.0903304106. [DOI] [PMC free article] [PubMed] [Google Scholar]
- 9.Kurahashi T, Yau K-W. Olfactory transduction. Tale of an unusual chloride current. Curr Biol. 1994;4:256–258. doi: 10.1016/s0960-9822(00)00058-0. [DOI] [PubMed] [Google Scholar]
- 10.Lowe G, Gold GH. Nonlinear amplification by calcium-dependent chloride channels in olfactory receptor cells. Nature. 1993;366:283–286. doi: 10.1038/366283a0. [DOI] [PubMed] [Google Scholar]
- 11.Kaneko H, Putzier I, Frings S, Kaupp UB, Gensch T. Chloride accumulation in mammalian olfactory sensory neurons. J Neurosci. 2004;24:7931–7938. doi: 10.1523/JNEUROSCI.2115-04.2004. [DOI] [PMC free article] [PubMed] [Google Scholar]
- 12.Reisert J, Lai J, Yau K-W, Bradley J. Mechanism of the excitatory Cl- response in mouse olfactory receptor neurons. Neuron. 2005;45:553–561. doi: 10.1016/j.neuron.2005.01.012. [DOI] [PMC free article] [PubMed] [Google Scholar]
- 13.Nickell WT, Kleene NK, Gesteland RC, Kleene SJ. Neuronal chloride accumulation in olfactory epithelium of mice lacking NKCC1. J Neurophysiol. 2006;95:2003–2006. doi: 10.1152/jn.00962.2005. [DOI] [PMC free article] [PubMed] [Google Scholar]
- 14.Narusuye K, Kawai F, Miyachi E-I. Spike encoding of olfactory receptor cells. Neurosci Res. 2003;46:407–413. doi: 10.1016/s0168-0102(03)00131-7. [DOI] [PubMed] [Google Scholar]
- 15.Bhandawat V, Reisert J, Yau K-W. Elementary response of olfactory receptor neurons to odorants. Science. 2005;308:1931–1934. doi: 10.1126/science.1109886. [DOI] [PMC free article] [PubMed] [Google Scholar]
- 16.Firestein S, Picco C, Menini A. The relation between stimulus and response in olfactory receptor cells of the tiger salamander. J Physiol. 1993;468:1–10. doi: 10.1113/jphysiol.1993.sp019756. [DOI] [PMC free article] [PubMed] [Google Scholar]
- 17.Nakamura T, Gold GH. A cyclic nucleotide-gated conductance in olfactory receptor cilia. Nature. 1987;325:442–444. doi: 10.1038/325442a0. [DOI] [PubMed] [Google Scholar]
- 18.Reisert J, Bauer PJ, Yau K-W, Frings S. The Ca-activated Cl channel and its control in rat olfactory receptor neurons. J Gen Physiol. 2003;122:349–363. doi: 10.1085/jgp.200308888. [DOI] [PMC free article] [PubMed] [Google Scholar]
- 19.Kleene SJ. Block by external calcium and magnesium of the cyclic-nucleotide-activated current in olfactory cilia. Neuroscience. 1995;66:1001–1008. doi: 10.1016/0306-4522(94)00634-h. [DOI] [PubMed] [Google Scholar]
- 20.Kleene SJ, Gesteland RC, Bryant SH. An electrophysiological survey of frog olfactory cilia. J Exp Biol. 1994;195:307–328. doi: 10.1242/jeb.195.1.307. [DOI] [PubMed] [Google Scholar]
- 21.Menco BP. Qualitative and quantitative freeze-fracture studies on olfactory and nasal respiratory structures of frog, ox, rat and dog. I. A general survey. Cell Tissue Res. 1980;207:183–209. doi: 10.1007/BF00237805. [DOI] [PubMed] [Google Scholar]
- 22.Takeuchi H, Kurahashi T. Distribution, amplification, and summation of cyclic nucleotide sensitivities within single olfactory sensory cilia. J Neurosci. 2008;28:766–775. doi: 10.1523/JNEUROSCI.3531-07.2008. [DOI] [PMC free article] [PubMed] [Google Scholar]
- 23.Lamb TD, McNaughton PA, Yau K-W. Spatial spread of activation and background desensitization in toad rod outer segments. J Physiol. 1981;319:463–496. doi: 10.1113/jphysiol.1981.sp013921. [DOI] [PMC free article] [PubMed] [Google Scholar]
- 24.Reisert J, Matthews HR. Adaptation of the odour-induced response in frog olfactory receptor cells. J Physiol. 1999;519:801–813. doi: 10.1111/j.1469-7793.1999.0801n.x. [DOI] [PMC free article] [PubMed] [Google Scholar]
- 25.Mathews DF. Response patterns of single neurons in the tortoise olfactory epithelium and olfactory bulb. J Gen Physiol. 1972;60:166–180. doi: 10.1085/jgp.60.2.166. [DOI] [PMC free article] [PubMed] [Google Scholar]
- 26.Duchamp-Viret P, Chaput MA, Duchamp A. Odor response properties of rat olfactory receptor neurons. Science. 1999;284:2171–2174. doi: 10.1126/science.284.5423.2171. [DOI] [PubMed] [Google Scholar]
- 27.Joshi H, Getchell ML, Zielinski B, Getchell TV. Spectrophotometric determination of cation concentrations in olfactory mucus. Neurosci Lett. 1987;82:321–326. doi: 10.1016/0304-3940(87)90276-x. [DOI] [PubMed] [Google Scholar]
- 28.Bronshtein AA, Leont’ev VG. Sodium and potassium content in the mucus of the olfactory lining of vertebrates. Zh Evol Biokhim Fiziol. 1972;8:580–585. [PubMed] [Google Scholar]
- 29.Chiu D, Nakamura T, Gold GH. Ionic composition of toad olfactory mucus measured with ion selective microelectrodes. Chem Senses. 1989;13:677–678. [Google Scholar]
- 30.Reuter D, Zierold K, Schröder WH, Frings S. A depolarizing chloride current contributes to chemoelectrical transduction in olfactory sensory neurons in situ. J Neurosci. 1998;18:6623–6630. doi: 10.1523/JNEUROSCI.18-17-06623.1998. [DOI] [PMC free article] [PubMed] [Google Scholar]
- 31.Farbman AI. Cell Biology of Olfaction. Cambridge, UK: Cambridge University Press; 1992. [Google Scholar]
- 32.Firestein S, Werblin FS. Gated currents in isolated olfactory receptor neurons of the larval tiger salamander. Proc Natl Acad Sci USA. 1987;84:6292–6296. doi: 10.1073/pnas.84.17.6292. [DOI] [PMC free article] [PubMed] [Google Scholar]
- 33.Kawai F, Kurahashi T, Kaneko A. T-type Ca2+ channel lowers the threshold of spike generation in the newt olfactory receptor cell. J Gen Physiol. 1996;108:525–535. doi: 10.1085/jgp.108.6.525. [DOI] [PMC free article] [PubMed] [Google Scholar]
- 34.Imanaka Y, Takeuchi H. Spiking properties of olfactory receptor cells in the slice preparation. Chem Senses. 2001;26:1023–1027. doi: 10.1093/chemse/26.8.1023. [DOI] [PubMed] [Google Scholar]
- 35.Tomaru A, Kurahashi T. Mechanisms determining the dynamic range of the bullfrog olfactory receptor cell. J Neurophysiol. 2005;93:1880–1888. doi: 10.1152/jn.00303.2004. [DOI] [PubMed] [Google Scholar]
- 36.Pun RYK, Kleene SJ. An estimate of the resting membrane resistance of frog olfactory receptor neurones. J Physiol. 2004;559:535–542. doi: 10.1113/jphysiol.2004.067611. [DOI] [PMC free article] [PubMed] [Google Scholar]
- 37.Lynch JW, Barry PH. Action potentials initiated by single channels opening in a small neuron (rat olfactory receptor) Biophys J. 1989;55:755–768. doi: 10.1016/S0006-3495(89)82874-7. [DOI] [PMC free article] [PubMed] [Google Scholar]
- 38.Berg HC, Purcell EM. Physics of chemoreception. Biophys J. 1977;20:193–219. doi: 10.1016/S0006-3495(77)85544-6. [DOI] [PMC free article] [PubMed] [Google Scholar]
- 39.Berg HC. Random Walks in Biology. Princeton, NJ: Princeton University Press; 1993. [Google Scholar]
- 40.Shepherd GM, Greer CA. Olfactory bulb. In: Shepherd GM, editor. The Synaptic Organization of the Brain. New York: Oxford Univ Press; 1998. pp. 159–203. [Google Scholar]
- 41.Grosmaitre X, Santarelli LC, Tan J, Luo M, Ma M. Dual functions of mammalian olfactory sensory neurons as odor detectors and mechanical sensors. Nat Neurosci. 2007;10:348–354. doi: 10.1038/nn1856. [DOI] [PMC free article] [PubMed] [Google Scholar]
- 42.Flannery RJ, French DA, Kleene SJ. Clustering of cyclic-nucleotide-gated channels in olfactory cilia. Biophys J. 2006;91:179–188. doi: 10.1529/biophysj.105.079046. [DOI] [PMC free article] [PubMed] [Google Scholar]
Associated Data
This section collects any data citations, data availability statements, or supplementary materials included in this article.