Abstract
Ritonavir is a HIV protease inhibitor routinely prescribed to HIV patients that also potently inactivates cytochrome P4503A4 (CYP3A4), the major human drug-metabolizing enzyme. By inhibiting CYP3A4, ritonavir increases plasma concentrations of other anti-HIV drugs oxidized by CYP3A4 thereby improving clinical efficacy. Despite the importance and wide use of ritonavir in anti-HIV therapy, the precise mechanism of CYP3A4 inhibition remains unclear. The available data are inconsistent and suggest that ritonavir acts as a mechanism-based, competitive or mixed competitive-noncompetitive CYP3A4 inactivator. To resolve this controversy and gain functional and structural insights into the mechanism of CYP3A4 inhibition, we investigated the ritonavir binding reaction by kinetic and equilibrium analysis, elucidated how the drug affects redox properties of the hemoprotein, and determined the 2.0 Å X-ray structure of the CYP3A4-ritonavir complex. Our results show that ritonavir is a type II ligand that perfectly fits into the CYP3A4 active site cavity and irreversibly binds to the heme iron via the thiazole nitrogen, which decreases the redox potential of the protein and precludes its reduction with the redox partner, cytochrome P450 reductase.
Keywords: crystal structure, cytochrome P450, inhibitor
Cytochromes P450 are a superfamily of hemoproteins that play a central role in the metabolism of endogenous compounds and xenobiotics (1). Cytochrome P4503A4 (CYP3A4) is the most abundant human isoform that metabolizes over one-half of clinically used drugs (2). Although catalytically selective, CYP3A4 has a broad capacity for oxidative metabolism and can accommodate a variety of structurally diverse substrates. With some compounds, CYP3A4 displays homo- and heterotropic cooperativity, thought to play an important role in drug-drug interactions in vivo (3). These unique enzymatic properties of CYP3A4 have implications for drug development and therapy.
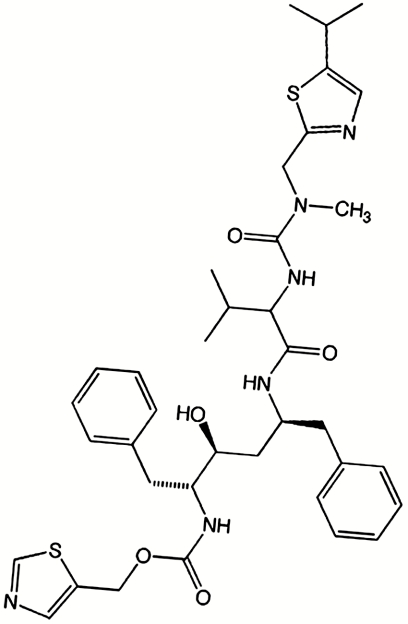
One of the areas significantly affected by the CYP3A4-dependent oxidative transformations is the development of anti-HIV drugs. The key components of highly active antiretroviral therapy are HIV protease inhibitors that act both as substrates and inhibitors of CYP3A4. One of these, ritonavir (Fig. 1), is the most potent CYP3A4 inhibitor known to date. Coadministration of ritonavir with other anti-HIV drugs biotransformed by CYP3A4 enhances pharmacokinetics and improves clinical efficacy (4).
Fig. 1.
Structure of ritonavir.
Ritonavir is primarily metabolized by the CYP3A subfamily (5, 6) through N-demethylation, hydroxylation of the isopropyl side chain, and oxidation and cleavage of the terminal isopropyl-thiazole group (7). Characteristic features of ritonavir metabolism by microsomal and recombinant CYP3A4 are low KM (20 and 0.1–0.5 μM, respectively (5, 7)) and a nonlinear reaction course (7). This kinetic behavior, as well as increased inhibitory potency of ritonavir after preincubation with microsomes suggest that the drug is a mechanism-based inhibitor which converts into a reactive intermediate upon oxidation and selectively inactivates CYP3A4 by irreversibly attaching to the heme and/or active site amino acid residues (7, 8). The reactive intermediate(s) was proposed to involve the isopropyl-thiazole end-group (7), strictly required for potent CYP3A4 inhibition (9). Further, a noncovalent inhibitory complex, also known as a metabolic intermediate complex (MIC) (10), was reported to form during incubation of ritonavir with insect microsomes containing recombinantly expressed human CYP3A4 and cytochrome b5 (11). Other studies indicated, however, that ritonavir acts as a competitive (12) or mixed competitive-noncompetitive CYP3A4 inactivator (5, 13, 14). Thus, despite the importance and wide use of ritonavir in anti-HIV therapy, the precise action of the drug remains unclear.
In an attempt to resolve the contradictions and gain functional and structural insights into the mechanism of CYP3A4 inhibition, we investigated the kinetics and equilibrium binding of ritonavir to recombinant human CYP3A4Δ3-24, analyzed how the drug affects redox properties of the hemoprotein, and solved the X-ray structure of the CYP3A4-ritonavir complex.
Results and Discussion
Ritonavir Is a Type II Heme Ligand.
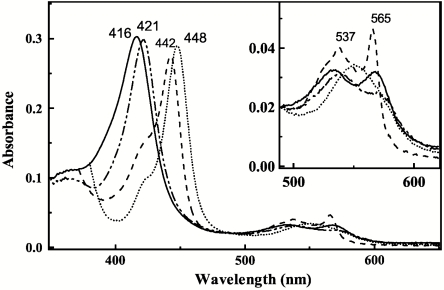
Soluble human CYP3A4Δ3-24 catalyzes monooxygenation reactions similar to the full-length native enzyme (2). Upon addition to this form of the hemoprotein, ritonavir induces characteristic spectral changes accompanied by the Soret and α-band shifts from 416 to 421 nm and 532 to 537 nm, respectively, and a decrease in the amplitude of the β-band (Fig. 2). These spectral perturbations are indicative of displacement of water as a sixth ligand and direct coordination of the heme iron to a nitrogen atom (type II ligand binding (15)). Reduction of the ritonavir-bound species with sodium dithionite leads to the appearance of a 442 nm peak and pronounced, well defined α- and β-bands at 537 and 565 nm, respectively. The red-shifted absorption maximum of the ferrous ritonavir-bound CYP3A4 resembles that observed for the metyrapone-bound cytochrome P450cam and may be attributed to the σ-donor nitrogen ligation to the heme iron (16). Given that the thiazole and isopropyl-thiazole groups of ritonavir are strictly required for potent inhibition (9), and ketoconazole, another type II inhibitor of CYP3A4, binds to the heme iron via the imidazole nitrogen (17), it can be concluded based on the spectral data that the thiazole nitrogen of ritonavir is the likely iron ligand in both ferric and ferrous CYP3A4.
Fig. 2.
Spectral changes induced by ritonavir in CYP3A4. Absorbance spectra of ferric ligand-free (__), ferric ritonavir-bound (-..-..), ferrous ritonavir-bound (- - -), and ferrous-CO adduct (….) of 3 μM CYP3A4 were recoded in buffer A.
Ritonavir Binds to CYP3A4 Stoichiometrically and Irreversibly.
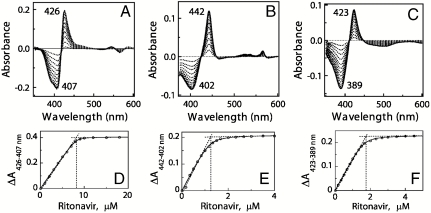
Affinity and stoichiometry of ritonavir binding to various CYP3A4 forms were determined spectroscopically by equilibrium titrations (Fig. 3, Table 1). According to the spectral data, ritonavir binds stoichiometrically and very tightly to both ferric and ferrous CYP3A4 (spectral dissociation constant (Ks) of 51 and 45 nM, respectively). Furthermore, the drug can easily replace type I ligands, even when they are present in a large excess (Fig. S1). The binding affinity of ritonavir for bromoergocryptine (BEC)- and androstenedione-bound CYP3A4, for instance, is as high as for the substrate-free hemoprotein (Ks of 50 and 19 nM, respectively). The Ks values obtained in this study agree well with the inhibition constant (Ki) of ritonavir for the CYP3A4-dependent metabolism of methadone, buprenorphine, and testosterone in human liver microsomes (20–50 nM (12, 13)). For other reactions catalyzed by microsomal CYP3A4, the Ki for ritonavir varies from 0.10 to 0.38 μM (11, 14, 18).
Fig. 3.
Equilibrium titration of CYP3A4 with ritonavir. Spectral changes in 8 μM ferric (A), 1.5 μM ferrous (B), and 2 μM ferric BEC-bound CYP3A4 (C) were recorded as described in Materials and Methods. Absorbance changes in ferric, ferrous, and ferric BEC-bound CYP3A4 were plotted against the ritonavir concentration (D, E, and F, respectively). The derived Ks values are listed in Table 1.
Table 1.
Binding rates and affinity of ritonavir to CYP3A4
| CYP3A4 | |||
| ferric | ferrous | ferric, BEC-bound | |
| Ks*, nM | 51 ± 10 | 45 ± 13 | 50 ± 5 |
| Kd†, μM | 0.84 ± 0.05 | 0.94 ± 0.16 | 1.24 ± 0.15 |
| kfast‡, s-1 | 1.42 ± 0.3 | 1.43 ± 0.3 | 1.42 ± 0.2 |
| kslow§, s-1 | 0.23 ± 0.04 | 0.20 ± 0.02 | 0.24 ± 0.04 |
*Spectroscopic dissociation constant for the CYP3A4-ritonavir complex.
†Kinetic dissociation constant for the CYP3A4-ritonavir complex.
‡Rate constant for the fast phase of the CYP3A4-ritonavir binding reaction.
§Rate constant for the slow phase of the CYP3A4-ritonavir binding reaction.
To test whether ritonavir binding is reversible, the inhibitor-bound protein was passed through desalting or gel filtration columns and dialyzed against or repeatedly concentrated/diluted with a ritonavir-free buffer. Under all conditions tested, no dissociation of the CYP3A4-ritonavir complex has been observed. Ritonavir thus is a very high affinity type II ligand that binds to CYP3A4 irreversibly.
Kinetics of Ritonavir Ligation Suggests Multiple Binding Modes.
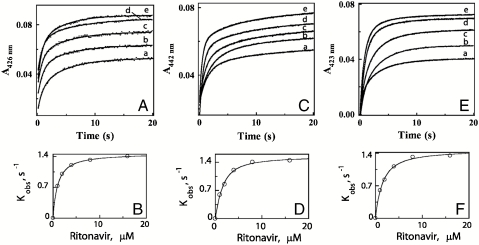
To gain further insight into the mechanism of the CYP3A4-ritonavir interaction, we measured the kinetics of inhibitor binding to ferric and ferrous P450 by monitoring absorbance changes at 426 and 442 nm, respectively, using stopped flow spectrophotometry (Fig. 4 A–D). Kinetic analyses show that the CYP3A4-ritonavir binding reaction is biphasic, with approximately equal amounts of the hemoprotein reacting with the ligand in each phase. The limiting rate constants for the fast and slow phases of the reactions involving ferric and ferrous CYP3A4 are similar and approach 1.4 and 0.2 s-1, respectively (Table 1). Kinetic dissociation constants (Kd) estimated from the fits to the plots of kobs vs. ritonavir concentration are also in the same range but almost 20-fold higher than the respective Ks values (0.84 and 0.94 μM, respectively). Furthermore, no substantial deviations in the kinetic parameters were observed in the presence of BEC (Fig. 4 E, F and Table 1). Again, these data demonstrate that ritonavir can easily displace type I ligands from the CYP3A4 active site.
Fig. 4.
Kinetics of ritonavir binding to CYP3A4. Ligation of 1, 2, 4, 8, and 16 μM ritonavir (traces a - e, respectively) to 1.5 μM ferric (A), ferrous (C) or BEC-bound ferric CYP3A4 (E) was monitored at 426, 442, and 423 nm, respectively. The observed rate constants (kobs) for the fast and slow phases were calculated from the biexponential fits (solid lines) to the kinetic traces. The limiting rate constants and kinetic Kd’s derived from the plots of kobs for the fast phase vs. ritonavir concentration (B, D, and F) are listed in Table 1.
The biphasic nature of the ritonavir binding reaction and a large difference between the equilibrium and kinetic dissociation constants indicate that association of ritonavir with CYP3A4 is a complex process that may be affected by both ligand-protein and protein-protein interactions. Having an elongated shape (Fig. 1), ritonavir can enter the CYP3A4 active site with either the thiazole or isopropyl-thiazole end oriented toward the heme. Because CYP3A4 mediates hydroxylation of the latter group (7), the isopropyl-thiazole nitrogen is unlikely to serve as a heme ligand. Thus, when ritonavir docks to CYP3A4 with the isopropyl-thiazole head on, a positional/conformational rearrangement must take place within the active site cavity to bring the opposite thiazole moiety in the vicinity of the heme iron or the drug has to dissociate and reenter the active site in a different orientation. Either of these events could lead to an appearance of a slow phase in the CYP3A4-ritonavir binding reaction. Alternatively, the biphasic kinetics could arise from the conformational heterogeneity of CYP3A4. Although the ligand-free and ritonavir-bound forms of CYP3A4 elute as monomers during gel filtration, the unligated protein has a wider elution profile and, hence, is more heterogeneous (Fig. S2). Formation of weakly associating CYP3A4 oligomers (19) and the existence of peripheral binding site(s) (20) are other factors that could modulate access and docking orientation of ritonavir and complicate the binding kinetics.
Ritonavir Lowers the CYP3A4 Redox Potential and Precludes Reduction by CPR.
By displacing the coordinated water molecule, type I substrates elevate the P450 redox potential and promote electron transfer from cytochrome P450 reductase (CPR), whereas type II ligands bind to the heme iron stronger than water and lower the protein redox potential, thereby disfavoring reduction by CPR and inhibiting P450 turnover (15, 21). To confirm that these general rules apply to ritonavir, we investigated how the drug affects the redox properties of CYP3A4 (Fig. S3). The estimated Eo,7 values for ligand-free and androstenedione-bound CYP3A4 are -330 and -277 mV, respectively, close to those reported for the full-length CYP3A4 and other microsomal P450s (22, 23). The ritonavir-bound hemoprotein has Eo,7 of -350 mV, which is ∼80 mV lower than the redox potential of the Flavin mononucleotide (FMN) hydroquinone/semiquinone couple in CPR (-269 mV (24)), the redox species delivering electrons to P450. Owing to the large ΔEo, reduction of ritonavir-bound CYP3A4 by CPR is thermodynamically unfavorable.
That NADPH consumption in the CPR-CYP3A4 reconstituted system is not affected by ritonavir but notably increased in the presence of androstenedione (Fig. S4) is one indication that CYP3A4 does not metabolize ritonavir. To further demonstrate that ritonavir prevents reduction of CYP3A4 by CPR, NADPH and catalytic amounts of CPR were added to anaerobic solutions of ligand-free, androstenedione- or ritonavir-bound CYP3A4, and spectral changes in the 350–700 nm region were monitored over time. As expected (Fig. 5), androstenedione-bound CYP3A4 (> 90% high spin) was capable of receiving electrons from CPR and converted to a fully reduced form within several minutes. In contrast, the ligand-free and ritonavir-bound hemoproteins remained fully oxidized during the monitored period of time. Because CPR-mediated reduction of full-length ligand-free CYP3A4 takes place in the presence of CO (25, 26), we followed the ferrous P450-CO complex formation to confirm that the N-terminal truncation has no significant effect on the redox properties of CYP3A4. In the presence of CO, known to elevate the P450 redox potential and promote heme reduction (27), both androstenedione-bound and ligand-free CYP3A4 were able to accept electrons from CPR (Fig. 5 A, B). Reduction of unligated CYP3A4, however, proceeded somewhat slower and, judging from the appearance of the 420 nm peak, led to partial inactivation of CYP3A4. Within the same time period, only negligible amounts of the CO-adduct were formed by the ritonavir-bound protein (Fig. 5C). Such drastic differences corroborate the notion that the redox function of CYP3A4 and P450s, in general, is controlled by the substrate-induced spin state/redox potential change (28, 29).
Fig. 5.
CPR cannot reduce ritonavir-bound CYP3A4. Spectra were recorded under anaerobic conditions in buffer A before (___) and after addition of NADPH and catalytic amounts of human CPR to ligand-free (A), androstenedione- (B), or ritonavir-bound CYP3A4 (C) in the absence (- - - -) or presence of CO (…).
In summary of our biochemical findings, we conclude that ritonavir is a type II ligand that can inhibit CYP3A4 turnover not only by replacing substrates in the active site and binding irreversibly to the heme iron but also through changes in the protein redox potential which preclude reduction by CPR.
Crystal Structure of the CYP3A4-Ritonavir Complex.
Owing to high homogeneity (Fig. S2) and stability in solution, ritonavir-bound CYP3A4 readily produces crystals under different conditions in various space groups. The best diffracting crystals belong to space group C2 and contain two P450 molecules per asymmetric unit (Table S1). The CYP3A4-ritonavir complex structure was solved by molecular replacement to 2.0 Å, the highest resolution for a ligand-bound CYP3A4 structure reported thus far. Two crystallographically independent P450 molecules are virtually identical, with the rms deviation for the 457 Cα atoms of only 0.15 Å. Interactions between the ritonavir-bound monomers in the crystal lattice (Fig. S5) resemble those observed for ketoconazole- and erythromycin-bound CYP3A4 (Protein Data Bank (PDB) ID codes 2VOM and 2JOD, respectively).
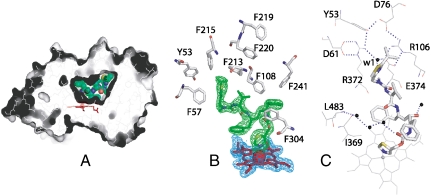
Previous structural investigations showed that CYP3A4 can bind molecules diverse in size and chemical nature mainly because of its large and malleable active site, the volume and topology of which can be easily adjusted through positional and conformational changes in the F-G helix/linker region (residues 202–260) serving as a roof, and the N- and C-terminal loops (residues 48–58 and 464–496, respectively) lining the cavity walls (2, 17, 30). Ritonavir is perfectly molded into the 765 Å3 active site pocket (the volume is calculated with LIGSITE (31)) and is fully sequestered from solvent (Fig. 6A). As spectral data predict, the thiazole nitrogen is ligated to the heme, with the N-Fe distance of 2.2 and 2.3 Å in molecules A and B, respectively. One phenyl ring of ritonavir is parallel and 4.0 Å away from the heme plane (Fig. 6B), making van der Waals contacts with Ile369, Ala370, and Leu373. The second phenyl ring is embedded in a hydrophobic pocket comprised by Phe108, Leu210, Leu211, Phe241, Ile301, and Phe304. The isopropyl-thiazole group is enclosed by the Tyr53, Phe57, Phe213, and Phe215 side chains and connected via a water molecule to the cluster of charged residues (Asp61, Asp76, Arg106, Arg372, and Glu374) that together with Tyr53 form an umbrella-like network isolating the terminal moiety from the solvent (Fig. 6C). Although ritonavir is sequestered from bulk solvent, several water molecules are present in the active site cavity, six of which are within 4.0 Å of the inhibitor. The water near the isopropyl-thiazole nitrogen is most ordered (B-factor < 30 Å2) and, we believe, is functionally important because it connects ritonavir with Glu374, part of the polar “umbrella.” This interaction may assist optimal orientation and increase binding affinity of the inhibitor. For comparison, in the erythromycin-CYP3A4 complex, the charge-charge/H-bonding network is broken and the edge of the erythromycin molecule, a low affinity ligand, is solvent exposed (17). Thus, the manner of ritonavir binding observed in the crystal structure (i.e., perfect spatial fit, sequestering from solvent, extensive hydrophobic enclosure, short N-Fe distance) supports the spectral data and explains why this drug is such a potent CYP3A4 inactivator.
Fig. 6.
Crystal structure of the CYP3A4-ritonavir complex. (A), The active site cavity of ritonavir-bound CYP3A4. Ritonavir is green and in CPK representation; the heme is red. (B), Aromatic residues surrounding ritonavir. 2Fo-Fc (blue) and Fo-Fc (green) electron density maps around the heme and ritonavir are contoured at 1 and 3 σ, respectively. (C), An umbrella-like charge-charge/H-bonding network connected to the isopropyl-thiazole moiety of ritonavir via a highly ordered water molecule (w1).
Comparison of the Ritonavir- and Ketoconazole-Bound CYP3A4 Structures.
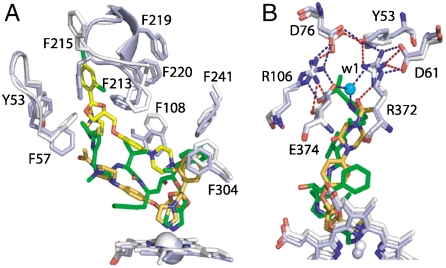
The ritonavir-bound structure is the most and least similar to the ketoconazole- and erythromycin-bound models of CYP3A4, rms deviation between the 453 and 395 Cα-carbon atoms of which is 0.63 and 1.34 Å, respectively (Fig. S6). The major conformational changes induced by ritonavir are observed in the F-G region and the C-terminal loop, confirming once again that these are key elements involved in substrate recognition and binding. Because ritonavir and ketoconazole are both type II ligands, we compared the respective structures in more detail to better understand differences in the mechanism of inhibition. Although the Ki values for ritonavir and ketoconazole are comparable (e.g., 0.07 and 0.02 μM, respectively, for the nifedipine oxidation reaction catalyzed by microsomal CYP3A4 (5, 32)), preincubation of microsomes with ritonavir, but not with ketoconazole, leads to an increase in the inhibitory potency (8). The most notable difference between the structures is in the F′-G′ helices, positioned further from the main core in ketoconazole-bound CYP3A4 (Fig. S6, B), which could be due to docking of two ketoconazole molecules in the active site instead of one (17). The orientation and volume occupied by the antiparallel-stacked ketoconazole molecules, however, are strikingly similar to those of ritonavir (Fig. 7A). Because one head group of ketoconazole extends toward the protein surface, the F′-G′ loop cannot fully block the active site entrance and, as a result, the Phe215 ring is in an “out” conformation, keeping the active site cavity solvent exposed. Even if only one ligated ketoconazole was present, it would still bind less tightly than ritonavir because it would not fit into the pocket as efficiently and establish as many hydrophobic contacts as ritonavir. The binding mode observed in the crystals suggests also that the connection of ketoconazole to the polar “umbrella” may not be as strong (Fig. 7B). It is therefore remarkable that ritonavir, designed to target the HIV protease, fits into the CYP3A4 cavity more efficiently than ketoconazole, a genuine P450 inactivator. Although the biological relevance of the ketoconazole-bound structure is questionable and remains to be tested, the structural comparison predicts that a compound mimicking the stacked tandem of ketoconazole molecules but with a shorter tail may be a potent CYP3A4 inhibitor as well.
Fig. 7.
Comparison of ritonavir- and ketoconazole-bound CYP3A4. The structures are rendered in white and light blue, respectively. (A), Relative orientation of ritonavir (green), ketoconazole molecules (yellow and orange) and the interacting aromatic residues. (B), Conformational differences around the polar “umbrella.” Blue and red dotted lines represent electrostatic/H-bonding interactions in the ritonavir- and ketoconazole-ligated CYP3A4, respectively.
Mechanistic Implications.
Our biochemical and structural results are not consistent with the currently prevalent concept on the mechanism-based CYP3A4 inhibition by ritonavir. By definition, a metabolism-based inhibitor is a compound chemically converted by the target enzyme into a reactive metabolite that inactivates the enzyme prior to release from the active site (33). Thus, an O2/NADPH-dependent catalytic step and formation of a covalent adduct or MIC would be essential for the metabolism-based P450 inhibition. In this study, we demonstrate that ritonavir quickly (within a few seconds at ambient temperatures) and very tightly binds to the CYP3A4 heme iron via the thiazole nitrogen, regardless of the protein redox state and the presence of type I substrates. In this orientation, CYP3A4 cannot oxidize ritonavir because its redox potential is too low to allow reduction by CPR. However, we do not exclude the possibility of a covalent adduct/MIC formation with a differently oriented ritonavir molecule. According to our kinetic data, there are multiple binding modes for ritonavir and, therefore, in some cases it may need to reorient in the active site prior to heme ligation via the thiazole nitrogen. This drug reorientation takes place during the second phase of the reaction and may be slow enough (0.2 s-1 at ambient temperatures) to allow CYP3A4 to receive two electrons from CPR and produce a reactive metabolite.
In P450s, MICs have a characteristic absorbance peak at 450–460 nm and can be detected spectrophotometrically (10). However, owing to a wide spread in extinction coefficient (0.07–80 mM-1 cm-1 (10, 34)) and strong absorption of ferrous ritonavir-bound CYP3A4 in the 440–460 nm region (Fig. 2), spectral MIC detection may be difficult. Presently, there is only one report on MIC formation during incubation of ritonavir with insect microsomes containing recombinantly expressed human CYP3A4 (11). Unfortunately, no spectral evidence or information on whether MIC is reversible and could be dissociated upon CYP3A4 oxidation with ferricyanide was provided.
A decrease in the IC50 values for ritonavir (the half maximal inhibitory concentration) after preincubation with microsomes and NADPH (7, 8, 18) is another argument frequently used to support the mechanism-based type of CYP3A4 inhibition. Although ritonavir could easily displace from the CYP3A4Δ3-24 active site all tested type I substrates (BEC, androstenedione, testosterone, and progesterone; Fig. S1), the situation in microsomes may be different owing to the influence of the lipid bilayer on trafficking of lipophilic substrates/metabolites to/from the membrane-bound P450. Due to extreme substrate promiscuity and high affinity for hydrophobic compounds, native CYP3A4 may rarely be in a ligand-free form and, thus, could remain substrate/ligand-bound upon isolation of microsomes. It is possible, therefore, that ritonavir can replace some but not all natural compounds bound to the microsomal P450, and that CPR/NADPH-dependent oxidation of those tightly bound molecules and subsequent product dissociation may be required before ritonavir gains access to the active site. This chain of events would lead to an apparent decrease in IC50 values, and the kinetics of ritonavir inhibition would be more consistent with a mixed competitive-noncompetitive mechanism, as has been observed already for some reactions catalyzed by microsomal CYP3A4 (5, 13, 14).
In conclusion, our biochemical and structural results show that ritonavir is an irreversible type II inhibitor that inactivates CYP3A4 not only by displacing substrates from the active site and tightly binding to the heme iron via the thiazole nitrogen but also by decreasing the protein redox potential and precluding reduction by CPR. Although ritonavir cannot be oxidized by CYP3A4 in the orientation observed in the crystals, other binding modes allowing oxidative transformations and leading to the reactive metabolite formation cannot be ruled out.
Materials and Methods
Protein Expression and Purification.
CYP3A4Δ3-24 was produced in Escherichia coli with the C-terminal four-histidine tag and purified using Ni2+-affinity and ion exchange chromatography as previously described (2). P450 concentration was determined according to Omura and Sato (35). The A417/280 ratios in CYP3A4 preparations used for functional and structural studies were > 1.6.
Spectral Binding Titrations.
Ligand binding to ferric and ferrous CYP3A4 was monitored spectrophotometrically under aerobic and anaerobic conditions, respectively. Ferrous CYP3A4 was produced by reduction with sodium dithionite. Substrate-free or BEC-bound CYP3A4 was titrated with small aliquots of ethanol solutions of ritonavir (Toronto Research Chemicals) in 50 mM phosphate, pH 7.5, 20% glycerol, and 1 mM dithiothreitol (buffer A). Equal amounts of ethanol were added to the reference cuvette containing similar enzyme concentrations, with the total volume of solvent added ≤ 2% (v/v). Spectra were recorded after each addition, and the difference in absorbance between the wavelength maximum and minimum was plotted against the inhibitor concentration. Owing to tight binding, Ks for ritonavir was calculated using quadratic nonlinear regression analysis as described elsewhere (20).
Kinetics of Ritonavir Binding.
Kinetics of ritonavir binding to oxidized and sodium dithionite-reduced CYP3A4 was monitored at 23 °C in a SX.18MV stopped flow apparatus (Applied Photophysics) by following absorbance changes at 426 and 442 nm, respectively. Protein solutions (3 μM) were mixed with 0.5–30 μM ritonavir in 50 mM phosphate, pH 7.5. Interaction of BEC-bound CYP3A4 with ritonavir was monitored at 423 nm in the presence of 15 μM BEC. Anaerobic solutions contained an oxygen scavenging system consisting of 5 mM glucose, 2 Unit/mL glucose oxidase and 1 Unit/mL catalase. Kinetic data were analyzed using the IgorPro program (WaveMetrics, Inc). Kd’s for the CYP3A4-ritonavir complex were determined from the plots of kobs vs. ritonavir concentrations.
Crystallization and Structure Determination.
Ritonavir-bound CYP3A4 was crystallized by a microbatch method under oil. 0.6 μL of the ritonavir-bound protein (50–60 mg/mL) in buffer A, 100 mM NaCl and 1 mM EDTA were mixed with 0.6 μL of the crystallization solution containing 100 mM sodium malonate, pH 6.0, and 12% polyethylene glycol 3350, then covered with 30 μL of paraffin oil. Crystals appeared and grew within several days at room temperature. X-ray diffraction data were collected at the Stanford Synchrotron Radiation Laboratory (SSRL) beamline 11-1 using 30% glycerol as a cryoprotectant. The structure was solved by molecular replacement with ligand-free CYP3A4 (PDB ID code 1TQN) as a search model. Solutions for two CYP3A4 molecules were found with PHASER (36). The initial model was rebuilt and refined with CNS (37) and O (38). In both CYP3A4 molecules, the N- and C-terminal residues as well as the 265–267 and 281–288 fragments were disordered. Data collection and refinement statistics are given in Table S1. The atomic coordinates have been deposited into the Protein Data Bank, www.pdb.org (PDB ID code 3NXU).
Supplementary Material
Acknowledgments.
This study was supported by Gilead Sciences, Inc. and National Institutes of Health Grant GM33688, and involves research carried out at the Stanford Synchrotron Radiation Laboratory, a national user facility operated by Stanford University on behalf of the Department of Energy, Office of Basic Energy Sciences. The Stanford Synchrotron Radiation Laboratory (SSRL) Structural Molecular Biology Program is supported by the Department of Energy, Office of Biological and Environmental Research, and by the National Institutes of Health, National Center for Research Resources, Biomedical Technology Program, and the National Institute of General Medical Sciences.
Footnotes
The authors declare no conflict of interest.
This article is a PNAS Direct Submission.
Data deposition: The atomic coordinates and structure factors have been deposited in the Protein Data Bank, www.pdb.org.
This article contains supporting information online at www.pnas.org/lookup/suppl/doi:10.1073/pnas.1010693107/-/DCSupplemental.
References
- 1.Ortiz de Montellano P, editor. Cytochrome P450: structure, mechanism, and biochemistry. New York: Kluwer Academic/Plenum Publishers; 2005. [Google Scholar]
- 2.Williams PA, et al. Crystal structures of human cytochrome P450 3A4 bound to metyrapone and progesterone. Science. 2004;305:683–686. doi: 10.1126/science.1099736. [DOI] [PubMed] [Google Scholar]
- 3.Guengerich FP, et al. Twenty years of biochemistry of human P450s: purification, expression, mechanism, and relevance to drugs. Drug Metab Dispos. 1998;26:1175–1178. [PubMed] [Google Scholar]
- 4.Xu L, Desai MC. Pharmacokinetic enhancers for HIV drugs. Curr Opin Investig D. 2009;10:775–786. [PubMed] [Google Scholar]
- 5.Kumar GN, Rodrigues AD, Buko AM, Denissen JF. Cytochrome P450-mediated metabolism of the HIV-1 protease inhibitor ritonavir (ABT-538) in human liver microsomes. J Pharmacol Exp Ther. 1996;277:423–431. [PubMed] [Google Scholar]
- 6.Chiba M, Hensleigh M, Nishime JA, Balani SK, Lin JH. Role of cytochrome P450 3A4 in human metabolism of MK-639, a potent human immunodeficiency virus protease inhibitor. Drug Metab Dispos. 1996;24:307–314. [PubMed] [Google Scholar]
- 7.Koudriakova T, et al. Metabolism of the human immunodeficiency virus protease inhibitors indinavir and ritonavir by human intestinal microsomes and expressed cytochrome P4503A4/3A5: mechanism-based inactivation of cytochrome P4503A by ritonavir. Drug Metab Dispos. 1998;26:552–561. [PubMed] [Google Scholar]
- 8.von Moltke LL, Durol AL, Duan SX, Greenblatt DJ. Potent mechanism-based inhibition of human CYP3A in vitro by amprenavir and ritonavir: comparison with ketoconazole. Eur J Clin Pharmacol. 2000;56:259–261. doi: 10.1007/s002280000125. [DOI] [PubMed] [Google Scholar]
- 9.Kempf DJ, et al. ABT-538 is a potent inhibitor of human immunodeficiency virus protease and has high oral bioavailability in humans. Proc Natl Acad Sci USA. 1995;92:2484–2488. doi: 10.1073/pnas.92.7.2484. [DOI] [PMC free article] [PubMed] [Google Scholar]
- 10.Fennell TR, Bridges JW. Structure--activity relationship for “safrole-type” cytochrome P-450 induction. Biochem Soc Trans. 1979;7:1104–1106. doi: 10.1042/bst0071104. [DOI] [PubMed] [Google Scholar]
- 11.Ernest CS, 2nd, Hall SD, Jones DR. Mechanism-based inactivation of CYP3A by HIV protease inhibitors. J Pharmacol Exp Ther. 2005;312:583–591. doi: 10.1124/jpet.104.075416. [DOI] [PubMed] [Google Scholar]
- 12.Iribarne C, et al. Inhibition of methadone and buprenorphine N-dealkylations by three HIV-1 protease inhibitors. Drug Metab Dispos. 1998;26:257–260. [PubMed] [Google Scholar]
- 13.Eagling VA, Back DJ, Barry MG. Differential inhibition of cytochrome P450 isoforms by the protease inhibitors, ritonavir, saquinavir, and indinavir. Br J Clin Pharmaco. 1997;44:190–194. doi: 10.1046/j.1365-2125.1997.00644.x. [DOI] [PMC free article] [PubMed] [Google Scholar]
- 14.Zalma A, et al. In vitro metabolism of trazodone by CYP3A: inhibition by ketoconazole and human immunodeficiency viral protease inhibitors. Biol Psychiatry. 2000;47:655–661. doi: 10.1016/s0006-3223(99)00176-6. [DOI] [PubMed] [Google Scholar]
- 15.Jefcoate CR. Measurement of substrate and inhibitor binding to microsomal cytochrome P450 by optical-difference spectroscopy. Methods Enzymol. 1978;52:258–279. doi: 10.1016/s0076-6879(78)52029-6. [DOI] [PubMed] [Google Scholar]
- 16.Dawson JH, Andersson LA, Sono M. Spectroscopic investigations of ferric cytochrome P450CAM ligand complexes. Identification of the ligand trans to cysteinate in the native enzyme. J Biol Chem. 1983;258:13637–13645. [PubMed] [Google Scholar]
- 17.Ekroos M, Sjogren T. Structural basis for ligand promiscuity in cytochrome P450 3A4. Proc Natl Acad Sci USA. 2006;103:13682–13687. doi: 10.1073/pnas.0603236103. [DOI] [PMC free article] [PubMed] [Google Scholar]
- 18.Obach RS, Walsky RL, Venkatakrishnan K. Mechanism-based inactivation of human cytochrome P450 enzymes and the prediction of drug-drug interactions. Drug Metab Dispos. 2007;35:246–255. doi: 10.1124/dmd.106.012633. [DOI] [PubMed] [Google Scholar]
- 19.Davydov DR, et al. Electron transfer in the complex of membrane-bound human cytochrome P450 3A4 with the flavin domain of P450BM-3: the effect of oligomerization of the heme protein and intermittent modulation of the spin equilibrium. Biochim Biophys Acta. 2010;1797:378–390. doi: 10.1016/j.bbabio.2009.12.008. [DOI] [PMC free article] [PubMed] [Google Scholar]
- 20.Isin EM, Guengerich FP. Kinetics and thermodynamics of ligand binding by cytochrome P450 3A4. J Biol Chem. 2006;281:9127–9136. doi: 10.1074/jbc.M511375200. [DOI] [PubMed] [Google Scholar]
- 21.Dawson JH, Andersson LA, Sono M. The diverse spectroscopic properties of ferrous cytochrome P-450-CAM ligand complexes. J Biol Chem. 1982;257:3606–3617. [PubMed] [Google Scholar]
- 22.Yamazaki H, Johnson WW, Ueng YF, Shimada T, Guengerich FP. Lack of electron transfer from cytochrome b5 in stimulation of catalytic activities of cytochrome P450 3A4. Characterization of a reconstituted cytochrome P450 3A4/NADPH-cytochrome P450 reductase system and studies with apo-cytochrome b5. J Biol Chem. 1996;271:27438–27444. doi: 10.1074/jbc.271.44.27438. [DOI] [PubMed] [Google Scholar]
- 23.Guengerich FP. Oxidation-reduction properties of rat liver cytochromes P450 and NADPH-cytochrome P450 reductase related to catalysis in reconstituted systems. Biochemistry. 1983;22:2811–2820. doi: 10.1021/bi00281a007. [DOI] [PubMed] [Google Scholar]
- 24.Munro AW, Noble MA, Robledo L, Daff SN, Chapman SK. Determination of the redox properties of human NADPH-cytochrome P450 reductase. Biochemistry. 2001;40:1956–1963. doi: 10.1021/bi001718u. [DOI] [PubMed] [Google Scholar]
- 25.Yamazaki H, Ueng YF, Shimada T, Guengerich FP. Roles of divalent metal ions in oxidations catalyzed by recombinant cytochrome P450 3A4 and replacement of NADPH--cytochrome P450 reductase with other flavoproteins, ferredoxin, and oxygen surrogates. Biochemistry. 1995;34:8380–8389. doi: 10.1021/bi00026a020. [DOI] [PubMed] [Google Scholar]
- 26.Guengerich FP, Johnson WW. Kinetics of ferric cytochrome P450 reduction by NADPH-cytochrome P450 reductase: Rapid reduction in the absence of substrate and variations among cytochrome P450 systems. Biochemistry. 1997;36:14741–14750. doi: 10.1021/bi9719399. [DOI] [PubMed] [Google Scholar]
- 27.Guengerich FP, Ballou DP, Coon MJ. Purified liver microsomal cytochrome P450. Electron-accepting properties and oxidation-reduction potential. J Biol Chem. 1975;250:7405–7414. [PubMed] [Google Scholar]
- 28.Sligar SG, Cinti DL, Gibson GG, Schenkman JB. Spin state control of the hepatic cytochrome P450 redox potential. Biochem Biophys Res Commun. 1979;90:925–932. doi: 10.1016/0006-291x(79)91916-8. [DOI] [PubMed] [Google Scholar]
- 29.Das A, Grinkova YV, Sligar SG. Redox potential control by drug binding to cytochrome P450 3A4. J Am Chem Soc. 2007;129:13778–13779. doi: 10.1021/ja074864x. [DOI] [PMC free article] [PubMed] [Google Scholar]
- 30.Yano JK, et al. The structure of human microsomal cytochrome P450 3A4 determined by X-ray crystallography to 2.05-A resolution. J Biol Chem. 2004;279:38091–38094. doi: 10.1074/jbc.C400293200. [DOI] [PubMed] [Google Scholar]
- 31.Hendlich M, Rippmann F, Barnickel G. LIGSITE: automatic and efficient detection of potential small molecule-binding sites in proteins. J Mol Graph Model. 1997;15:359–363. doi: 10.1016/s1093-3263(98)00002-3. [DOI] [PubMed] [Google Scholar]
- 32.Bourrie M, Meunier V, Berger Y, Fabre G. Cytochrome P450 isoform inhibitors as a tool for the investigation of metabolic reactions catalyzed by human liver microsomes. J Pharmacol Exp Ther. 1996;277:321–332. [PubMed] [Google Scholar]
- 33.Silverman R. Mechanism-based enzyme inactivation: Chemistry and enzymology. Boca Raton, FL: CRC Press; 1988. [Google Scholar]
- 34.Pershing LK, Franklin MR. Cytochrome P-450 metabolic-intermediate complex formation and induction by macrolide antibiotics; a new class of agents. Xenobiotica. 1982;12:687–699. doi: 10.3109/00498258209038944. [DOI] [PubMed] [Google Scholar]
- 35.Omura T, Sato R. The carbon monoxide-binding pigment of liver microsomes: solubilization, purification, and properties. J Biol Chem. 1964;239:2379–2385. [PubMed] [Google Scholar]
- 36.CCP4. Collaborative computational project number 4. The CCP4 suite programs for protein crystallography. Acta Crystallogr D. 1994;50:760–763. doi: 10.1107/S0907444994003112. [DOI] [PubMed] [Google Scholar]
- 37.Brunger AT, et al. Crystallography + NMR system: a new software suite for macromolecular structure determination. Acta Crystallogr D. 1998;54:905–921. doi: 10.1107/s0907444998003254. [DOI] [PubMed] [Google Scholar]
- 38.Jones TA, Zou JY, Cowan SW, Kjeldgaard M. Improved methods for building protein models in electron density maps and the location of errors in these models. Acta Crystallogr A. 1991;47:110–119. doi: 10.1107/s0108767390010224. [DOI] [PubMed] [Google Scholar]
Associated Data
This section collects any data citations, data availability statements, or supplementary materials included in this article.


