Abstract
Mitochondrial production of ROS (reactive oxygen species) is thought to be associated with the cellular damage resulting from chronic exposure to high glucose in long-term diabetic patients. We hypothesized that a mitochondria-targeted antioxidant would prevent kidney damage in the Ins2+/−AkitaJ mouse model (Akita mice) of Type 1 diabetes. To test this we orally administered a mitochondria-targeted ubiquinone (MitoQ) over a 12-week period and assessed tubular and glomerular function. Fibrosis and pro-fibrotic signalling pathways were determined by immunohistochemical analysis, and mitochondria were isolated from the kidney for functional assessment. MitoQ treatment improved tubular and glomerular function in the Ins2+/−AkitaJ mice. MitoQ did not have a significant effect on plasma creatinine levels, but decreased urinary albumin levels to the same level as non-diabetic controls. Consistent with previous studies, renal mitochondrial function showed no significant change between any of the diabetic or wild-type groups. Importantly, interstitial fibrosis and glomerular damage were significantly reduced in the treated animals. The pro-fibrotic transcription factors phospho-Smad2/3 and β-catenin showed a nuclear accumulation in the Ins2+/−AkitaJ mice, which was prevented by MitoQ treatment. These results support the hypothesis that mitochondrially targeted therapies may be beneficial in the treatment of diabetic nephropathy. They also highlight a relatively unexplored aspect of mitochondrial ROS signalling in the control of fibrosis.
Keywords: diabetes, Ins2+/−AkitaJ mice (Akita mice), interstitial fibrosis, mitochondrial function, MitoQ, renal clearance
Abbreviations: AUC, area under the curve; CoQ, coenzyme Q; DTPA, diethylenetriaminepenta-acetic acid; EMT, epithelial-to-mesenchymal transition; GBM, glomerular basement membrane; MAG3, mercaptoacetyltriglycine; MitoQ, mitoubiquinone; PASR, Picric Acid Sirius Red; RCR, respiratory control ratio; ROI, region of interest; ROS, reactive oxygen species; SOD, superoxide dismutase; STZ, streptozotocin; 99mTc, technetium-99m; TGFβ, transforming growth factor β
INTRODUCTION
The increasing incidence of secondary complications associated with diabetes highlights the need to improve existing treatment regimens and preventive measures. Current data indicate that approx. 43% of new cases of ESRDs (end-stage renal diseases) are due to diabetes, suggesting the need for novel therapies to address diabetes-induced kidney damage [1]. Diabetic nephropathy is characterized by decreased glomerular filtration rate, proteinuria, mesangial expansion, tubulointerstitial fibrosis and glomerulosclerosis [2,3].
Both Type 1 and Type 2 diabetes mellitus have complex pathophysiologies, including insulin resistance syndrome and hyperglycaemia, which are associated with abnormalities in fat oxidation and increased formation of ROS (reactive oxygen species) and RNS (reactive nitrogen species) [4,5]. Kidney mitochondria from STZ (streptozotocin)-induced diabetic rats show increased superoxide production and post-translational modification of mitochondrial complex III [6,7]. The production of ROS from the mitochondria has received a great deal of attention, and it is now becoming clear it may be regulated under physiological conditions and play an important role in redox cell signalling. For example, it has been shown that mitochondrial ROS produced at complex III can activate proliferative signalling pathways in cancer cells [8,9]. ROS-mediated mechanisms have also been reported to lead to activation of matrix metalloproteinases 2 and 9 via a decrease in Mn-SOD (manganese superoxide dismutase) activity [10]. Mitochondrial ROS production occurs at several sites in the respiratory chain, including complexes I and III. These major sites of ROS production both involve the low-molecular-mass redox shuttle CoQ (coenzyme Q). Decreased levels of CoQ are associated with increased ROS production and it is reasonable to suggest that such conditions will result in dysregulation of mitochondrial-dependent redox signalling [11]. Interestingly, decreased levels of CoQ in the kidneys have been reported in the rat model of STZ-induced diabetes [12]. As has been shown previously, the CoQ antioxidant system can be supplemented with a mitochondria-targeted analogue MitoQ (mitoubiquinone) [13]. This molecule is orally bioavailable, accumulates in many tissues in the body, including the kidney, and can protect organs from insults such as ischaemia/reperfusion, endothelial cell dysfunction, cardiac hypertrophy and sepsis [14–19]. We therefore hypothesized that treatment with MitoQ could protect mitochondrial redox signalling from hyperglycaemia-induced alterations and this would ameliorate diabetic nephropathy.
To test the potential role of mitochondria in diabetic nephropathy we used the genetic model of Type 1 diabetes, the Akita mouse (Ins2+/−AkitaJ mice). Akita mice develop hyperglycaemia because the A chain of mature insulin is mutated, resulting in misfolding of the insulin protein [20]. Symptoms in the heterozygous mutant mice include hyperglycaemia, hypoinsulinaemia, polydipsia and polyuria, beginning at around 3–4 weeks of age. Akita mice undergo progressive organ dysfunction in the kidney and retina after the onset of hyperglycaemia, exhibiting increased proteinuria, vascular permeability, increased apoptosis and alterations in the retina [21–23]. Mitochondria in this model show morphological changes, up-regulation of some tricarboxylic acid cycle enzymes including aconitase, but no major changes in the respiratory chain complexes or respiratory function [24,25]. In the present study we found increased proteinuria and tubulointerstitial fibrosis in the Akita mice at 26 weeks of age, providing a relevant model for testing the protective properties of MitoQ on mitochondrial redox signalling.
EXPERIMENTAL
Animals and treatments
Male Ins2+/−AkitaJ and wild-type (C57BL/6) mice (4–8 weeks old) were obtained from Jackson Laboratory (Bar Harbor, ME, U.S.A.) and were maintained on laboratory chow and water ad libitum until they were 14 weeks old. Blood glucose levels (using an Accu-Chek Advantage blood glucose meter; Roche Diagnostics) and body weight were determined prior to the treatment and every month thereafter. At 14 weeks of age MitoQ was administered to the experimental animals in the drinking water provided in dark bottles at the doses shown in Table 1 for 12 weeks. Assignment of animals for MitoQ treatment was made in such a way that the animals of different experimental groups were age-matched during the study. Both wild-type and Ins2+/−AkitaJ mice were provided with unrestricted access to food. The activity level, body weight and blood glucose level of the animals were monitored constantly. The volume of water consumed was measured and used to calculate the drug dosage received by the animals. The Ins2+/−AkitaJ mice consumed approx. 5-fold more water compared with the wild-type animals, and for this reason the concentration of MitoQ in the drinking water was adjusted to achieve approximately the same body-weight-independent dose. However, considerable variation occurred in the amount of water intake in the Ins2+/−AkitaJ mice, which resulted in some variation in the amount of MitoQ consumption in individual animals (Table 1). After feeding for 12 weeks, the experimental animals were killed under isoflurane anaesthesia (2% isoflurane in 100% oxygen using an isoflurane vaporizer) and blood and tissues were collected. Whole blood collected in heparinized tubes by cardiac puncture was centrifuged at 1000 g for 5 min to collect the plasma. Tissues collected were fixed in 4% (w/v) paraformaldehyde, flash-frozen in liquid nitrogen, or processed for the isolation of mitochondria. The plasma creatinine measurements were performed using ESI (electrospray ionization)–MS [26]. All the procedures were performed in accordance with recommendations in The Guide for the Care and Use of Laboratory Animals, and approved by the Institutional Animal Care and Use Committee at University of Alabama at Birmingham.
Table 1. Effects of MitoQ treatment on physiological parameters in the wild-type and Ins2+/−AkitaJ animals.
The values reflect the level of each parameter determined at the end of the study, except for the drug uptake which is shown as the average and range over the course of the 12 week treatment period. Mean values (n=8–9) were analysed by ANOVA and Newman–Keuls test and expressed (± S.E.M.). P≤0.05 relative to the wild-type untreated (*), the wild-type MitoQ treatment group (†) or the Ins2+/−AkitaJ untreated group (‡).
| Wild-type mice | Ins2+/−AkitaJ mice | |||
|---|---|---|---|---|
| Parameter | Untreated | MitoQ | Untreated | MitoQ |
| Body weight (g) | 26.88±0.73 | 29.31±1.21 | 22.19±1.03* | 21.25±0.34† |
| Kidney weight/body weight (g/g) | 0.0078±0.0004 | 0.007±0.0002 | 0.0103±0.001* | 0.010±0.0004† |
| Heart weight/body weight (g/g) | 0.0048±0.0003 | 0.005±0.0003 | 0.0056±0.001 | 0.005±0.0004 |
| Water consumption (ml/day) | 2.90±0.05 | 2.86±0.08 | 21.81±1.9* | 17.61±1.5† |
| MitoQ (mg/kg of body weight per day) | – | 2.61±0.13 (2.34–2.79) | – | 4.34±0.32† (1.93–6.61) |
| Blood glucose (mg/dl) | 163.56±17.7 | 173.78±16.3 | 681.78±82.6* | 604.2±73.7† |
| HbA1c (%) | 4.37±0.076 | 4.34±0.065 | 12.47±0.49* | 10.34±0.35†‡ |
| Plasma insulin (ng/ml) | 0.36±0.052 | 0.45±0.04 | 0.14±0.17* | 0.16±0.017† |
| Plasma creatinine (mg/dl) | 0.099±0.003 | 0.088±0.01 | 0.094±0.010 | 0.088±0.009 |
Renal imaging
Imaging of 99mTc (technetium-99m)–MAG3 (mercaptoacetyltriglycine) and 99mTc–DTPA (diethylenetriaminepenta-acetic acid) in the experimental animals was performed on separate days, as described previously [27], to determine the renal function at 1 week before killing (25 weeks of age). Briefly, mice were hydrated 30 min prior to the imaging with an injection of 0.5 ml of sterile saline (intraperitoneally). After 30 min, three mice were placed on a parallel-hole collimator, linked to an Anger gamma camera (420/550 Mobile Radioisotope Gamma camera; Technicare) with a central isoflurane anaesthesia delivery system. Whole-body imaging of the mice was initiated with a tail-vein bolus injection of either 99mTc-MAG3 or 99mTc-DTPA (Birmingham Nuclear Pharmacy), at 1.0 mCi per 25 g of body weight, and dynamic acquisition was performed using Numa Station. Real-time planar images were collected for 20 min, with 125 frames collected at one frame every 10 s. Images were analysed using a modified version of the NIH Image software (NucMed-Image, Mark D. Wittry, St. Louis University, St. Louis, MO, U.S.A.). ROIs (regions of interest) were drawn separately around the whole body, left kidney, right kidney, urinary bladder and a region between the heart and left kidney (for background correction). The total pixels and the counts per pixel in each ROI was calculated and expressed relative to the whole body. Using this method, the amount of the tracer present in each compartment as a percentage of the total injected dose was calculated and plotted against time. The AUC (area under the curve) for the first 10 min after injection, the time taken to reach the peak tracer levels and the peak value were calculated separately for each kidney and the bladder.
Urine collection and estimation of urine albumin
Urine from the experimental animals was collected for 24 h on ice using diuresis cages (Tecniplast) and the volumes were determined. Urine albumin levels were determined using a mouse-specific ELISA system for urine albumin (EMA3201-1; AssayPro) and was calculated as the total amount of albumin excreted per day.
Immunohistochemistry and electron microscopy
The renal tissues were collected and fixed in 4% (w/v) paraformaldehyde solution for 24 h at room temperature (23 °C). Paraffin-embedded tissues were sectioned (5 μm) and stained with haematoxylin/eosin, Masson's trichrome and PASR (Picric Acid Sirius Red). Immunoreactivity was visualized using Alexa Fluor® 488 goat anti-rabbit (Invitrogen), and primary anti-β-catenin and anti-phospho-Smad2/3 antibodies (Abcam, Millipore). Tissues slices were blocked using goat serum and slides lacking primary antibody were used as controls. Slides were imaged using Simple PCI software on a Leica DMRXA2 Microscope fitted with a charge-coupled device camera (Hamamatsu). Fluorescently stained slides were quantified based on the intensity of positive stained nuclei. PASR- and fluorescent-stained renal sections were imaged (400× total magnification) and quantified using Image-Pro plus (Media Cybernetics). A one-half area from the transverse sections of the kidney was selected from each sample for the quantification of the percentage of the fibrotic area in the PASR images. Ultra-thin resin-embedded kidney sections (90 nm thick) were mounted on to copper grids and imaged using a transmission electron microscope (model H-7650-II; Hitachi) equipped with an AMT digital camera (Danvers) and the images were analysed for GBM (glomerular basement membrane) thickening using the Simple PCI software.
Mitochondrial isolation and respiration
Mitochondria were isolated from the kidney with homogenization followed by multiple centrifugations at 700 g, 7800 g and 10000 g in ice-cold isolation buffer containing 50 mM Tris/HCl, pH 7.4, 250 mM sucrose, 5 mM EDTA and protease inhibitors as described previously [28]. Respiratory capacity of isolated mitochondria was assessed in a Hansatech Oxygraph in mitochondrial respiration medium (2.5 mM Hepes, pH 7.4, 120 mM KCl, 5 mM KH2PO4, 1 mM EGTA, 10.7 mM MgCl2 and 2.5 mM sucrose) and 5 mM succinate/0.5 mM ADP at 37 °C.
Measurement of mitochondrial complex and citrate synthase activities
Mitochondria isolated from kidney were frozen in liquid nitrogen and stored at −80 °C. Immediately before the assay, mitochondrial samples were suspended in 0.1M phosphate buffer with 0.2% lauryl maltiside (or for complex I in 0.025M phosphate buffer only), subjected to three freeze–thaw cycles in liquid nitrogen and vortex-mixed to ensure mitochondrial lysis. Mitochondrial complex I activity was measured spectrophotometrically (using a Beckman Coulter Spectrophotometer) as the rotenone-sensitive rate of NADH oxidation, and complex IV activity was measured as the cyanide-sensitive pseudo-first-order rate constant for the oxidation of reduced cytochrome c [29]. Mitochondrial citrate synthase activity was measured by the reduction of DTNB [5,5′-dithiobis-(2-nitrobenzoic acid)] by citrate synthase and using the coupled reaction with acetyl-CoA and oxaloacetate [29].
Statistical analysis
All results are expressed as means±S.E.M. An unpaired Student's t test was used to compare the control and treated groups. ANOVA and the Newman–Keuls test were used to compare the mean values for multiple group comparisons. All values were considered significant at P≤0.05.
RESULTS
MitoQ treatment did not alter the glycaemic status of diabetic animals
All the animals irrespective of the treatment group gained weight at similar rates, but wild-type mice were 20–25% heavier than the age-matched Ins2+/−AkitaJ mice and this was unaltered by drug treatment (Table 1). Ins2+/−AkitaJ mice at 12 weeks of age were hyperglycaemic, consistent with previous reports [22,30], and this was not affected by MitoQ treatment. In addition, the plasma insulin levels of these animals remained unchanged with drug treatment at the end of the study (Table 1). However, glycated haemoglobin levels in MitoQ-treated Ins2+/−AkitaJ animals demonstrated a marginal but statistically significant decrease after 12 weeks of treatment (Table 1).
Succinate-dependent respiration of isolated mitochondria from the kidney was assessed polarographically for all groups. As reported by others [24] no significant change between any of the groups was found for State 3 or 4 respiration rates (Table 2). RCRs (respiratory control ratios; State 3/State 4) did not change between any groups (Table 2). Activities of mitochondrial respiratory complex I and complex IV from kidney did not show any significant change between the experimental animals with or without MitoQ treatment.
Table 2. Effect of MitoQ treatment on mitochondrial activities.
The respiratory capacity of the mitochondria isolated from the kidneys of experimental animals was determined polarographically as described in the Experimental section. Activities of mitochondrial respiratory chain complex I, complex IV and citrate synthase were measured using isolated mitochondria from the kidney. Results are means±S.E.M. (n=8, per group). Statistical comparisons were performed with ANOVA and Newman–Keuls test.
| Wild-type mice | Ins2+/−AkitaJ mice | |||
|---|---|---|---|---|
| Actvity | Untreated | MitoQ | Untreated | MitoQ |
| State 4 (nmol O2/min per mg) | 61.58±5.27 | 64.40±3.25 | 68.24±3.51 | 71.50±3.33 |
| State 3 (nmol O2/min per mg) | 111.49±14.07 | 126.99±6.01 | 142.54±7.85 | 151.75±7.85 |
| RCR | 1.75±0.11 | 1.98±0.05 | 2.09±0.04 | 2.11±0.05 |
| Complex I (nmol/min per mg) | 484±42 | 500±38 | 464±21 | 478±35 |
| Complex IV (k/s per mg) | 54.2±7.4 | 45±7.6 | 57±7.3 | 53.7±3.0 |
| Citrate synthase (nmol/min per mg) | 0.167±0.012 | 0.165±0.011 | 0.165±0.012 | 0.158±0.007 |
MitoQ prevents diabetes-induced tubular dysfunction
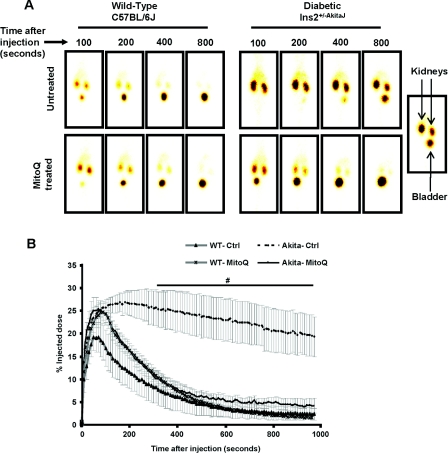
Assessment of renal function in vivo was performed by measuring the clearance of 99mTc–MAG3. This is a sensitive and extensively used method for the determination of tubular function [27,32]. The tracer accumulates in the kidneys >55% with the first pass and is then cleared without any significant reabsorption. An increase in the time taken for clearance can be considered to be indicative of a decrease in renal function. Representative images from the gamma camera at 100 s after injection of the 99mTc–MAG3 are shown in Figure 1(A) (left-hand panel), showing the initial accumulation in the kidney followed by a rapid clearance to the bladder over the next 6–8 min. MitoQ treatment had no significant impact on this process in wild-type animals. In contrast, the tracer was retained in the kidney over approx. 15 min in the Ins2+/−AkitaJ mice, consistent with a profound tubular dysfunction (Figure 1A, right-hand panel). MitoQ treatment of the Ins2+/−AkitaJ mice resulted in a rate of 99mTc–MAG3 clearance similar to control wild-type animals (Figure 1B).
Figure 1. MitoQ treatment prevents renal tubular dysfunction in Ins2+/−AkitaJ mice as determined by 99mTc–MAG3 clearance.
(A) Real-time images of the mice after the tail-vein injection of the radioactive tracer 99mTc–MAG3. Upon injection the tracer accumulates and then clears out of the kidney to the urinary bladder. The presence of radioactivity is detected using a gamma camera. (B) Means±S.E.M. (n=5–8) of the original traces of the dye accumulation and clearance profile in the kidneys relative to the amount of the dye present in the whole body from non-diabetic wild-type (WT) and diabetic Ins2+/−AkitaJ mice (Akita), with (MitoQ) or without (Ctrl) MitoQ treatment. Statistical comparison was performed with ANOVA and the Newman–Keuls test. #P≤0.05 relative to the MitoQ-treated Ins2+/−AkitaJ group.
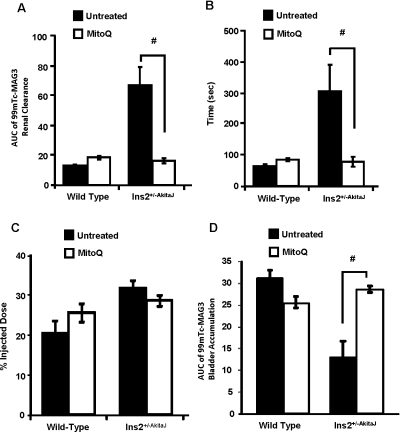
Further analysis of the 99mTc–MAG3 renal clearance profile was performed by determining: (i) AUCs up to 10 min from the time of injection; (ii) the peak value of the percentage injected dose; and (iii) time taken to reach peak accumulation. AUC provides an assessment of the overall performance of the kidney and it correlates inversely with the rate of clearance of the tracer. The AUC was much greater for 99mTc–MAG3 renal clearance for the Ins2+/−AkitaJ mice compared with the wild-type controls, consistent with renal dysfunction (Figure 2A) and was restored to normal values in response to MitoQ treatment. The time to reach peak value for the 99mTc–MAG3 renal clearance profile was dependent upon the relative rate of accumulation of the tracer in the kidney compared with the rate of clearance to the bladder and was increased in the Ins2+/−AkitaJ mice (Figure 2B). MitoQ treatment prevented this renal functional defect in the diabetic animals (Figure 2B). Interestingly, there were no significant differences in the maximal level of accumulation of the tracer under any condition, suggesting that renal dysfunction is associated primarily with impaired tubular filtration (Figure 2C). In support of this conclusion accumulation of 99mTc–MAG3 in the bladder was delayed in the Ins2+/−AkitaJ and restored by MitoQ (Figure 2D).
Figure 2. Protection of renal tubular function by MitoQ in Ins2+/−AkitaJ mice.
(A) Quantification of the 99mTc–MAG3 renal clearance profile calculated as the AUC from individual animals up to 600 s from the tracer administration. (B) Time taken to reach the peak accumulation and (C) peak tracer accumulation value of the 99mTc–MAG3 renal clearance analysis. (D) Accumulation of the tracer in the urinary bladder was also determined as the AUC up to 10 min from the time of injection. Results are means±S.E.M. (n=5–8). Statistical comparison was performed with ANOVA and the Newman–Keuls test. #P≤0.05.
MitoQ-dependent protection of glomerular function of diabetic kidneys
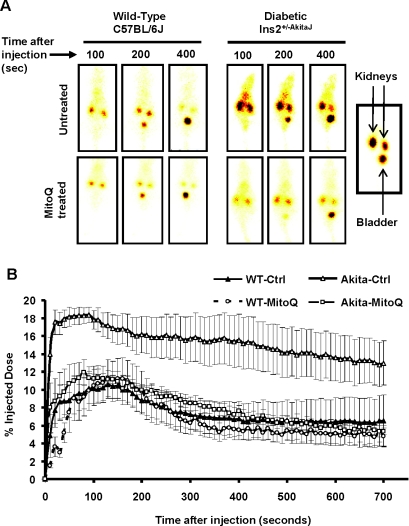
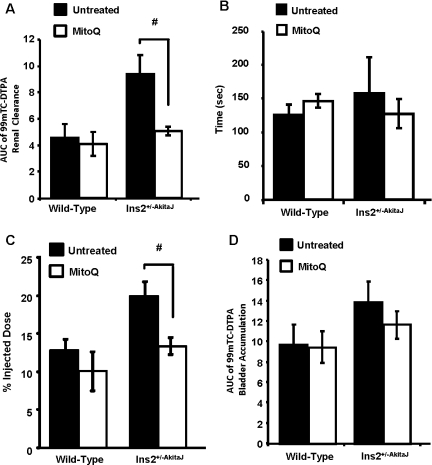
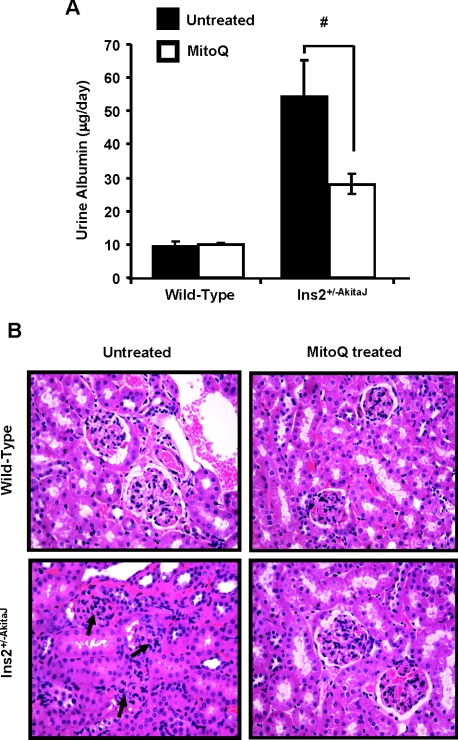
Using the 99mTc–DTPA clearance assay for glomerular function [33], our observations suggest that MitoQ does not change the profile for uptake and clearance in the wild-type animals. In the case of the Ins2+/−AkitaJ mice there was significant retention of the tracer, which was restored to control levels by MitoQ (Figures 3A and 3B). MitoQ treatment prevented development of glomerular dysfunction in the diabetic animals, and the treatment did not affect the glomerular function in wild-type animals. Using the same method of analysis established for 99mTc–MAG3 to the 99mTc–DTPA clearance profile, we found that the AUC for the tracer was increased in the Ins2+/−AkitaJ mice and restored to control levels by MitoQ (Figure 4A). In the untreated experimental groups the time taken to reach the peak value was significantly higher for Ins2+/−AkitaJ mice compared with the wild-type animals. MitoQ treatment significantly decreases 99mTc–DTPA peak accumulation in Ins2+/−AkitaJ mice (Figure 4C), but did not modify the time taken to attain the peak (Figure 4B), implying that the tracer accumulates at a decreased rate. However, bladder accumulation of 99mTc–DTPA was not altered in any of the experimental groups (Figure 4D). Albuminuria is a reliable marker of renal involvement in diabetic kidney disease. MitoQ treatment attenuated urine albumin excretion in diabetic animals (Figure 5A). Mass spectrometric determination of plasma creatinine [26] did not show any significant change among the experimental groups at 26 weeks (Table 1).
Figure 3. MitoQ protects against diabetic glomerular dysfunction in Ins2+/−AkitaJ mice as determined by the 99mTc-DTPA clearance.
(A) Representative real-time images of the whole animal at various time points during the study are shown. (B) Means±S.E.M. (n=4–6) of the profiles demonstrating the uptake and clearance phases of the 99mTc–DTPA radioactive tracer in the right kidney after injection through the tail vein by analysing the real-time images from non-diabetic wild-type (WT) and diabetic Ins2+/−AkitaJ mice (Akita), with (MitoQ) or without (Ctrl) MitoQ treatment.
Figure 4. Preservation of glomerular function by MitoQ in Ins2+/−AkitaJ mice.
(A) Quantification of the 99mTc–DTPA renal clearance profile calculated as the AUC from individual animals up to 10 min from the tracer administration. (B) Time taken to reach peak accumulation of tracer in the kidney. (C) The amount of the radioactive tracer at the time of peak accumulation in the right kidney after 99mTc–DTPA injection was calculated. (D) The peak accumulation values of the DTPA clearance analysis were determined from the profile curve plotted with the percentage injected dose against time. Results are means±S.E.M (n=4–6). Statistical comparison was performed with ANOVA and the Newman–Keuls test. #P≤0.05.
Figure 5. MitoQ treatment decreases albuminuria in diabetic Ins2+/−AkitaJ mice.
(A) The albumin levels of the 24-h-urine samples were estimated using the mouse urine albumin ELISA kit and the total amount of albumin excreted per day was measured. Results are means±S.E.M. (n=6–8) as analysed by ANOVA and the Newman–Keuls test. #P≤0.05. (B) Renal tissue morphology in diabetic Ins2+/−AkitaJ mice was significantly improved by oral MitoQ treatment. Representative images of haematoxylin/eosin-stained renal sections show significant improvement in diabetes-induced glomerular injury in Ins2+/−AkitaJ mice.
Effects of MitoQ treatment on renal tissue morphology in Ins2+/−AkitaJ mice
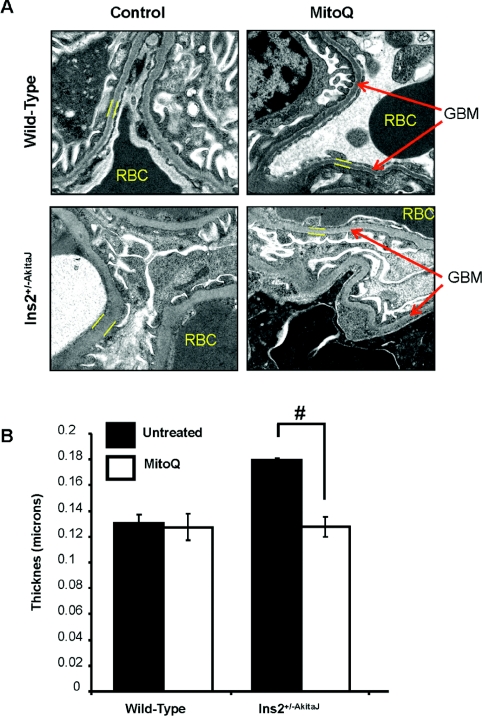
Histological analysis of the kidney tissue sections demonstrated the typical pathological changes of diabetic nephropathy in Ins2+/−AkitaJ mice compared with the wild-type animals (Figure 5B, left panels). As shown in the lower right-hand panel of Figure 5(B), the renal histology of the MitoQ-treated Ins2+/−AkitaJ mice resembled that of the wild-type controls without any indication of diabetes-induced kidney damage. No histological evidence of toxicity was observed in association with MitoQ treatment in wild-type animals. GBM thickening is a potential cause of decreased glomerular filtration in diabetic kidney disease [34]. Transmission electron microscopy demonstrated increased GBM thickness in Ins2+/−AkitaJ mice compared with wild-type controls (Figures 6A and 6B). MitoQ treatment prevented GBM thickening in diabetic mice and did not have any effect on the wild-type animals.
Figure 6. MitoQ decreases GBM thickening in Akita mice.
(A) Representative transmission electron micrographs (viewed at 6500×) of the renal tissues demonstrating thickening of the GBM in Akita mice compared with the wild-type controls. MitoQ treatment prevented GBM thickening in Akita mice. (B). Quantification of the GBM thickening using Simple PCI software. The mean thickness (n=3, per group) was calculated, analysed by ANOVA and the Newman–Keuls test and expressed (± S.E.M). #P≤0.05.
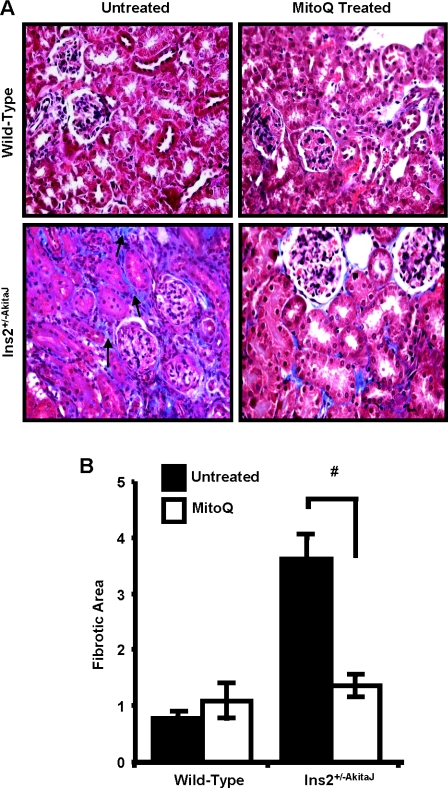
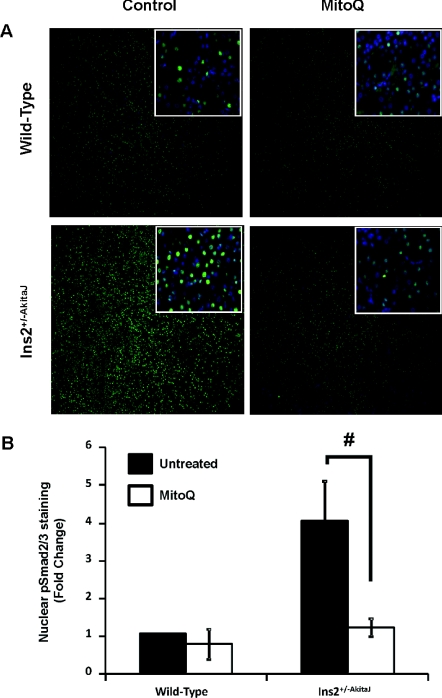
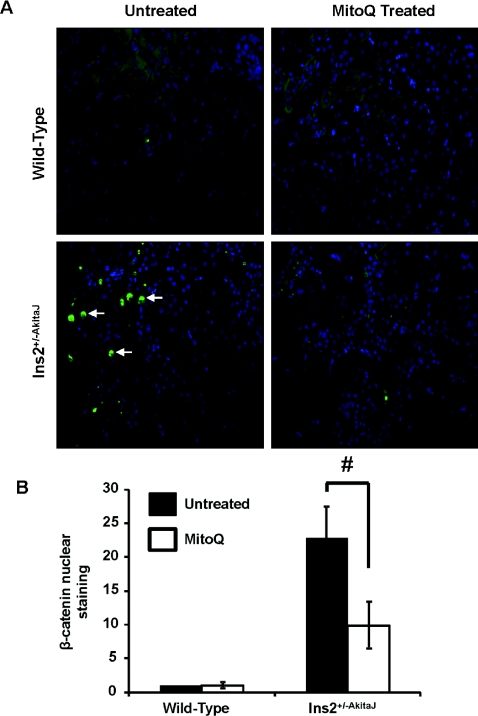
Chronic hyperglycaemia associated with diabetes induces fibrotic changes mediated by inflammatory cytokines, growth factors, such as TGFβ (transforming growth factor β) and Wnt/β-catenin signalling. Staining of diabetic renal tissues with Masson's Trichrome (Figure 7A) and quantification of PASR staining (Figure 7B) showed the tubulointerstitial fibrosis in Ins2+/−AkitaJ mice was similar to that observed in diabetic patients with kidney disease [35]. Treatment with MitoQ for 12 weeks significantly decreased interstitial fibrosis in the diabetic animals. Investigation of the possible mediators of the hyperglycaemia-induced fibrotic response suggested the involvement of TGFβ and Wnt signalling. Localization of phospho-Smad2/3 (Figure 8) and β-catenin in the nuclei (Figure 9) of diabetic tissues is consistent with activation of these signalling pathways in the Ins2+/−AkitaJ mice.
Figure 7. MitoQ treatment decreases diabetes-induced renal interstitial fibrosis.
(A) Paraffin-embedded sections were prepared from paraformaldehyde-fixed tissues and stained with Masson's Trichrome for tissue collagen and imaged using Simple PCI software. (B) PASR-stained renal sections were imaged and quantified using Image-Pro plus. Average fibrotic area values were determined from one-half of the kidney cross-section (n=8–9 per group), means values were analysed by ANOVA and the Newman–Keuls test test and expressed (± S.E.M). #P≤0.05.
Figure 8. MitoQ treatment inhibits phospho-Smad2/3-mediated signalling in the diabetic kidney.
(A) Paraffin-embedded sections were prepared from paraformaldehyde-fixed tissues and stained with anti-phopho-Smad2/3 antibody linked to Alexa Fluor® 488 (green); the nuclei were stained with DAPI (4′,6-diamidino-2-phenylindole; blue). Sections were imaged using Simple PCI software. (B) Images were quantified for phospho-Smad2/3 localization in the nucleus using Simple PCI software. Mean green intensities (n=6, per group) were calculated, analysed by ANOVA and the Newman–Keuls test and expressed (± S.E.M). #P≤0.05.
Figure 9. MitoQ treatment decreases β-catenin nuclear translocation in the Ins2+/−AkitaJ kidney.
(A) Representative images demonstrating translocation of activated β-catenin in the nucleus. Immunohistochemical analysis showed increased β-catenin in the nucleus of diabetic mice when probed with an anti-β-catenin antibody linked to Alexa Fluor® 488 (green) and DAPI (4′,6-diamidino-2-phenylindole) counter-stain (blue). (B) Quantification of immunohistochemical images showed a significant increase in nuclear β-catenin intensity in diabetic mice compared with the wild-type controls, which was significantly decreased with MitoQ treatment (n=6). Mean green intensities (n=6, per group) were calculated, analysed by ANOVA and the Newman–Keuls test and expressed (±S.E.M). #P≤0.05.
DISCUSSION
Diabetic kidney disease is a chronic pathological condition that has a limited number of effective therapies [36,37]. Indirect approaches of strict glycaemic control and maintenance of normal blood pressure delay the progression of the disease [36,37]. Despite these measures, a significant number of cases progress to diabetic nephropathy, which is characterized histologically by tubulointerstitial fibrosis, diffuse or nodular glomerulosclerosis and variable degrees of hyaline arteriolosclerosis. Mechanisms including changes in glomerular haemodynamics due to altered vascular resistance, inflammation and augmented formation of AGEs (advanced glycation end-products) have been suggested in the pathogenesis [35]. Increased synthesis of TGFβ and an abnormal renin–angiotensin system have also been proposed to be involved in the progression of diabetic nephropathy [36]. Changes in the β-catenin signalling pathway are now also thought to play a pro-fibrotic role in a number of pathologies including diabetes [38]. Several studies have shown that altered mitochondrial function occurs in the development of diabetic kidney disease, but the contribution to the pathophysiological changes, particularly fibrosis, associated with diabetes is not clear [39].
In vitro and in vivo studies have shown that overexpression of mitochondrial antioxidant enzymes in renal proximal tubular cells and in the retina protect against oxidant-induced damage in experimental hyperglycaemia [40,41]. Evidence from the cancer and cardiovascular fields suggest that oxidant production from the mitochondria appears to play a role in the cell signalling associated with tissue remodelling, proliferation and angiogenesis [9,42]. For these reasons we hypothesized that a mitochondrially targeted antioxidant that can modulate the production of ROS from enzymes associated with CoQ may have beneficial effects in diabetic nephropathy. Of the potential compounds available the ubiquinone analogue MitoQ has attracted particular interest since it is orally bioavailable, has low toxicity and reaches concentrations of 200–700 pmol per g of wet weight in the tissue of a number of organs, including the kidney [43]. For example, in animal models MitoQ treatment has been shown to prevent ischaemia/reperfusion-induced cardiac dysfunction [17,44], decrease inflammation in a LPS (lipopolysaccharide)–peptidoglycan-induced rat sepsis model [14] and to protect the heart against doxorubicin toxicity [15]. It has been shown that MitoQ treatment was also protective against endothelial cell dysfunction in vitro and in vivo [19,45]. Importantly, MitoQ has been used in Phase I and Phase II clinical trials for Parkinson's disease and hepatitis-C-induced liver damage, and is well-tolerated in human and animal subjects [46,47].
In the present study the Ins2+/−AkitaJ mice were selected as a model of Type 1 diabetes to test the potential benefits of MitoQ therapy. This model develops insulin resistance over time and has many of the characteristics of chronic hyperglycaemia associated with both Type 1 and 2 diabetes [22,25]. Ins2+/−AkitaJ mice have been used in several studies and are reported to have increased oxidative stress in the kidney [30,48] and abnormal mitochondrial morphology in the diabetic kidney, but no change in volume density and number [24]. Decreased levels of SOD1 and SOD3, but not SOD2 exacerbate diabetic nephropathy in these mice and the disease progression was prevented using the SOD mimetic tempol, supporting a role for the dysregulation of ROS in diabetic nephropathy [49]. Recent studies have reported the attenuation of diabetic kidney disease using recombinant angiotensin-converting enzyme treatment [50] and cyclo-oxygenase 2 inhibitor treatment, which are both pathways known to generate increased levels of ROS [51].
Oral MitoQ treatment was sustained over a period of 11–12 weeks in wild-type control and Ins2+/−AkitaJ mice, after which a number of end-points relevant to diabetes were determined. The pharmacological delivery of MitoQ was adjusted based on the water intake of the animals for a body-weight-independent dose, due to substantially increased water consumption by the Ins2+/−AkitaJ mice. However, when corrected for body weight the control mice were heavier, resulting in a slightly lower dose of MitoQ for the controls. MitoQ treatment resulted in lower HbA1c levels in the Ins2+/−AkitaJ mice, however the changes were modest and unlikely to account for the prevention of renal pathology with MitoQ treatment.
Histochemical staining of the kidney tissue sections revealed mesangial expansion and tubulointerstitial fibrosis. MitoQ treatment significantly prevented these tissue pathologies associated with diabetic nephropathy. Assessment of kidney function required the use of sensitive non-toxic and minimally invasive techniques, and for this we used 99mTc–MAG3 and 99mTc–DTPA [32]. Increased clearance of these tracers was evident for MitoQ-treated Ins2+/−AkitaJ mice, consistent with MitoQ-mediated protection of renal tubular and glomerular function. As demonstrated in the present study, and by others [34], Ins2+/−AkitaJ mice have pronounced GBM thickening in the peripheral capillary loops, which was prevented by MitoQ (Figure 6). Prevention of GBM thickening with MitoQ treatment is consistent with the improvement in glomerular clearance function as assessed with 99mTc–DTPA. Although plasma creatinine remained unchanged, the decreased urine albumin in Ins2+/−AkitaJ mice with MitoQ treatment also indicates that renal function was improved. This can be explained on the basis of reports in animal models of nephropathy that proteinuria is a more sensitive marker of kidney disease compared with plasma creatinine measurements [52]. Ins2+/−AkitaJ mice demonstrated mesangial expansion, tubulointerstitial fibrosis and decreased renal function, which closely reflects human diabetic nephropathy [35]. The decreased mesangial expansion, interstitial fibrosis and GBM thickening observed in the MitoQ-treated Ins2+/−AkitaJ animals compared with the untreated diabetic animals suggests that the MitoQ treatment modulates the profibrotic signalling pathways in the diabetic kidney.
Several pathophysiological characteristics of diabetes including hyperglycaemia, hypertension, mechanical stress and ROS production can activate the expression of the profibrotic cytokine TGFβ. The signalling mediated by TGFβ occurs by phosphorylation and nuclear translocation of Smad2/3, resulting in the synthesis of proteins involved in extracellular matrix accumulation [53]. Several studies have demonstrated the stimulation of TGFβ-mediated signalling results in increased production and accumulation of extracellular matrix proteins, and activation of protease inhibitors. In addition, TGFβ induces its own synthesis and stimulates the proliferation of tubulointerstitial fibroblasts, resulting in the amplification of the fibrotic response. Demonstration of tubulointerstitial fibrosis (Figure 7), and increased phosphorylation and nuclear translocation of Smad2/3 (Figure 8A and 8B), confirms the activation of TGFβ-mediated profibrotic signalling in the diabetic animals. Interestingly, MitoQ inhibited the nuclear translocation of phospho-Smad2/3. In addition, the Wnt/β-catenin signalling has been shown to play a crucial role as a profibrotic signal in a number of pathologies, and recently has been implicated in diabetes-induced retinal fibrosis [38]. The majority of Wnt/β-catenin studies have been in the fields of embryogenesis and cancer, and it has shown to have an important role in the EMT (epithelial-to-mesenchymal transition) [54]. A number of studies have implicated EMT as a mechanism of fibrotic deposition in a range of insults including diabetes [54]. Wnt/β-catenin has been shown to exert different effects in the kidney, e.g. protective effects on mesangial cells and yet profibrotic effects in tubular cells [55,56]. The Wnt/β-catenin pathway is redox-sensitive and is therefore potentially sensitive to mitochondrial oxidants [57]. In support of this argument we found that MitoQ suppressed β-catenin translocation to the nucleus (Figure 9).
Since MitoQ was administered orally it is possible it may exert its effects in several different cell types and for this reason the mechanism(s) of action will require further investigation. There are, however, several possibilities which can be suggested on the basis of previous studies with this compound. In isolated mitochondria it has been shown that MitoQ can be converted into mitoubiquinol by complex II, but is not readily oxidized by complex III or reduced by complex I [13]. This suggests it would potentially change the redox balance and change mitochondrial redox signalling, since this is an important site of superoxide and hydrogen peroxide formation in the mitochondrion. Since mitochondrial respiratory chain proteins are not significantly altered in the kidney mitochondria from the Akita mice [24], and in the present study MitoQ treatment did not alter the respiratory capacity of mitochondria, it is unlikely that protection of these proteins is important in the mechanism leading to prevention of diabetic nephropathy.
In conclusion, we report that the Type 1 diabetic model of Ins2+/−AkitaJ mice display both renal tubular and glomerular defects associated with diabetes, which are attenuated by oral administration of MitoQ. Histological evidence suggests that the improvement of renal function in MitoQ-treated Ins2+/−AkitaJ mice correlates with attenuation of tubulointerstitial fibrosis. Diabetes-induced alterations in the cellular redox status could have an impact upon the redox signalling pathways that control tissue remodelling, which maybe ameliorated by MitoQ. Taken together these findings support the hypothesis that dysregulation of mitochondrial signalling plays a key role in diabetic kidney disease.
AUTHOR CONTRIBUTION
Balu Chacko, Colin Reily, Anup Srivastava, Michelle Johnson, Elena Ulasova, Kurt Zinn, Anupam Agarwal and Victor Darley-Usmar designed the research. Balu Chacko, Colin Reily, Anup Srivastava, Michelle Johnson, Yaoza Ye and Elena Ulasova performed the research and analysed the data. Balu Chacko, Colin Reily and Victor Darley-Usmar wrote the paper. Michael Murphy and Balaraman Kalyanaraman provided MitoQ for the study and reviewed the manuscript.
ACKNOWLEDGEMENT
The authors thank Jeff Dubuisson for excellent technical assistance.
FUNDING
This study was supported by the National Institutes of Health [grant number DK075865]; the UAB-UCSD O'Brien Core Center for Acute Kidney Injury [grant number NIH/NIDDK 1P30 DK 079337]; and the UAB Small Animal Imaging shared facility [grant number P30CA013148].
References
- 1.US Renal Data System. Annual Data Report. Bethesda, MD: The National Institutes of Health, National Institute of Diabetes and Digestive and Kidney Diseases; 2008. [Google Scholar]
- 2.Ayodele O. E., Alebiosu C. O., Salako B. L. Diabetic nephropathy: a review of the natural history, burden, risk factors and treatment. J. Natl. Med. Assoc. 2004;96:1445–1454. [PMC free article] [PubMed] [Google Scholar]
- 3.Kanwar Y. S., Wada J., Sun L., Xie P., Wallner E. I., Chen S., Chugh S., Danesh F. R. Diabetic nephropathy: mechanisms of renal disease progression. J. Exp. Med. 2008;233:4–11. doi: 10.3181/0705-MR-134. [DOI] [PubMed] [Google Scholar]
- 4.Brownlee M. Biochemistry and molecular cell biology of diabetic complications. Nature. 2001;414:813–820. doi: 10.1038/414813a. [DOI] [PubMed] [Google Scholar]
- 5.Green K., Brand M. D., Murphy M. P. Prevention of mitochondrial oxidative damage as a therapeutic strategy in diabetes. Diabetes. 2004;53(Suppl. 1):S110–S118. doi: 10.2337/diabetes.53.2007.s110. [DOI] [PubMed] [Google Scholar]
- 6.Coughlan M. T., Thorburn D. R., Penfold S. A., Laskowski A., Harcourt B. E., Sourris K. C., Tan A. L. Y., Fukami K., Thallas-Bonke V., Nawroth P. P., et al. RAGEinduced cytosolic ROS promote mitochondrial superoxide generation in diabetes. J. Am. Soc. Nephrol. 2009;20:742–752. doi: 10.1681/ASN.2008050514. [DOI] [PMC free article] [PubMed] [Google Scholar]
- 7.Rosca M. G., Mustata T. G., Kinter M. T., Ozdemir A. M., Kern T. S., Szweda L. I., Brownlee M., Monnier V. M., Weiss M. F. Glycation of mitochondrial proteins from diabetic rat kidney is associated with excess superoxide formation. Am. J. Physiol. Renal Physiol. 2005;289:F420–F430. doi: 10.1152/ajprenal.00415.2004. [DOI] [PubMed] [Google Scholar]
- 8.Singh K. K. Mitochondria damage checkpoint, aging, and cancer. Ann. N.Y. Acad. Sci. 2006;1067:182–190. doi: 10.1196/annals.1354.022. [DOI] [PubMed] [Google Scholar]
- 9.Weinberg F., Hamanaka R., Wheaton W. W., Weinberg S., Joseph J., Lopez M., Kalyanaraman B., Mutlu G. M., Budinger G. R., Chandel N. S. Mitochondrial metabolism and ROS generation are essential for Kras-mediated tumorigenicity. Proc. Natl. Acad. Sci. U.S.A. 2010;107:8788–8793. doi: 10.1073/pnas.1003428107. [DOI] [PMC free article] [PubMed] [Google Scholar]
- 10.Nelson K. K., Melendez J. A. Mitochondrial redox control of matrix metalloproteinases. Free Radical Biol. Med. 2004;37:768–784. doi: 10.1016/j.freeradbiomed.2004.06.008. [DOI] [PubMed] [Google Scholar]
- 11.Rodriguez-Hernandez A., Cordero M. D., Salviati L., Artuch R., Pineda M., Briones P., Gomez Izquierdo L., Cotan D., Navas P., Sanchez-Alcazar J. A. Coenzyme Q deficiency triggers mitochondria degradation by mitophagy. Autophagy. 2009;5:19–32. doi: 10.4161/auto.5.1.7174. [DOI] [PubMed] [Google Scholar]
- 12.Wold L. E., Muralikrishnan D., Albano C. B., Norby F. L., Ebadi M., Ren J. Insulin-like growth factor I (IGF-1) supplementation prevents diabetes-induced alterations in coenzymes Q9 and Q10. Acta Diabetol. 2003;40:85–90. doi: 10.1007/s005920300010. [DOI] [PubMed] [Google Scholar]
- 13.James A. M., Cocheme H. M., Smith R. A. J., Murphy M. P. Interactions of mitochondria-targeted and untargeted ubiquinones with the mitochondrial respiratory chain and reactive oxygen species: implications for the use of exogenous ubiquinones as therapies and experimental tools. J. Biol. Chem. 2005;280:21295–21312. doi: 10.1074/jbc.M501527200. [DOI] [PubMed] [Google Scholar]
- 14.Lowes D. A., Thottakam B. M., Webster N. R., Murphy M. P., Galley H. F. The mitochondria-targeted antioxidant MitoQ protects against organ damage in a lipopolysaccharide-peptidoglycan model of sepsis. Free Radical Biol. Med. 2008;45:1559–1565. doi: 10.1016/j.freeradbiomed.2008.09.003. [DOI] [PubMed] [Google Scholar]
- 15.Chandran K. A. D., Migrino R. Q., Joseph J., McAllister D., Konorev E. A., Antholine W. E., Zielonka J., Srinivasan S., Avadhani N. G., Kalyanaraman B. Doxorubicin inactivates myocardial cytochrome c oxidase in rats: cardioprotection by Mito-Q. Biophys. J. 2009;96:1388–1398. doi: 10.1016/j.bpj.2008.10.042. [DOI] [PMC free article] [PubMed] [Google Scholar]
- 16.Murphy M. P., Smith R. A. Targeting antioxidants to mitochondria by conjugation to lipophilic cations. Annu. Rev. Pharmacol. Toxicol. 2007;47:629–656. doi: 10.1146/annurev.pharmtox.47.120505.105110. [DOI] [PubMed] [Google Scholar]
- 17.Adlam V. J., Harrison J. C., Porteous C. M., James A. M., Smith R. A. J., Murphy M. P., Sammut I. A. Targeting an antioxidant to mitochondria decreases cardiac ischemia–reperfusion injury. FASEB J. 2005;19:1088–1095. doi: 10.1096/fj.05-3718com. [DOI] [PubMed] [Google Scholar]
- 18.Brown S. E., Ross M. F., Sanjuan-Pla A., Manas A. R., Smith R. A., Murphy M. P. Targeting lipoic acid to mitochondria: synthesis and characterization of a triphenylphosphonium-conjugated α-lipoyl derivative. Free Radical Biol. Med. 2007;42:1766–1780. doi: 10.1016/j.freeradbiomed.2007.02.033. [DOI] [PubMed] [Google Scholar]
- 19.Esplugues J. V., Rocha M., Nuñez C., Bosca I., Ibiza S., Herance J. R., Ortega A., Serrador J. M., D'Ocon P., Victor V. M. Complex I dysfunction and tolerance to nitroglycerin: an approach based on mitochondrial-targeted antioxidants. Circ. Res. 2006;99:1067–1075. doi: 10.1161/01.RES.0000250430.62775.99. [DOI] [PubMed] [Google Scholar]
- 20.Wang J., Takeuchi T., Tanaka S., Kubo S. K., Kayo T., Lu D., Takata K., Koizumi A., Izumi T. A mutation in the insulin 2 gene induces diabetes with severe pancreatic β-cell dysfunction in the Mody mouse. J. Clin. Invest. 1999;103:27–37. doi: 10.1172/JCI4431. [DOI] [PMC free article] [PubMed] [Google Scholar]
- 21.Gurley S. B., Mach C. L., Stegbauer J., Yang J., Snow K. P., Hu A., Meyer T. W., Coffman T. M. Influence of genetic background on albuminuria and kidney injury in Ins2+/C96Y (Akita) mice. Am. J. Physiol. Renal Physiol. 2010;298:F788–F795. doi: 10.1152/ajprenal.90515.2008. [DOI] [PMC free article] [PubMed] [Google Scholar]
- 22.Barber A. J., Antonetti D. A., Kern T. S., Reiter C. E. N., Soans R. S., Krady J. K., Levison S. W., Gardner T. W., Bronson S. K. The Ins2Akita mouse as a model of early retinal complications in diabetes. Invest. Ophthalmol. Visual Sci. 2005;46:2210–2218. doi: 10.1167/iovs.04-1340. [DOI] [PubMed] [Google Scholar]
- 23.Kakoki M., Kizer C. M., Yi X., Takahashi N., Kim H. S., Bagnell C. R., Edgell C. J., Maeda N., Jennette J. C., Smithies O. Senescence-associated phenotypes in Akita diabetic mice are enhanced by absence of bradykinin B2 receptors. J. Clin. Invest. 2006;116:1302–1309. doi: 10.1172/JCI26958. [DOI] [PMC free article] [PubMed] [Google Scholar]
- 24.Bugger H., Chen D., Riehle C., Soto J., Theobald H. A., Hu X. X., Ganesan B., Weimer B. C., Abel E. D. Tissue-specific remodeling of the mitochondrial proteome in type 1 diabetic Akita mice. Diabetes. 2009;58:1986–1997. doi: 10.2337/db09-0259. [DOI] [PMC free article] [PubMed] [Google Scholar]
- 25.Bugger H., Boudina S., Hu X. X., Tuinei J., Zaha V. G., Theobald H. A., Yun U. J., McQueen A. P., Wayment B., Litwin S. E., Abel E. D. Type 1 diabetic akita mouse hearts are insulin sensitive but manifest structurally abnormal mitochondria that remain coupled despite increased uncoupling protein 3. Diabetes. 2008;57:2924–2932. doi: 10.2337/db08-0079. [DOI] [PMC free article] [PubMed] [Google Scholar]
- 26.Huskova R., Chrastina P., Adam T., Schneiderka P. Determination of creatinine in urine by tandem mass spectrometry. Clin. Chim. Acta. 2004;350:99–106. doi: 10.1016/j.cccn.2004.07.007. [DOI] [PubMed] [Google Scholar]
- 27.Roberts J., Chen B., Curtis L. M., Agarwal A., Sanders P. W., Zinn K. R. Detection of early changes in renal function using 99mTc–MAG3 imaging in a murine model of ischemia–reperfusion injury. Am. J. Physiol. Renal Physiol. 2007;293:F1408–F1412. doi: 10.1152/ajprenal.00083.2007. [DOI] [PMC free article] [PubMed] [Google Scholar]
- 28.Bailey S. M., Andringa K. K., Landar A., Darley-Usmar V. M. Proteomic approaches to identify and characterize alterations to the mitochondrial proteome in alcoholic liver disease. Methods Mol. Biol. 2008;447:369–380. doi: 10.1007/978-1-59745-242-7_24. [DOI] [PMC free article] [PubMed] [Google Scholar]
- 29.Ramachandran A., Ceaser E., Darley-Usmar V. M. Chronic exposure to nitric oxide alters the free iron pool in endothelial cells: role of mitochondrial respiratory complexes and heat shock proteins. Proc. Natl. Acad. Sci. U.S.A. 2004;101:384–389. doi: 10.1073/pnas.0304653101. [DOI] [PMC free article] [PubMed] [Google Scholar]
- 30.Susztak K., Raff A. C., Schiffer M., Bottinger E. P. Glucose-induced reactive oxygen species cause apoptosis of podocytes and podocyte depletion at the onset of diabetic nephropathy. Diabetes. 2006;55:225–233. [PubMed] [Google Scholar]
- 31. Reference deleted.
- 32.Fritzberg A. R., Kasina S., Eshima D., Johnson D. L. Synthesis and biological evaluation of technetium-99m MAG3 as a hippuran replacement. J. Nucl. Med. 1986;27:111–116. [PubMed] [Google Scholar]
- 33.Assadi M., Eftekhari M., Hozhabrosadati M., Saghari M., Ebrahimi A., Nabipour I., Abbasi M. Z., Moshtaghi D., Abbaszadeh M., Assadi S. Comparison of methods for determination of glomerular filtration rate: low and high-dose Tc-99m-DTPA renography, predicted creatinine clearance method, and plasma sample method. Int. Urol. Nephrol. 2008;40:1059–1065. doi: 10.1007/s11255-008-9446-4. [DOI] [PubMed] [Google Scholar]
- 34.Kakoki M., Sullivan K. A., Backus C., Hayes J. M., Oh S. S., Hua K., Gasim A. M., Tomita H., Grant R., Nossov S. B., et al. Lack of both bradykinin B1 and B2 receptors enhances nephropathy, neuropathy, and bone mineral loss in Akita diabetic mice. Proc. Natl. Acad. Sci. U.S.A. 2010;107:10190–10195. doi: 10.1073/pnas.1005144107. [DOI] [PMC free article] [PubMed] [Google Scholar]
- 35.Alsaad K. O., Herzenberg A. M. Distinguishing diabetic nephropathy from other causes of glomerulosclerosis: an update. J. Clin. Pathol. 2007;60:18–26. doi: 10.1136/jcp.2005.035592. [DOI] [PMC free article] [PubMed] [Google Scholar]
- 36.Miyata T. Novel mechanisms and therapeutic options in diabetic nephropathy. Pol. Arch. Med. Wewn. 2009;119:261–264. [PubMed] [Google Scholar]
- 37.Whaley-Connell A., Sowers J. R., McCullough P. A., Roberts T., McFarlane S. I., Chen S. C., Li S., Wang C., Collins A. J., Bakris G. L. Diabetes mellitus and CKD awareness: the Kidney Early Evaluation Program (KEEP) and National Health and Nutrition Examination Survey (NHANES) Am. J. Kidney Dis. 2009;53:S11–S21. doi: 10.1053/j.ajkd.2009.01.004. [DOI] [PubMed] [Google Scholar]
- 38.Zhang B., Zhou K. K., Ma J. X. Inhibition of connective tissue growth factor overexpression in diabetic retinopathy by SERPINA3K via blocking the WNT/β-catenin pathway. Diabetes. 2010;59:1809–1816. doi: 10.2337/db09-1056. [DOI] [PMC free article] [PubMed] [Google Scholar]
- 39.Newsholme P., Haber E. P., Hirabara S. M., Rebelato E. L., Procopio J., Morgan D., Oliveira-Emilio H. C., Carpinelli A. R., Curi R. Diabetes associated cell stress and dysfunction: role of mitochondrial and non-mitochondrial ROS production and activity. J. Physiol. 2007;583:9–24. doi: 10.1113/jphysiol.2007.135871. [DOI] [PMC free article] [PubMed] [Google Scholar]
- 40.Munusamy S., Saba H., Mitchell T., Megyesi J. K., Brock R. W., Macmillan-Crow L. A. Alteration of renal respiratory Complex-III during experimental type-1 diabetes. BMC Endocr. Disord. 2009;9:2. doi: 10.1186/1472-6823-9-2. [DOI] [PMC free article] [PubMed] [Google Scholar]
- 41.Kowluru R. A., Kowluru V., Xiong Y., Ho Y. S. Overexpression of mitochondrial superoxide dismutase in mice protects the retina from diabetes-induced oxidative stress. Free Radical Biol. Med. 2006;41:1191–1196. doi: 10.1016/j.freeradbiomed.2006.01.012. [DOI] [PubMed] [Google Scholar]
- 42.Menon S. G., Sarsour E. H., Kalen A. L., Venkataraman S., Hitchler M. J., Domann F. E., Oberley L. W., Goswami P. C. Superoxide signaling mediates N-acetyl-L-cysteine-induced G1 arrest: regulatory role of cyclin D1 and manganese superoxide dismutase. Cancer Res. 2007;67:6392–6399. doi: 10.1158/0008-5472.CAN-07-0225. [DOI] [PubMed] [Google Scholar]
- 43.Smith R. A. J., Porteous C. M., Gane A. M., Murphy M. P. Delivery of bioactive molecules to mitochondria in vivo. Proc. Natl. Aca. Sci. U.S.A. 2003;100:5407–5412. doi: 10.1073/pnas.0931245100. [DOI] [PMC free article] [PubMed] [Google Scholar]
- 44.Neuzil J., Widén C., Gellert N., Swettenham E., Zobalova R., Dong L. F., Wang X. F., Lidebjer C., Dalen H., Headrick J. P., Witting P. K. Mitochondria transmit apoptosis signalling in cardiomyocyte-like cells and isolated hearts exposed to experimental ischemia–reperfusion injury. Redox Rep. 2007;12:148–162. doi: 10.1179/135100007X200227. [DOI] [PubMed] [Google Scholar]
- 45.Graham D., Huynh N. N., Hamilton C. A., Beattie E., Smith R. A., Cocheme H. M., Murphy M. P., Dominiczak A. F. Mitochondria-targeted antioxidant MitoQ10 improves endothelial function and attenuates cardiac hypertrophy. Hypertension. 2009;54:322–328. doi: 10.1161/HYPERTENSIONAHA.109.130351. [DOI] [PubMed] [Google Scholar]
- 46.Snow B. J., Rolfe F. L., Lockhart M. M., Frampton C. M., O'Sullivan J. D., Fung V., Smith R. A. J., Murphy M. P., Taylor K. M. A double-blind, placebocontrolled study to assess the mitochondria-targeted antioxidant mitoQ as a disease modifying therapy in Parkinson's disease. Mov Disord. 2010;25:1670–1674. doi: 10.1002/mds.23148. [DOI] [PubMed] [Google Scholar]
- 47.Gane E. J., Weilert F., Orr D. W., Keogh G. F., Gibson M., Lockhart M. M., Frampton C. M., Taylor K. M., Smith R. A. J., Murphy M. P. The mitochondria-targeted antioxidant mitoquinone decreases liver damage in a phase II study of hepatitis C patients. Liver Int. 2010;30:1019–1026. doi: 10.1111/j.1478-3231.2010.02250.x. [DOI] [PubMed] [Google Scholar]
- 48.Ueno Y., Horio F., Uchida K., Naito M., Nomura H., Kato Y., Tsuda T., Toyokuni S., Osawa T. Increase in oxidative stress in kidneys of diabetic Akita mice. Biosci. Biotechnol. Biochem. 2002;66:869–872. doi: 10.1271/bbb.66.869. [DOI] [PubMed] [Google Scholar]
- 49.Fujita H., Fujishima H., Chida S., Takahashi K., Qi Z., Kanetsuna Y., Breyer M. D., Harris R. C., Yamada Y., Takahashi T. Reduction of renal superoxide dismutase in progressive diabetic nephropathy. J. Am. Soc. Nephrol. 2009;20:1303–1313. doi: 10.1681/ASN.2008080844. [DOI] [PMC free article] [PubMed] [Google Scholar]
- 50.Oudit G. Y., Liu G. C., Zhong J., Basu R., Chow F. L., Zhou J., Loibner H., Janzek E., Schuster M., Penninger J. M., et al. Human recombinant angiotensin converting enzyme 2 reduces the progression of diabetic nephropathy. Diabetes. 2009;59:529–38. doi: 10.2337/db09-1218. [DOI] [PMC free article] [PubMed] [Google Scholar]
- 51.Nasrallah R., Robertson S. J., Hebert R. L. Chronic COX inhibition reduces diabetes-induced hyperfiltration, proteinuria, and renal pathological markers in 36-week B6-Ins2Akita mice. Am. J. Nephrol. 2009;30:346–353. doi: 10.1159/000229304. [DOI] [PubMed] [Google Scholar]
- 52.Rossini M., Naito T., Yang H., Freeman M., Donnert E., Ma L. J., Dunn S. R., Sharma K., Fogo A. B. Sulodexide ameliorates early but not late kidney disease in models of radiation nephropathy and diabetic nephropathy. Nephrol. Dial. Transplant. 2010;25:1803–1810. doi: 10.1093/ndt/gfp724. [DOI] [PMC free article] [PubMed] [Google Scholar]
- 53.Hohenstein B., Daniel C., Hausknecht B., Boehmer K., Riess R., Amann K. U., Hugo C. P. M. Correlation of enhanced thrombospondin-1 expression, TGF-β signalling and proteinuria in human type-2 diabetic nephropathy. Nephrol. Dial. Transplant. 2008;23:3880–3887. doi: 10.1093/ndt/gfn399. [DOI] [PMC free article] [PubMed] [Google Scholar]
- 54.Liu Y. Epithelial to mesenchymal transition in renal fibrogenesis: pathologic significance, molecular mechanism, and therapeutic intervention. J. Am. Soc. Nephrol. 2004;15:1–12. doi: 10.1097/01.asn.0000106015.29070.e7. [DOI] [PubMed] [Google Scholar]
- 55.Lin C. L., Wang J. Y., Ko J. Y., Huang Y. T., Kuo Y. H., Wang F. S. Dickkopf-1 promotes hyperglycemia-induced accumulation of mesangial matrix and renal dysfunction. J. Am. Soc. Nephrol. 2010;21:124–135. doi: 10.1681/ASN.2008101059. [DOI] [PMC free article] [PubMed] [Google Scholar]
- 56.He W., Dai C., Li Y., Zeng G., Monga S. P., Liu Y. Wnt/β-catenin signaling promotes renal interstitial fibrosis. J. Am. Soc. Nephrol. 2009;20:765–776. doi: 10.1681/ASN.2008060566. [DOI] [PMC free article] [PubMed] [Google Scholar]
- 57.Funato Y., Michiue T., Asashima M., Miki H. The thioredoxin-related redox-regulating protein nucleoredoxin inhibits Wnt–β-catenin signalling through dishevelled. Nat. Cell Biol. 2006;8:501–508. doi: 10.1038/ncb1405. [DOI] [PubMed] [Google Scholar]


